


 English (pdf)
 Article in xml format
 Article references
 Send this article by e-mail
 Cited by SciELO
  Cited by Google
  Similars in
SciELO
Similars in
SciELO  Similars in Google
 Permalink
Introduction
Waste stabilization ponds (WSPs) are widely used across the world as passive wastewater treatment for domestic effluents; WSPs are recommended to treat wastewater in small communities [1], [2]. Due to the simplicity of their design, low cost, minimal maintenance, and low-skilled operators, WSPs have become one of the most popular biological wastewater treatment systems applied in many places around the globe [3 - 5]. WSP is a natural technology installed in centralized or semi-centralized sewerage systems for treating domestic wastewater, septage and sludge, and animal and industrial wastes. It can be used as a secondary or tertiary treatment unit in a treatment plant individually or in a coupling manner [6], [7]. In developing countries, where sufficient land is available, using WSPs is the simplest and most sustainable municipal wastewater treatment method [8], [9]. One of the most important benefits of adopting WSPs in the treatment process is their tolerance towards system shocks and significant fluctuations in wastewater characteristics, including flow rate, biochemical oxygen demand, total suspended solids, and ambient, and inflow temperature [10]. In WSPs, algae and heterotrophic bacteria coexist for the treatment; such microorganisms control the effluent’s treatment efficiency and quality [11], [12].
The main objective of this research was to study the behavior and evaluate the performance of a group of four polishing ponds during the post-treatment of sanitary sewage by monitoring variables such as DO, pH, alkalinity, BOD, COD, TKN, organic nitrogen, NH3, N-NO3, TP, PO4 3-, TSS and chlorophyll-a. In addition, the planktonic communities (phytoplankton and zooplankton) were also quantified.
Materials and Methods
Study Site
This research was carried out in Viçosa, State of Minas Gerais, Brazil (20°45’14” S, 42°52’54” W), at the Integrated Unit for Sewage Treatment and Effluent Use of the Violeira neighborhood, and is focused on the treatment of an average flow rate of 115 m3/d. The pre-treatment units included an upflow anaerobic sludge blanket (UASB) reactor and a submerged aerated biofilter, both at full scale; four pilot scale polishing ponds, pre-fabricated in glass fiber, were used as post-treatment units, with an effective individual area of 16.3 m2, an average effective depth of 0.90 m and a length/width ratio equal to 2.0 (Fig. 1).
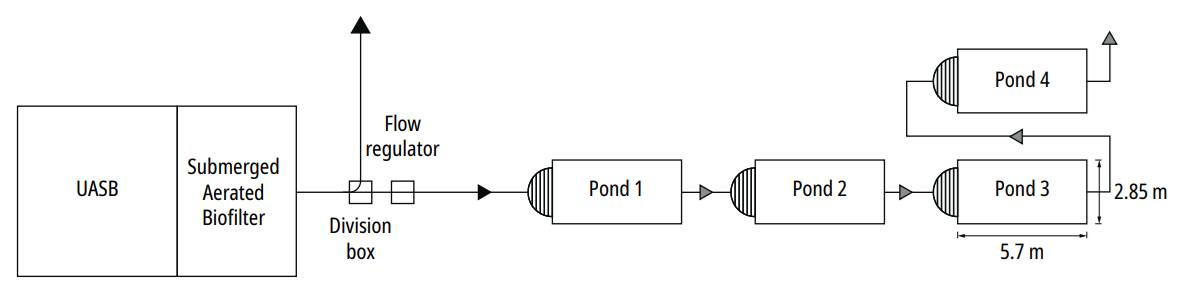
The research was carried out from February 2009 to June 2010, as operational malfunctioning prompted an interruption in November and December. In the course of the study, the pond group operated under two different hydraulic retention times (HRT), thence characterizing the two following operational periods: from February to October 2009 -Period I-: pond flow rate Q = 3.5 m3/d, HRT = 4 days in each pond; January to June 2010 -Period II-: Q = 2m3/d, HRT = 7 days in each pond.
Sampling and data analysis
The water’s physical and chemical variables were measured in situ: temperature, with a bulb thermometer; dissolved oxygen, measured with an oximeter (Digimed, model DM-4); and pH, measured by a pH meter (Digimed, model DM-21). The measurements were performed on three water levels: superficial (15 cm), medium (45 cm), and full-depth (90 cm).
The samplings were trialed during the two aforementioned operational periods via water collection from polishing ponds P1, P2, P3, and P4. At the Water Quality Control of Water and Sewage Division of the Universidade Federal de Viçosa (UFV), the following variables were monitored: BOD, COD, TSS, organic nitrogen, NH3, N-NO3, TP, PO4 3-, alkalinity and chlorophyll-a. In addition, the physical and chemical variables were monitored according to the recommendations of Standard Methods for the Examination of Water and Wastewater [13].
Water transparency was determined by lowering a 0.30 m white Secchi disk into the water until the white part of the disk disappeared; the depth of the disk in the water is the value of transparency [14], [15].
The data herein employed concerning precipitation (mm) and air temperature (°C) were granted by the meteorological station located at the UFV.
The phytoplankton composition was studied through samplings performed with a plankton net with 20 μm mesh. The samples were collected with horizontally oriented drag force at a subsuperficial level. The samplings thus collected were separated into two groups, of which one was fixed with a formaldehyde solution of 4%, and the other was kept alive for further observation of its morphology - an ensemble of essential characteristics towards the act of taxonomic identification. These taxonomic inquiries used a Zeiss-branded microscope, model Axioskop, built-in phase contrast, epifluorescence, and a photographic camera.
The samplings for the study of phytoplankton density were carried out near the effluent tubes of each pond via a depth collector. The samples were preserved in a solution of acetic Lugol 5%, and phytoplankton density was gauged through the Sedgwick-Rafter chamber method of cell counting [13], making use of a Zeiss microscope, Axioskop model, whose sight was magnified four-hundredfold, of which it was a far-reaching objective lens.
The samples for analysis of the zooplankton were collected with a plankton net, whose mesh openings amounted to 68 μm, contained in glass recipients, and preserved with formaldehyde 4%. Further taxonomic analysis and the quantification of organisms required using a stereoscopic microscope and an optic microscope magnified up to a thousandfold. The taxonomic analysis was performed at the level of large groups, using specialized literature concerning each group. Concurrently, the organisms were quantified using an acrylic cuvette of checkered background, and an individual/liter ratio expressed their population density.
Results and Discussions
Climate variables
According to the Koppen climate classification, the region has a hot temperate climate with rainy summers and, conversely, dry, cold winters. The annual average of the rainfall index, relative humidity, and the yearly average temperature correspond to 1268.2 mm, 81%, and 20°C [16].
Table 1 presents the values of monthly pluviometric precipitation and air temperature at the municipality of Viçosa between February of Period I and June of Period II.
Table 1 During the study period, monthly pluviometric precipitation (Prec.) and average air temperature (Air T.) at the municipality of Viçosa-MG.
| Month | Feb I | Mar I | Apr I | May I | Jun I | Jul I | Aug I | Sep I | Oct I |
| Prec. (mm) | 170.2 | 273.4 | 29.9 | 0.8 | 38.2 | 1 | 13.2 | 96 | 123.5 |
| Air T. (°C) | 22.5 | 22.2 | 20 | 17.4 | 15.7 | 16.7 | 16.7 | 24.3 | 21 |
| Month | Nov I | Dec I | Jan II | Feb II | Mar II | Apr II | May II | Jun II | |
| Prec. (mm) | 137.5 | 393.5 | 57.9 | 45.5 | 184.8 | 28.1 | 35.4 | 0.9 | |
| Air T. (°C) | 22.9 | 22.4 | 23.2 | 23.3 | 22.2 | 19.6 | 17.5 | 14.1 |
Source: The authors
Physical and Chemical Variables of Water
Water transparency
The transparency of the water column displayed a trend of increasing values from P1 to P4. The polishing ponds P1, P2, P3, and P4 presented the following average values and respective standard deviations: 40 ± 9, 45 ± 19, 48 ± 16, and 63 ± 20 cm. The maximum values obtained in P1 through P4 were 61.5, 88.5, 78.0, and 96.0 cm, and the minimum values were 27.0, 15.0, 24.0, and 28.5 cm, respectively.
The more transparent the water column, the better the light penetrates it. Therefore, photosynthetic activity increases, which culminates in oxygen production, thereby elevating pH, as it remains to be articulated in the following item.
Temperature, DO, and pH
Table 2 presents the maximum and minimum values measured, as well as the average values and standard deviations of the variables water temperature, DO, and pH for three different points concerning their positions in the water column: surface point (15 cm: SP), medium point (45 cm: MP) and bottom point (90 cm: BP) of the four ponds herein studied.
Table 2 Minimum, maximum, and average values, and standard deviations for T, DO, and pH of the surface point (SP), medium point (MP), and bottom point (BP) found in the four ponds during research.
Source: The authors
The water temperature in the ponds exhibited low variation between the treatment units during the study period (Table 2). In broad terms, the temperatures recorded were higher at the surface than at the bottom of the ponds.
During the research, the behavior of the water temperature followed the same dynamics of the environmental temperature presented in Table 1, representing both an increase and a decrease of these values due to the respective climatic periods of rain and drought in the municipality.
As expected, the highest dissolved oxygen concentrations were found on the surface of the ponds. The vertical DO profiles indicated decreasing levels in relation to the depth, as presented in Table 2. Pastich et al. [17] recorded high DO levels at the surface of a secondary maturation pond with a depth of 1.45 m and HRT of 6.8 days, with an average monthly concentration above 13.5 mg/L and low monthly average concentrations at the bottom, which amounted to 0.2 mg/L.
The behavior of the concentrations measured in the series of ponds corroborated the findings reported by Bastos et al. [18] in a study carried out in the same pond system, which observed, in general, a DO variation pattern with a tendency to increase as one progresses in the series of ponds and with more accentuated variations on the surface, resulting from the balance between photosynthesis and breathing activity (bacterial and algal), typical of daytime and night-time and along the depth of the pond.
Based on the pH data in the depth profile of the ponds over the research period, a variation pattern was observed with a surface reduction towards the bottom of the treatment units and a general increasing tendency as the pond series progresses.
The results revealed an alkaline condition in the water column, with a slight tendency to acidification at the bottom. In addition, a general pattern of pH variation similar to that of DO was observed, with an increasing trend ranging from Ponds 1 through 4; a similar condition was reported by Ouali et al. [19] in a series of three full-scale maturation ponds, with individual HRTs ranging from 2.46 to 2.85 days, located in Tunisia, which treated the effluent from a system of activated sludge.
In stabilization ponds, the photosynthesis carried out by microalgae increases the pH, which can reach values higher than 9.0 since there is high photosynthetic activity [20], a condition observed in the maximum values measured on the surface of the ponds.
Alkalinity
In general, decreased alkalinity was observed throughout the treatment process, a phenomenon reported by Pontes et al. [21] in the post-treatment of UASB reactor effluents through polishing ponds. The following average values and the standard deviations were calculated for the P1, P2, P3, and P4 ponds: 135 ± 53, 105 ± 54, 84 ± 40, and 71 ± 34 mg CaCO3/L, respectively. The minimum values measured in such ponds were 63, 30, 30, and 18 mg/L, recorded between February and May of the first year, and the maximum values were 272.2, 236.6, 182.2, and 134.0 mg CaCO3/L, measured in October of the same year, probably related to the precipitation of that month.
In stabilization ponds, several processes affect alkalinity and/or acidity (in turn, indirectly disturbing the pH value). The most critical processes are the biological removal of CO2 when photosynthetic consumption predominates over the production by bacteria or by desorption into the atmosphere and the desorption of NH3, equivalent to adding a strong acid [22]. In Bastos et al. [18] research on polishing ponds, reduced alkalinity was associated with high ammonia removal throughout the ponds.
Biochemical Oxygen Demand
Figure 2 presents the variations in BOD over the two study periods. The highest BOD values were generally registered in ponds P1 and P2, with gradual reduction towards P3 and P4.
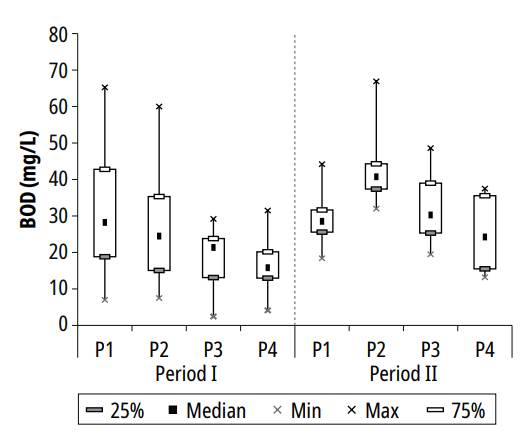
During the first period of study, the decreased concentrations along the series of ponds may have been caused by the stabilization of organic matter by the bacterial community. For the second period, although a lower organic load was applied due to lower HRT, the increased BOD concentrations, especially in the second pond (Fig. 2), were associated with higher algal biomass proliferation; similar behavior was reported by Dias et al. [23] in the second maturation pond treating UASB reactor effluent.
The maximum BOD concentrations measured in ponds P1, P2, P3, and P4 during the research were, respectively, 65.3, 66.9, 48.6, and 37.5 mg/L; the minimum values reported in the ponds were 14, 16, 12, and 10 mg/L. The mean values and respective standard deviations were: 30.1 ± 14.1, 32.6 ± 15.6, 23.9 ± 11.6, and 20.2 ± 9.8 mg/L. These concentrations are similar to those reported by Amengual-Morro et al. [24] in a maturation pond with an HRT of 21 days. Based on average concentrations in ponds 1 and 4, the average efficiency of BOD removal was 32.9%.
The performance of the ponds in BOD removal is an excellent complement to that achieved by the UASB reactor in association with the aerated biofilter, especially considering that Bastos et al. [25], in an operational control study of the same type of treatment system, reported that average BOD removal efficiency in UASB may reach values above 80%.
Chemical oxygen demand
Figure 3 presents the variation of COD concentrations during the study period.
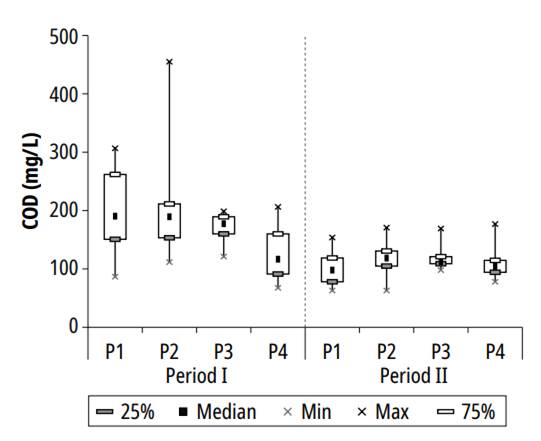
The variation in the values of this variable was similar to those exhibited by BOD. An increase was observed in the second pond and a decrease in the two following ponds. The maximum concentrations of COD recorded in the research were 306.7, 455.0, 198.8, and 206.3 mg/L for ponds P1, P2, P3, and P4, respectively, and the minimum values registered in the series of ponds were 63, 63, 98 and 67.5 mg/L.
The following values were obtained for the average concentration and standard deviation for each pond: 162.6 ± 75.3 in pond P1; 169.3 ± 80.9 in pond P2; 150.1 ± 35.6 in pond P3; and 119.5 ± 40.2 mg/L in P4. The average COD removal efficiency of 26.5% was obtained based on the average concentrations found in ponds 1 and 4. The relatively low COD removal in polishing ponds results from high algae concentration, predominant in this kind of treatment unit, representing organic matter [21], [23]. In a maturation pond with HRT of 21 days, after a two-year long monitoring, Amengual-Morro et al. [24] reported increased average concentrations of COD effluent with COD affluent, ranging from 343.7 to 375.1 mg/L.
Total suspended solids
In both study periods, an increasing trend was observed in TSS concentration, from P1 towards P2, which was also found by Dias et al. [23] in the second maturation pond in the post-treatment of UASB reactor effluent. At the same time, reduction was detected in P3 and P4 (Fig 4).
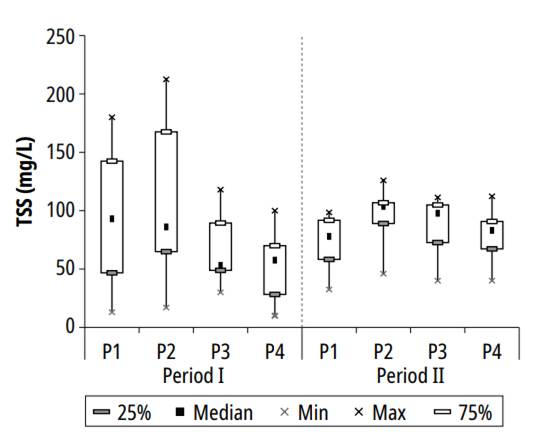
Mean values and standard deviations for TSS, calculated in ponds P1, P2, P3, and P4, were, respectively, 87.9 ± 46.4, 101.0 ± 51.2, 74.4 ± 28.8, and 62.4 ± 29.1 mg/L, which are close to the values reported by Pontes et al. [21] in post-treatment of UASB reactor effluent in polishing ponds, with HRT between 6 and 12 days, and water column depth of 45 cm. The minimum values recorded in each pond were 13, 17, 30, and 10 mg/L, and the maximum values were 180.0, 212.5, 118.0, and 112.3 mg/L. Based on the average concentrations of ponds 1 and 4, the average TSS removal efficiency during the experiment was 29.0%.
Nitrogen compounds
A gradual decrease in nitrogen compound concentrations was generally observed in the series of ponds during the study period, demonstrating the efficiency of polishing ponds in removing this macronutrient.
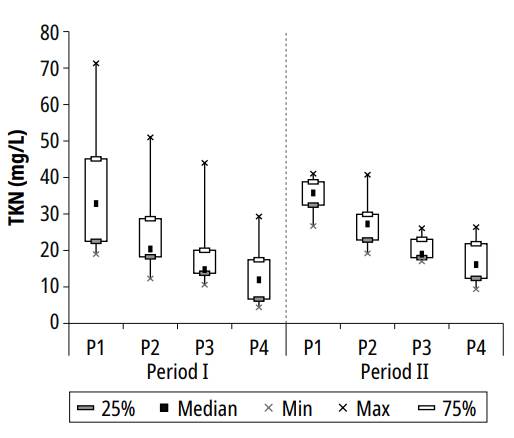
Figure 5 presents TKN variation in the series of ponds during the research period.
Source: The authors
Figure 5. Variation of TKN concentration in the series of ponds during the study periods
In both periods, related behavior was observed in the series of ponds, with less variability in the second period, probably due to longer HRT. The highest concentrations of TKN during the experiment were 71.3, 51.0, 44.0, and 29.3 mg/L, respectively, found in ponds P1, P2, P3, and P4; the following means and standard deviation were calculated for the ponds: 35.8 ± 13.4, 26.2 ± 10.9, 20.4 ± 9.3 and 14.9 ± 7.4 mg/L; and the lowest concentrations recorded were 19, 12.3, 10.6 and 4.4 mg/L. The average concentrations calculated in ponds 1 and 2 were compatible with the ones reported by Pastich et al. [17] in a secondary maturation pond with an HRT of 6.8 days.
Based on average concentrations of pond 1 and pond 4, the TKN removal efficiency during the experiment was 58.4%, with better performance in the second pond, a condition also observed in the one exhibited by Dias et al. [23] in a treatment system composed of a UASB reactor followed by 2 maturation ponds and a granular filtration unit. Chiatti and von Sperling [26] evaluated the performance of polishing ponds in the removal of nitrogen in a system with 2 to 4 ponds in series, with depths of 0.4 and 0.8 m and HRT of 5.7 and 12.5 days; the authors observed that the series with 0.4 m depth (HRT = 5.74 d) were more efficient in total nitrogen removal (68%), while the series with 0.8 m (HRT = 12.48 d), reported a 59% average of total nitrogen removal, a value close to the average registered in the present research.
The mean values and standard deviation calculated for ammonia in ponds P1, P2, P3, and P4 were, respectively, 21.7 ± 8.8, 10.4 ± 9.8, 5.3 ± 7.1, and 2.7 ± 4.7 mg/L; the maximum concentrations registered in the ponds were 43.4, 36.9, 27.9 and 14.7 mg/L; and the minimum measured values were 6.4 mg/L in pond P1; and 0 mg/L in ponds P2, P3 and P4. Based on the average concentrations of ponds 1 and 4, the standard ammonia removal efficiency during the experiment was 87.5%. Again, the best performance was observed in the second pond, which was also reported by Dias et al. [23]. The ammonia levels in the ponds were similar to those in facultative primary ponds at full scale, measured by Cruz [27], with concentrations ranging from 11.9 mg/L on the surface to 41.3 mg/L on the bottom.
Regarding organic nitrogen, the maximum concentrations measured in ponds P1, P2, P3, and P4 were, respectively, 35.0, 29.4, 42.6, and 24.1 mg/L; the respective mean values and standard deviations were: 16.0 ± 6.5, 15.9 ± 6.4, 15.1 ± 7.4 and 12.1 ± 5.2 mg/L; and the minimum concentrations registered were 7.3, 2.6, 8.2 and 4.4 mg/L. Therefore, based on the average concentrations of ponds 1 and 4, the standard organic nitrogen removal efficiency during the experiment was 24.4%.
The particulate organic nitrogen may be settled at the bottom of the pond or hydrolyzed to soluble organic nitrogen, which may be mineralized to ammonia. Other sedimentation processes of organic nitrogen can be auto-flocculation and microalgae sedimentation [22]. According to Arceivala [28], microalgae cell structure comprises 6 to 12% of nitrogen dry weight. von Sperling [20] estimated that the percentage of nitrogen removal through algae biomass loss with effluent is between 10 and 20%.
The maximum nitrate measured concentrations were 13.0, 9.7, 10.6, and 13.5 mg/L, respectively, in ponds P1, P2, P3, and P4; the following average values and the standard deviation were obtained for the ponds: 5.3 ± 3.1, 5.0 ± 2.6, 5.6 ± 2.6 and 4.8 ± 2.7 mg/L; and the lowest concentration levels were 1.9, 2.5, 1.9 and 1.7 mg/L. Therefore, based on the average concentrations of ponds 1 and 4, the standard nitrate removal efficiency during the experiment was 9.4%.
The following mean values and standard deviations of nitrate concentrations were measured in the series of ponds during the first research period: 6.7 ± 2.5, 6.4 ± 2.5, 6.7 ± 2.2, and 4.7 ± 2.1 mg/L, and in the second period: 3.2 ± 1.1, 2.8 ± 0.3, 4.0 ± 2.5 and 4.9 ± 3.6 mg/L. In the first period, when receiving a greater effluent flow from the aerated biofilter, pond P1 also received higher nitrate levels, but there was a progressive decrease due to algae assimilation. However, P1 received lower nitrate levels in the second period due to longer HRT. Nevertheless, the concentrations presented a slight increase, probably due to favorable conditions for nitrification processes in the submerged aerated biofilter that transformed a higher amount of ammonia into nitrates when compared to the fraction assimilated by algae. The registered concentrations were usually superior to those measured by Dias et al. [23] in polishing ponds as they treated UASB reactor effluent.
Total phosphorus and orthophosphate
The variation of total phosphorus in the series of ponds is represented in Fig 6.
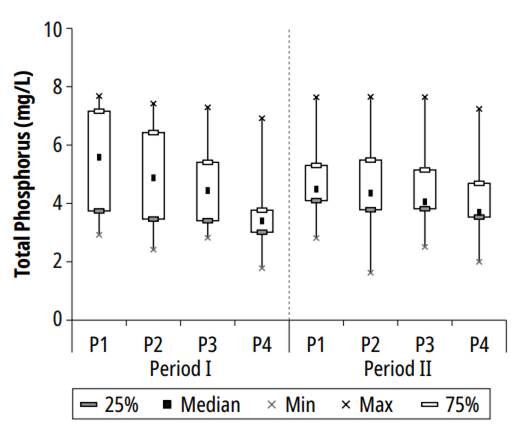
During the research, in ponds P1, P2, P3, and P4, the respective maximum concentrations measured for TP were 7.7, 7.7, 7.6, and 7.2 mg/L; the following mean values and standard deviations were found: 5.2 ± 1.7, 4.8 ± 1.8, 4.5 ± 1.5 and 3.8 ± 1.5 mg/L; and the minimum measured concentrations were 2.8, 1.6, 2.5 and 1.8 mg/L. Based on the average concentrations of ponds 1 and 4, the TP removal efficiency detected during the experiment was 26.9%. The average calculated concentrations in pond 4 were similar to those reported by Pastich et al. [17], in a secondary maturation pond with an HRT of 6.8 days, in Pernambuco-Brazil.
The variation of orthophosphate concentrations in the polishing ponds is presented in Fig. 7.
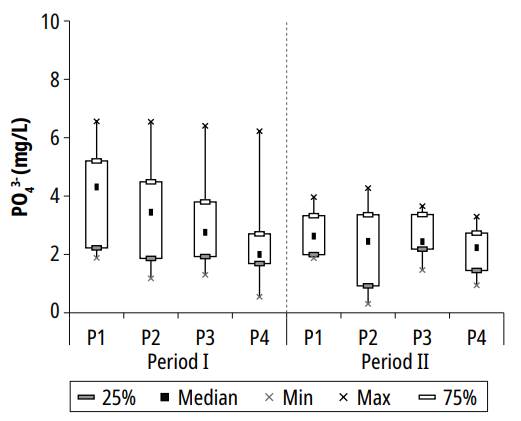
In ponds P1, P2, P3, and P4, the respective maximum concentrations of orthophosphate were 6.6, 6.5, 6.4, and 6.2 mg/L; the mean values and standard deviations for orthophosphate were 3.5 ± 1.5, 2.9 ± 1.7, 2.8 ± 1.2 and 2.3 ± 1.2 mg/L; the minimum concentrations registered were 1.9, 0.3, 1.3 and 0.5 mg/L. Based on the average concentrations of ponds 1 and 4, the orthophosphate removal efficiency during the experiment was 34.3%. The average concentrations calculated in the series of ponds were similar to the average monthly concentrations reported by Pastich et al. [17] while monitoring a secondary maturation pond.
While studying polishing ponds in Campina Grande - Brazil, Cavalcanti et al. [22] observed that higher phosphorus removals (60 to 80%) are only reached in shallow ponds (h <0.65 m), with at least 9 pH units. In general, the rate of orthophosphate removal was slightly higher than that of total phosphorus removal, following the data reported by Assunção and von Sperling [29] in a series of three polishing ponds treating UASB reactor effluent, with individuals HRT between 1.5 and 4.3 days.
Biological Variables
Chlorophyll-a and phytoplankton community
The variation of Chlorophyll-a concentration in the series of ponds presented a decreasing tendency in P1 towards P4 during the study, and the highest values were registered in pond P2. The maximum concentrations recorded were 554.5, 453.9, 465.8, and 385.0 μg/L, respectively, in ponds P1, P2, P3, and P4; the mean values and standard deviations were: 200.3 ± 150.5, 222.2 ± 123.5, 149.8 ± 115.4 and 99.8 ± 120.6 μg/L; and the minimum measured concentrations were 0, 39.5, 4.5 and 0 μg/L.
During the research, individuals from seven classes were observed: Chlorophyceae, Eugleno-phyceae, Cyanophyceae, Cryptophyceae, Zygne-maphyceae, Chrysophyceae, and Dinophyceae. The first four were numerically representative. The highest densities observed in the pond correspond to individuals from class Chlorophyceaea, as shown in Table 3.
Table 3 Minimum values (Min), maximum values (Max), average values (Av), and standard deviation (SD), in cell/mL, for the numerically representative phytoplankton classes in the four ponds during the research
| Class | Pond | Min | Max | Av ± SD | Pond | Min | Max | Av ± SD |
|---|---|---|---|---|---|---|---|---|
| Chlorophyceae | P1 | 6861 | 146994 | 33000 ± 32964 | P2 | 5182 | 90947 | 36859 ± 26256 |
| P3 | 1714 | 96452 | 27803 ± 25706 | P4 | 2060 | 129023 | 27003 ± 33574 | |
| Euglenophyceae | P1 | 241 | 24633 | 6924 ± 6875 | P2 | 273 | 17570 | 5444 ± 5901 |
| P3 | 98 | 9672 | 2272 ± 2626 | P4 | 29 | 9625 | 1572 ± 2310 | |
| Cyanophyceae | P1 | 85 | 23021 | 3345 ± 5169 | P2 | 0 | 9254 | 2540 ± 2832 |
| P3 | 0 | 10591 | 3228 ± 3356 | P4 | 310 | 15260 | 3805 ± 3843 | |
| Cryptophyceae | P1 | 0 | 14814 | 2074 ± 4018 | P2 | 0 | 14555 | 1735 ± 3610 |
| P3 | 0 | 5885 | 1207 ± 1997 | P4 | 0 | 8483 | 1091 ± 1904 |
Source: The authors
During the research, the phytoplankton community was generally represented by the following classes: Chlorophyceae (51.5%), Euglenophyceae (20.4%), Cyanobacteria (17.5%), Cryptophyceae (5.8%), Zygnemaphyceae (1.9%), Chrysophyceae (1.9%) and Dinophyceae (1.0%).
Organisms from class Chlorophyceae are opportunistic microalgae that develop well under extreme conditions, especially in waters with a high level of eutrophication. This class was predominant in polishing ponds in Vitória, Espírito Santo-Brazil [27]; in a polishing pond with HRT of 10.5 days in Venda Nova do Imigrante, Espírito Santo-Brazil [30] and in a primary facultative pond in Barbalha, in the state of Ceará-Brazil [31].
During the study period, the class Euglenophy- ceae exhibited the highest densities in ponds P1 and P2 and much lower concentrations when compared to the class Chlorophyceae, with a maximum value of 4633 cells/mL. An opposite behavior was observed in Euglenophyceae’s growth if compared to Chlorophyceae’s growth in the series of ponds. The predominant classes in the primary facultative pond and the maturation pond of the wastewater treatment plant of Trindade in the State of Goiás- Brazil were Chlorophyceae, Euglenophyceae, and Cyanophyceae [32], with HRT of 4.8 and 2.5 days, respectively.
The highest densities of individuals from class Cyanophyceae were registered in pond P1 in February of Period II and in August of Period 0 in P4. No organisms from class Cyanophyceae were found either in samplings from February of Period I in P3 or in August of Period I, March, and May of Period II in P2.
The class Cryptophyceae exhibited low-density values during the sampling period, ranging between the minimum of 23 cells/mL in P3 (February of Period I) and the maximum of 14814 cells/ mL in P1. In addition, there was an evident time separation, with low densities in the first period of the experiment and higher values during the second.
While investigating the effect of HRT and surface loading rate on the composition of phytoplankton community in polishing ponds on a pilot scale, von Sperling and Oliveira [33] observed the dominance of classes Chlorophyceae and Euglenophyceae. In the present study, statistical results pointed to a significant difference in the density of class Cryptophyceae during the sampling period. Furthermore, low density coincided with the period when the system was operated with shorter HRT (4 days), revealing changes in the planktonic community.
The classes that exhibited the lowest densities were Dinophyceae (38 to 506 cells/mL) and Zigne- maphyceae (37 to 1502 cells/mL), and organisms from class Dinophyceae were only found in three sampling collections: October of Period I and January and May of Period II.
Zooplankton community
In general terms, the zooplankton found in the series of ponds presented low density, with total values of 460 org/mL in P1, 2506 org/mL in P2, 1149 org/mL in P3 and 597 org/mL in P4.In the studied system, regarding total densities, the group Rotifer exhibited the highest densities in ponds P1, P2, P3, and P4, with 195.9, 2172.0, 781.9, and 406.9 organisms/mL; the group Cladoceran revealed total densities of 82.8, 134.6, 81.8 and 37.0 organisms/mL; and the densities of group Copepod were 31.3, 130.0, 216.1 and 75.3 organisms/mL; the total densities of mosquito larvae were 149.5, 70.1, 72.7 and 83.3 organisms/mL.
The Zooplankton community presented time variation during the study period, with the disappearance of some organisms. In P1, zooplankton was not detected in 55% of the samples. In August of Period I, there was a peak in P2, mainly due to Rotifer’s high density (1049 org/mL).
Several studies have demonstrated the sensitivity of the Copepod community to water quality changes [34], [35], which helps to explain the lower densities of these organisms in P1 (where higher organic loads were applied).
Moscoso et al. [36] observed intense proliferation of ciliates, rotifers, copepods, and cladocerans in a series of stabilization ponds in San Juan de Miraflores-Lima, Peru. In the city of Deli, India, Nandini [35] registered rotifers, cladocerans, and copepod populations in two systems of stabilization ponds. Each was distributed in four ponds with varying depths but with individual areas of 0.75 hectares. Ouali et al. [19] also registered Rotifer and Cladoceran populations in three maturation ponds in a series in Tunisia.
Conclusions
The system of polishing ponds studied was efficient in reducing particulate material and organic matter, which resulted in effluents with average concentrations of TSS, BOD, and COD of 62.4, 20.2, and 119.5 mg/L, respectively, with average removal efficiencies of 29.0, 32.9 and 26.5% for such parameters.
The ponds performed well in the removal of nitrogen compounds, with average effluent concentrations in the fourth polishing pond of 14.9, 2.7, 12.1, and 4.8 mg/L, respectively, for NTK, NH3, organic nitrogen, and nitrates, which correspond to removal efficiencies of 58.4, 87.5, 24.4 and 9.4%. The average effluent concentrations for total phosphorus and orthophosphate were 3.8 and 2.3 mg/L, respectively, with average efficiencies of 26.9 and 34.3%.
The total cell density of phytoplankton in the series of ponds presented a wide range of variation, with four numerically representative classes: Chlorophyceae, Euglenophyceae, Cyanophyceae, and Cryptophyceae, whose average densities of 27003, 1572, 3805 and 1091 cells/mL were found in the final effluent.

