Services on Demand
Journal
Article
Indicators
-
 Cited by SciELO
 -
 Access statistics
Related links
-
 Cited by Google
 -
 Similars in
SciELO
 -
 Similars in Google
Share
Revista Facultad Nacional de Agronomía Medellín
Print version ISSN 0304-2847
Rev. Fac. Nac. Agron. Medellín vol.64 no.1 Medellín Jan./June 2011
EFFECTS OF DAYLENGTH AND SOIL HUMIDITY ON THE FLOWERING OF COFFEE COFFEA ARABICA L. IN COLOMBIA
EFECTO DE LA DURACIÓN DEL DÍA Y LA HUMEDAD DEL SUELO SOBRE LA FLORACIÓN DEL CAFETO COFFEA ARABICA L. EN COLOMBIA
Andrés Javier Peña Quiñones1; Víctor Hugo Ramírez Builes2; Alvaro Jaramillo Robledo3; José Raúl Rendón Sáenz4 y Jaime Arcila Pulgarín5
1 Disciplina de Agroclimatología. Centro Nacional de Investigaciones de Café, CENICAFÉ. A.A. 2427, Manizales, Colombia. <andres.pena@cafedecolombia.com>
2 Disciplina de Fitotecnia. Centro Nacional de Investigaciones de Café, CENICAFÉ. A.A. 2427, Manizales, Colombia. <victor.ramirez@cafedecolombia.com>
3 Disciplina de Agroclimatología. Centro Nacional de Investigaciones de Café, CENICAFÉ. A.A. 2427, Manizales, Colombia. <alvaro.jaramillo@cafedecolombia.com>
4 Disciplina de Experimentación. Centro Nacional de Investigaciones de Café, CENICAFÉ. A.A. 2427, Manizales, Colombia. <joser.rendon@cafedecolombia.com>
5 Disciplina de Fitotecnia. Centro Nacional de Investigaciones de Café, CENICAFÉ. A.A. 2427, Manizales, Colombia. <jaime.arcila@cafedecolombia.com>
Recibido: Mayo 16 de 2011; aceptado: Junio 22 de 2011.
Abstract. Coffee flowering data were analyzed in order to explore the effect of two environmental variables that have been considered relevant for this process. Pre-anthesis stage flowers were counted in coffee leaf-rust resistant crops at eight experimental stations (between 2°N and 11°N). Likewise, climatic data were taken to generate a humidity soil index, whereas day longitude data were taken from the Smithsonian Meteorological Tables. Flowering data were compared with a sunshine index to understand better the effect of light on flowering. This data (flowering, soil humidity index and day length) were expressed in a monthly scale and analyzed using linear regression and cross-correlation functions. The main results show that there is a significant correlation between short days and high flowerings, whereas soil humidity (dry months) are related to the phenomenon, but to a lesser extent.
Key words: Coffea arabica L, photoperiod, sunshine, cross correlation, Colombia.
Resumen. Con el objetivo de entender el efecto de las variables ambientales sobre el cultivo del café, se analizaron los datos de floración para explorar el efecto de dos variables que han sido reportadas como importantes en la floración de esta especie. Se contaron flores en etapa de pre-antesis en cafetales sembrados con variedades resistentes a roya en ocho estaciones experimentales entre 2°N y 11°N. A su vez, fueron tomados datos del clima para generar un índice de humedad del suelo, mientras que los datos de longitud del día se tomaron de las tablas meteorológicas del Smithsonian; para entender mejor el efecto de la luz sobre la floración, fueron comparados los datos de floración y un índice de brillo solar. Estos datos (floración, índice de humedad del suelo y longitud del día) se expresaron en escala mensual y se analizaron utilizando regresión lineal y funciones de correlación cruzada. Los resultados muestran que hay una correlación importante entre días cortos y altas floraciones, mientras que la humedad del suelo (meses secos) tienen una relación con el fenómeno, pero con menor correlación.
Palabras clave: Coffea arabica L, fotoperiodo, brillo solar, correlación cruzada, Colombia.
Light plays an important role in plant growth and development. Besides photosynthesis, there are other three processes related with light, namely, phototropism, photomorphogenesis and photoperiodism, which affect growth and development (Mc Donald, 2003). Photoperiodism is the phenomenon showed by many plants in which the length of day or photoperiod determines whether or not vegetative apices switch to flower formation (Tang, 1997). It is a response to the duration and timing of light and dark periods. Thus, plants can be divided into three general photoperiodic types: long day plants (LD), in which flowering occurs only on long days or is accelerated by long day; short day plants (SD), in which flowering occurs only on short days or is accelerated by short days, and day neutral plants (DN), in which the flowering does not respond to day length (Vince-Prue, 1976; Tang, 1997; Mc Donald, 2003).
Several authors point out coffee as an SD plant. Camargo (1985), Wormer and Gituanja (1970) claim that in equatorial regions, where day length variation is small, coffee plants do not have a defined flowering season. Piringer and Borthwick (1955) and Majerowickz and Sondahl (2005) mention a critical photoperiod of 13 - 14 h.
According to the definition of equatorial zone by Seidel et al. (2001), who place it between 10°N and 10°S, Colombian coffee crops are located entirely in this zone (Figure 1). Camayo et al. (2003) found that differences occur all year long in the main coffee growing region in Colombia (Chinchiná, Caldas), just as it was presented by Camargo (1985) and Wormer and Gituanja (1970). Flower bud development is a complex process characterized by two distinct physiological phases: (a) bud initiation and (b) floral bud development. Camayo et al. (2003) showed that pre-anthesis and anthesis stages are related to soil moisture changes and rainy events between dry seasons according to Trojer (1956), Alvim (1960), Barros et al. (1978) and Drinnan and Menzel (1994). In spite of the fact that the work of Camayo et al. (2003) is a contribution to understand the flowering phenomenon in coffee plants, these authors recognize that there is not complete knowledge about what variables are involved in coffee plants flowering (mainly, induction, differentiation, development and latency). For this reason we carried out an experiment to understand the effects of climate elements on flowering of coffee in experimental farms. The aim of this paper is to show relationships between flowering and the most reported responsible variables regarding the phenomenon (photoperiod and soil moisture).
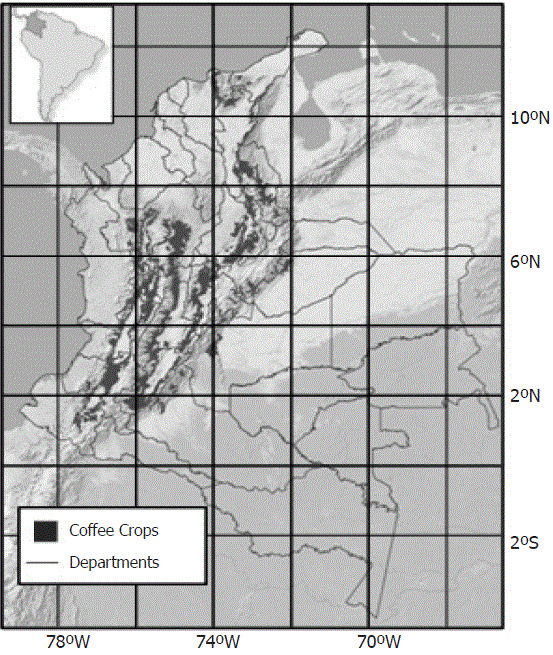
Figure 1. Coffee growing zone in Colombia.
MATERIALS AND METHODS
Flowering data. According to Arcila et al. (2001), each week during two years (May 2008 to April 2010), flower buds at phase 59 (pre-anthesis) were counted in six branches of 30 coffee plants (two and three years old) selected randomly in experimental areas located in eight experimental stations (Table 1). The materials selected to count buds were resistant to coffee rust, Hemilieia vastatrix Berk and Br, (Castillo Varieties and Colombia Variety) and the number of flower buds was expressed in percentage per year (this work evaluates flowering distribution not quantity). Selected branches were in the middle of the stem tree; the first evaluated branch was in the seventh, eighth or ninth pair of branches from the stem apex, according to monthly evaluation. In May, June, November and December flowering distribution was evaluated from the seventh pair of branches, in July, August, January and February it was evaluated from the eight pair of branches and in September, October, March and April it was evaluated from the ninth pair of branches (Figure 2).
Table 1. Location of the coffee experimental stations.
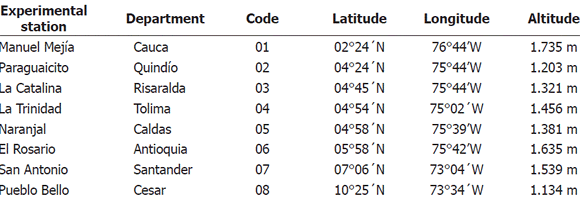
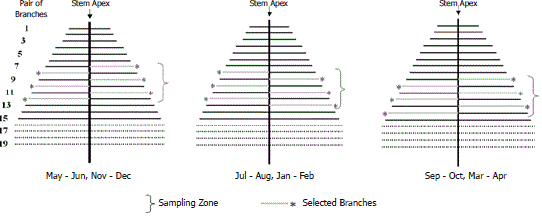
Figure 2. Selection of branches in coffee plants.
Climatic and photoperiod data. Daily climate datasets were registered at eight experimental stations. With these data we calculated a Soil Humidity Index (SHI), which integrates the available soil water with real evapotranspiration and rainfall dataset for each locality (Ramírez et al., 2010). SHI was daily calculated at 40 cm of soil depth, including the soil physical characteristics and the crop conditions for each location. It has values between zero and one: zero (0) means the driest conditions, indicating soil moisture close to residual at that depth and one (1) means that soil moisture is near saturated conditions at that depth. Likewise, if this value is close to one, it indicates that soil moisture is near the saturated conditions at that depth. Besides, a simple sunshine index as sunshine (n)/ photoperiod (N) ratio was calculated as described by Glover and McCulloch (1958); hours of bright sunshine were registered by a Campbell-Stokes recorder, whilst day length (Photoperiod) or astronomical sun light was consulted in the meteorological tables of the Smithsonian Institution (1896).
Effects of photoperiod and soil humidity on flowering. Prior to the analysis, the variables were monthly expressed: photoperiod, sunshine index and soil humidity index as average and cumulated percentage of flowering. The cross correlation analysis was carried out to measure the relationships between photoperiod and flowering and sunshine index and flowering. It can be viewed like a transfer function, as described by Camayo et al. (2003). It was assumed that two series (photoperiod and flowering or n/N ratio and flowering) could be causally related and since this series (photoperiod and n/N ratio) is regarded as the input to a linear system, while the other series (flowering) is regarded as the output, we are interested in finding the properties of the linear system (Chatfield, 1996). To analyze relationship between soil humidity and flowering we use a simple linear regression.
RESULTS AND DISCUSSION
Descriptive analysis.This analysis revealed that, at several experimental stations, the evaluated stage of flowering occurs in a defined season (January to April) independently from soil moisture content (Figure 3). Even with a wet season during 2008 and 2009, without a defined dry season, there was flowering in La Catalina, La Trinidad and Naranjal. In Paragüaicito, under different levels of water content, flowering is more noticeable between February and April, whereas in San Antonio, with constant levels of soil moisture, there is a remarkable flowering between January and March. Two locations did not show this behavior (most flowering between January and April); those are Manuel Mejia and La Trinidad. At La Trinidad, a hypothesis proposed by Camargo (1985) related to constant flower induction may be valid because plants in this place do not have main flowering peaks. In Manuel Mejía Station, coffee plants showed an inverse relation between soil humidity content and flowering.
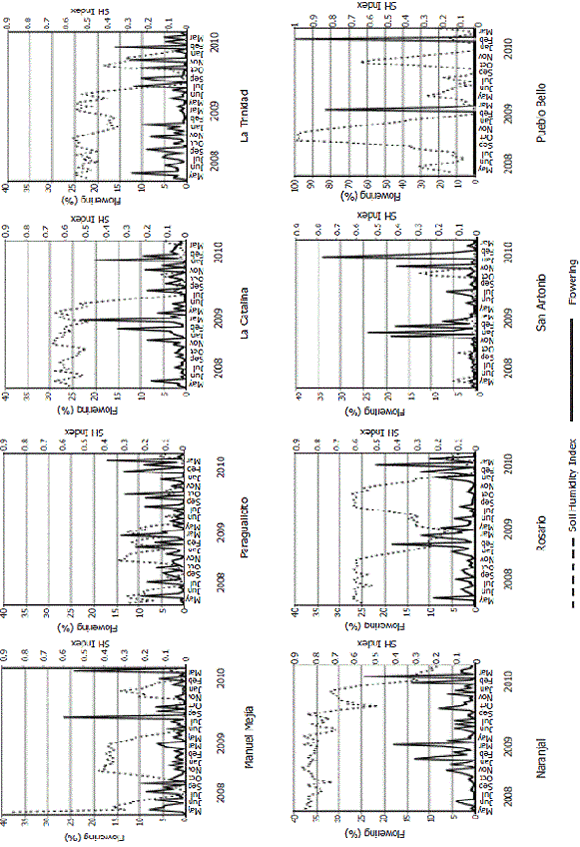
Figure 3. Soil moisture and flowering in coffee crops.
According to Camargo (1985) and Wormer and Gituanja (1970), more concentrated flowerings at northern experimental stations, as in Pueblo Bello, where there is not apparent soil humidity effect on the phenomenon could be expected. Pueblo Bello, San Antonio and El Rosario, northern experimental stations, showed flowering peaks between January and April, while the remaining months showed less or none flowering, apparently this was related to short days (Figure 4). In equatorial zones, coffee plants are exposed to short days (less than 13 or 14 daylight hours). However, there is daylight difference between short days at the end of December (Winter Solstice) and long days in late June (Summer Solstice). Under these conditions, a declining photoperiod has been reported as a flowering inductor in tropical regions (15°N - 15°S) (Njoku, 1963; Rivera and Borchert, 2001) and it could be important above 4.5°N, where differences in length of day can reach about 30 min.
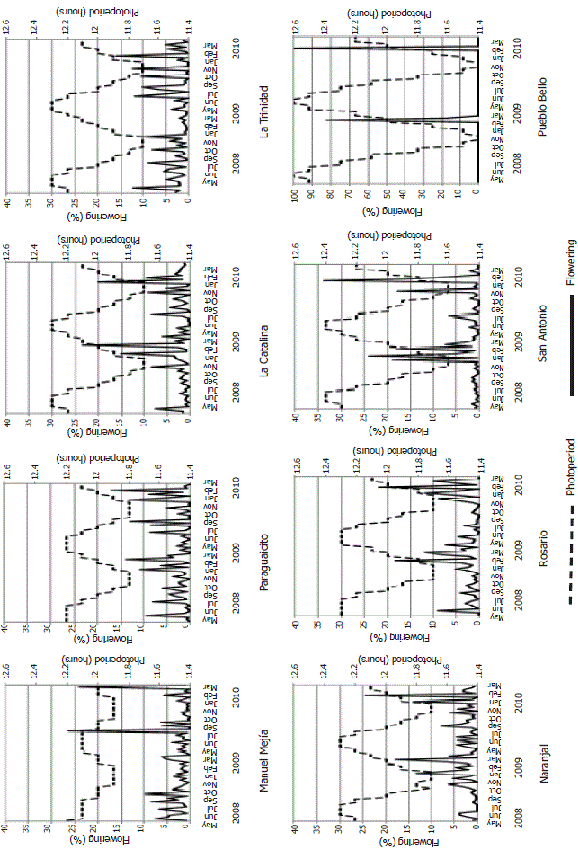
Figure 4. Photoperiod and flowering in coffee crops.
Photoperiod and flowering. Observations indicate that several Colombian regions may have a relationship between flower buds differentiation and photoperiod, mainly at northern zones (Figure 5). Flowering (preanthesis) is inversely related to length of day with a lag of two or three months; that is to say, the most important flowering periods are related with short days that occurred three months before the events. In other words, stage 59 of the flowering (February and March) occur two or three months after daylight became minimum (December 21). However, Camayo and Arcila (1996) mention that flowering process starts four or five months before this stage (October and November), near Autumnal Equinox (last week of September) when length of day decreases during the last week of December and the six-month short days period (less than 12 h) starts. Autumnal Equinox may be an important reference at northern Colombian coffee growing zone (latitude 10°N) where the length of day annual variation is more than one hour (Figure 4) just as it happens in Costa Rica. According to Rivera and Borchet (2001), near 10°N, autumnal Equinox determines a moment of quick photoperiod reduction, probably large enough to be sensed by trees. Besides, several works show that a photoperiod decline (even less than 30 min) can induce flowering. Vince-Prue (1976) defined that a critical length of day often marks the transition between long day and short day.
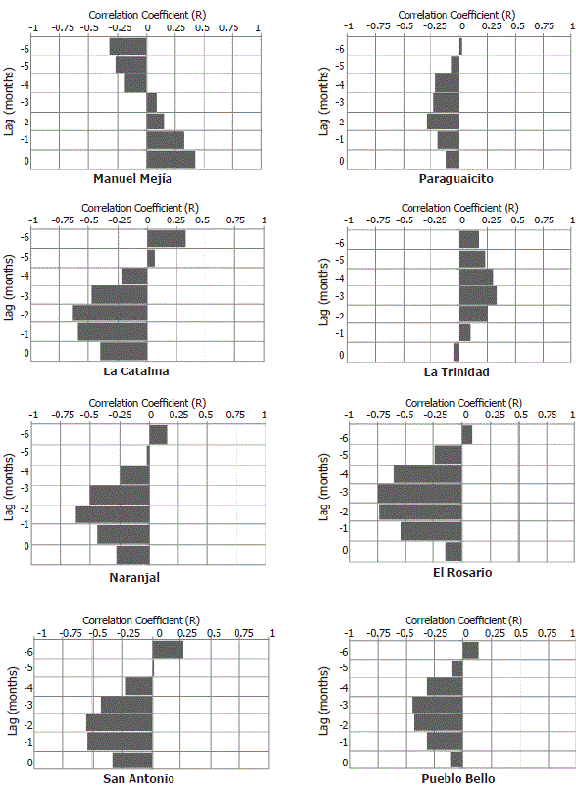
Figure 5. Cross correlation function (Photoperiod – Flowering)
Figure 4 shows that above 4.5°N latitude, photoperiod changes longer than 30 min are expected (between summer solstice and winter solstice). Therefore, there is a relation between flowering and photoperiod (excepting La Trinidad) in northern experimental stations (Figure 4 and Figure 5). La Trinidad station shows an atypical behavior where flowering is related to long photoperiods, as in Manuel Mejia (near 2°N) where flowering is concentrated in longer days.
As mentioned before, two seasons related with flowering in northern experimental stations (above 4.5°N latitude) can be identified: 1) Between Spring Equinox (March) and Autumnal Equinox (September), when flowering is scarce and 2) Between Autumnal Equinox (September) and Spring Equinox (March), when flowering is improved.
Sunshine/photoperiod (n/N) ratio and flowering. Figure 6 shows that there is less relation between n/N ratio and flowering than between photoperiod and flowering. It also shows that there is a negative relation between flowering and these variables. Where there is a direct relation between flowering and n/N ratio, there is a negative relation between flowering and photoperiod. This can be explained by the rainfall dynamics in the Andean and Caribbean regions in Colombia, where the Inter Tropical Convergence Zone (ITCZ) determines the rainy seasons. This zone moves with the apparent movement of the Sun, with a lag between one and three months (León et al., 2000), this means that when photoperiods become longer, hours of bright sunshine are short because rainy seasons are related with less sunshine (Figure 7).
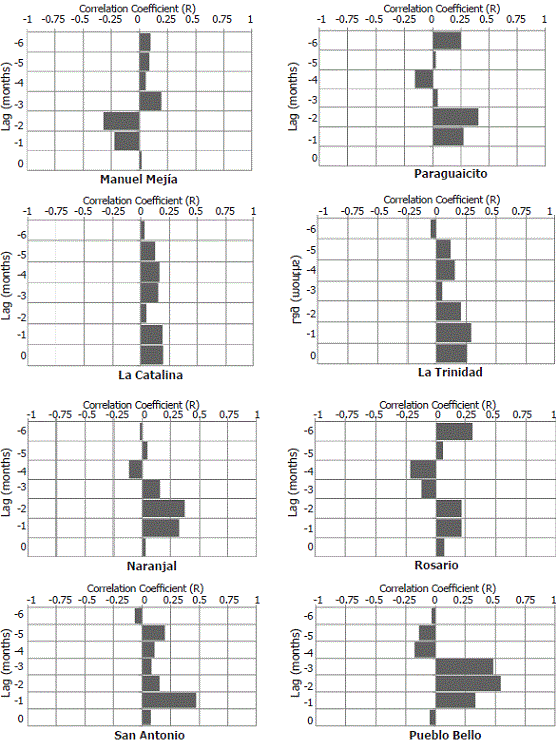
Figure 6. Cross correlation function (n/N ratio – Flowering).

Figure 7. Photoperiod and n/N ratio relationship between January (2008) and December (2010).
Soil humidity and flowering. The relationship between flowering and soil humidity was evaluated as a function of photoperiod seasons; season 1, when length of day is longer than 12 h and season 2, when length of day is shorter than 12 h. We found that flowerings time are associated to soil water deficit (Figure 8), which have been reported by several authors (Trojer, 1956; Alvim, 1960; Barros et. al., 1978; Drinnan and Menzel, 1994). However, the effect of this one on flowering is weaker than the effect of photoperiod (with two lag months). Only in El Rosario Station there was a higher relationship between soil water deficit and flowering; it may be related to local effects, because this experimental station has strongly marked dry periods and these coincide with flowering periods, especially from October to March. In La Catalina and Paragüaicito flowering is possible under two scenarios with a dry season or with a wet season (correlation coefficient near zero). According to Arcila et al. (2007) in Colombia there are four flowering zones, referred to anthesis as follows: South (between 1 and 4°N latitude), Center-South (between 4 and 5°N latitude), Center-North (between 5°N and 8°N latitude) and North (9°N to 11°N latitude). Each zone has a flowering peak season, except for the south zone, the other zones have a great flowering concentration from February to April, showing that above 4°N latitude there are signals of photoperiodism in coffee plants, as found in this work.
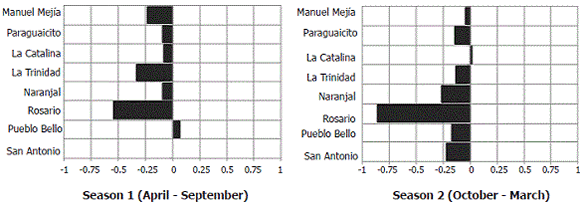
Figure 8. Correlation function (Soil Humidity Index – Flowering).
CONCLUSIONS
In southern experimental stations, near equator (2°N latitude), flowering is related to long days and dry soil, whereas above 4.5°N latitude could have an important photoperiod effect related with more than 30 min of decrease in length of day between June and December. In La Trinidad station, located near 4.5°N latitude, behavior is the same as in the southern experimental station which agrees with the works of Trojer (1968) about Phenological Equator of Coffee. Sunshine index, used to improve photoperiod and flowering correlation, does not have more relation with flowering than photoperiod, and these variables (photoperiod and sunshine index) are inversely related.
BIBLIOGRAPHY
Alvim, P. 1960. Fisiología del crecimiento y de la floración del cafeto. Café 2(6): 57-64. [ Links ]
Arcila, J., L. Buhr, H. Bleiholder, H. Hack, and H. Wicke. 2001. Application of the Extended BBCH-Scale for the description of the growth stages of coffee (Coffea spp.). Centro Nacional de Investigaciones de Café - Cenicafé. 32 p. (Boletín Técnico 23). [ Links ]
Barros, S., M. Maestri and M. Coons. 1978. The physiology of the flowering in coffee: a review. Journal of Coffee Research 8(2-3): 29-73. [ Links ]
Camargo, A.P. 1985. Florescimento e frutificação do café arábica nas diferentes regiões cafeeiras do Brasil. Pesquisa Agropecuária Brasileira 20(7): 831-839. [ Links ]
Camayo, G and J. Arcila.1996. Estudio anatómico y morfológico de la diferenciación y desarrollo de las flores del cafeto Coffea arabica L. variedad Colombia. Cenicafé 47(3): 121-139. [ Links ]
Camayo, G., B. Chaves, J. Arcila and A. Jaramillo. 2003. Desarrollo floral del cafeto y su relación con las condiciones climáticas de Chinchiná, Caldas. Cenicafé 54(1): 35-49. [ Links ]
Chatfield, C. 1996. The analysis of time series, an introduction. pp 136-140. Chapman and Hall, London, England. 333 p. [ Links ]
Drinnan, J. and C. Menzel. 1994. Synchronization of the anthesis and enhancement of vegetative growth in coffee (Coffea arabica L.) following water stress during floral initiation. Journal of Horticultural Science 69(5): 841-849. [ Links ]
Glover, J. and J. McCulloch. 1958. The empirical relation between solar radiation and hours of bright sunshine in the high-altitude tropics. Quarterly Journal of the Royal Meteorological Society 84(359): 56–60. [ Links ]
León, G., J. Zea and J. Eslava. 2000. Circulación general del trópico y la zona de confluencia intertropical en Colombia. Meteorología Colombiana 1: 31-38. [ Links ]
Majerowicz, N. and M. Sondahl. 2005. Induction and differentiation of reproductive buds in Coffea arabica L. Brazilian Journal of Plant Physiology 17(2): 247-254. [ Links ]
Mc Donald, M., 2003. Photobiology of higher plants.Jhon Wiley and Sons, Chichester, England. 354 p. [ Links ]
Njoku, E. 1963. Seasonal periodicity in the growth and development of some forest trees in Nigeria. Observation on mature trees. Journal of Ecology 51(3): 617-624. [ Links ]
Piringer, A. and H. Borthwick. 1955. Photoperiodic response of coffee. RevistaTurrialba 55(3): 72-75. [ Links ]
Ramirez, V., A. Jaramillo and J. Arcila. 2010. Índice para evaluar el estado hídrico en los cafetales. Cenicafé 61(1): 55-66. [ Links ]
Rivera, G. and R. Borchert. 2001. Induction of flowering in tropical trees by a 30-min reduction in photoperiod: evidence from field observations and herbarium specimens. Tree Physiology 21(4): 201-212. [ Links ]
Seidel, J., R. Ross, J. Angell and G. Reid. 2001. Climatological characteristics of the tropical tropopause as revealed by radiosondes. Journal of Geophysical Research 106(D8): 7857-7878. [ Links ]
Smithsonian Institution. 1896. Meteorological Tables. Based on Guyot´s meteorological and physical tables. Smithsonian Institution, Washington, USA. p. 166-177. [ Links ]
Tang, Y., 1997. Light. pp. 3-40. In: Prasad, M.N.V. (ed.). Plant ecophysiology. First edition. John Wiley and Sons, New York, USA. 552 p. [ Links ]
Trojer,H. 1956. La investigación agroclimatológica para el cultivo del café en Colombia. Cenicafé 7(75): 78-101. [ Links ]
Trojer, H. 1968. The phenological equator for coffee planting in Colombia. pp. 107-117. En: UNESCO (ed.). Agroclimatological Methods. Proceeding of the Reading Symposium. UNESCO, Paris, France. [ Links ]
Vince-Prue, D. 1976. Phytochrome and photoperiodism.pp. 347-370. In: Smith, H. (ed.). Light and plant development. First edition. Butterworths, London, England. [ Links ]
Wormer, T. and J. Gituanja. 1970. Seasonal patterns of growth and development of arabica coffee in Kenya. Kenya Coffee 35(1): 270-277. [ Links ]


