Services on Demand
Journal
Article
Indicators
-
 Cited by SciELO
 -
 Access statistics
Related links
-
 Cited by Google
 -
 Similars in
SciELO
 -
 Similars in Google
Share
Revista Facultad Nacional de Agronomía Medellín
Print version ISSN 0304-2847
Rev. Fac. Nac. Agron. Medellín vol.66 no.2 Medellín July/Dec. 2013
Effects of Locus Bean Gum, Kappa Carrageenan and Iota Carrageenan on the Syneresis, Texture and Some Sensory Characteristics of Cooked Ham
Efecto de la Goma de Algarrobo, la Carragenina Kappa y la Carragenina Iota Sobre la Sinéresis, Textura y Algunas Características Sensoriales de Jamón Cocido
César Augusto Sepúlveda Cossio1; Diego Alonso Restrepo Molina2 and Kenneth Roy Cabrera Torres3
1 Zootechnician. Universidad Nacional de Colombia - Sede Medellín - Facultad de Ciencias Agrarias - Departamento de Ingeniería Agrícola y Alimentos. A.A. 1779, Medellín, Colombia. <casepul0@unal.edu.co>
2 Associate Professor. Universidad Nacional de Colombia -Sede Medellín - Facultad de Ciencias Agrarias - Departamento de Ingeniería Agrícola y Alimentos. A.A. 1779, Medellín, Colombia. <darestre@unal.edu.co>
3 Associate Professor. Universidad Nacional de Colombia - Sede Medellín - Facultad de Ciencias- Escuela de Geociencias. A.A. 3840, Medellín, Colombia. <krcabrer@unal.edu.co>
Received: June 04, 2012; accepted: May 09, 2013.
Abstract. The current study evaluated the effect of the addition of locus bean gum (LBG), Kappa carrageenan (KC) and Iota carrageenan (IC) on some characteristics of cooked ham. For this purpose, a 2% mixture of LBG: KC: IC was added to the formula of a cooked ham standard brine, established according to the following ratios of 14 treatments (T): (T1): 100% IC; (T2): 100% KC; (T3): 50: 50 LBG: KC mixture; (T4): 50: 50 LBG: IC mixture; (T5): 33.33: 66.67 KC: IC mixture; (T6): 66.67: 33.33 KC: IC mixture; (T7): 25: 75 LBG: KC mixture; (T8): 25: 75 LBG: IC mixture; (T9): 50: 16.17: 33.33 LBG: KC: IC mixture; (T10): 50: 33.33: 16.17 LBG: KC: IC mixture; (T11): 25: 56.25: 18.75 LBG: KC: IC mixture; (T12): 25: 18.75: 56.25 LBG: KC: IC mixture; (T13): 12.5: 43.75: 43.75 LBG: KC: IC mixture and (T14): 37.5: 31.25: 31.25 LBG: KC: IC mixture. For all brines, the cooked ham was prepared and extended to 100%, and characteristics of hardness and elasticity were evaluated 14 and 28 days after manufacturing, through a texture analysis profile (TAP); along with syneresis in the packaging (purges) by gravimetric analysis and, hardness, elasticity and general appearance; and sensory attributes through a sensory analysis. The lowest syneresis was shown for T11 and the lowest predicted syneresis by a third grade polynomial was shown in the mixtures 18.12: 64.46: 17.42 and 16.36: 65.56: 18.08 of LBG: KC: IC for days 14 and 28, respectively, with a syneresis value of 0.88% and 2.83%; the highest instrumental hardness (TAP) was found in T7, and the highest predicted hardness at 14 days was found in mixture 24.72: 75.28 of LBG: KC, with a value of 22.74 N, while the highest predicted elasticity coinciding with a high hardness region was found in mixture 26.21: 67.82 : 8.98 of LBG: KC: IC, with a value of 0.93. In the sensory analysis, T7 and T11 (sampling points closer to these optimal) were those that received the best scores in the evaluated parameters.
Key words: Hardness, elasticity, sensory, brine.
Resumen. El presente estudio evaluó el efecto de la adición de goma de algarrobo (GA), carragenina Kappa (CK) y carragenina Iota (CI) sobre algunas características de un jamón de cerdo cocido. Para tal efecto se involucró, en la formulación de una salmuera base de jamón cocido, un 2% de mezcla de GA: CK: CI definidos según las proporciones siguientes, dando origen a 14 tratamientos (T): (T1): 100% CI; (T2): 100% CK; (T3): mezcla 50:50 GA: CK; (T4): mezcla 50: 50 GA: CI; (T5): mezcla 33,33: 66,67 CK: CI; (T6): mezcla 66,67: 33,33 CK: CI; (T7): mezcla 25: 75 GA: CK; (T8): mezcla 25: 75 GA: CI; (T9): mezcla 50: 16,17: 33,33 GA: CK: CI; (T10): mezcla 50: 33,33: 16,17 GA: CK: CI; (T11): mezcla 25: 56,25: 18,75 GA: CK: CI; (T12): mezcla 25: 18,75: 56,25 GA: CK: CI; (T13): mezcla 12,5: 43,75: 43,75 GA: CK: CI y, (T14): mezcla 37,5: 31,25: 31,25 GA: CK: CI. Con cada una de estas salmueras se elaboró jamón de cerdo cocido y extendido al 100%, al cual se le midieron las características dureza y elasticidad a los 14 y 28 días de elaboración, mediante un análisis de perfil de textura (TPA); sinéresis en el empaque (purgas) mediante análisis gravimétrico, y dureza, elasticidad y aspecto general, como atributos sensoriales mediante análisis sensorial. La menor sinéresis se presentó para T11 y la menor sinéresis predicha (mediante polinomio de colocación de tercer orden), se presentó en las mezclas 18,12: 64,46: 17,42 y 16,36: 65,56: 18,08 de GA: CK: CI para los 14 y 28 días, respectivamente, con un valor de sinéresis de 0,88% y 2,83%; la mayor dureza instrumental (TPA) se encontró en T7, y la mayor dureza predicha a los 14 días se encontró en la mezcla 24,72: 75,28 de GA: CK, con un valor de 22,74 N, mientras que la mayor elasticidad predicha que coincidiera con una región de alta dureza, se encontró en la mezcla 26,21: 67,82: 8,98 GA: CK: CI, con un valor de 0,93. En el análisis sensorial los T7 y T11 (puntos de muestreo más cercanos a estos óptimos) fueron los que obtuvieron las mejores calificaciones en los aspectos evaluados.
Palabras clave: Dureza, elasticidad, jamón, sensorial, salmuera.
Injected meats constitute a technology that gains demand from meat consumers every day, fulfilling their expectations of products with better flavor texture and juiciness, for better acceptance.
The quality of cooked hams is linked to diverse factors: raw material, brine composition, injection percentage, manufacturing technology, temperature, time and cooking programming (López, 2004). The meat industry has reduced the use of meat protein with the purpose of reducing costs, while trying to maintain the commercial quality characteristics. Therefore, agents have been developed to maintain texture, and retain and stabilize high amounts of water, allowing for the extension of products, with a low impact on the quality (Restrepo et al., 2010). Various studies have been developed to try to find out which hydrocoloids to use with each meat product (Amako and Xiong, 2001; Hsu and Chung, 2001; Pietrasik and Li-Chan, 2002; Jarmoluk and Pietrasik, 2003; Pietrasik and Jarmoluk, 2003; Verbeken et al., 2005; Ulu, 2006; Flores et al., 2007; Garcia and Totosaus, 2008; Montoya, 2010; Restrepo et al., 2010,). Finding the ratio where these agents should be mixed to get a high synergistic effect is of interest in the meat industry.
In spite of the efforts of technicians in manufacturing to retain the humidity of vacuumed packed cooked meat products, the issue with syneresis or water release remains; in addition, with an effect on the final presentation, it represents a bigger issue in terms of microbiology quality of the product, since the amount of water released boosts the proliferation of microorganisms. This syneresis is seen in cooked hams due to the inappropriate retention of water that is added to the process, associated with the inefficient extraction of meat protein when tumbling and the limited functionality of the water holder agents (Montoya, 2004; Restrepo et al., 2010).
This study aimed to determine the effect of the addition of locus bean gum, Kappa carrageenan and Iota carrageenan, at 1% in the tumbling brine, on some characteristics of the 100% extension cooked ham.
MATERIALS AND METHODS
The study was carried out in the Meat Products and Food Quality Control Laboratories of the Universidad Nacional de Colombia and the INTAL foundation, both located in the city of Medellin at 1,550 masl, with an average temperature of 23 ºC.
Raw meat material. The meat source was pork legs, 24 hours post mortem, at 4 °C with pH values between 5.6 and 6.0, which were trimmed of fat ("charqueadas") and ground with a grinder (CI TALSA's brand M32, 3HP, single-phase) through a 12 mm disc.
Standard brine. A basic formula for 100% extension cooked ham was used. The formula of the brine was as follows: water (77.24%), soy protein (7%) (SOLAE® PP500E), tapioca starch (6.42%) (Tecnas® S.A.), salt (3.6%) (Refisal®), sugar (2%) (Manuelita®), hydrocolloids mixture (2%), poliphosphate mixture (1%), nitrites (0.66%) and erythorbic acid (0.1%) (Tecnas S.A.®).
Preparation of the brine. For each sampling point, 1,500 g of brine, divided into 2 portions, were used; in the first portion, a third of water was used with all the constituents that contribute ionic strenght (salt, phosphates, sugar, nitrites, erythorbic acid); and, in the second one, the remaining water was mixed with the ingredients that hold water (soy protein, starch and hydrocolloids), with the purpose of making a higher protein extraction easier, avoiding interference that could cause hydrocolloids. All the dry ingredients were weighed this way and manually mixed in a plastic container, then the previously refrigerated water was weighed, and the dry ingredients disolved through an Oster® brand blender, 1.25 L capacity, 600 watt engine and 400 - 1,300 rpm, at room conditions and mixing times of a minimum of 20 s.
Ham preparation. The meat tumbling with brine was carried out under refrigerated conditions (refrigerator, Tecnifrio brand, 2 HP, temperature between 0 and 4 °C) in a kitchen mixer( Kitchenaid® 2,700-4.5 pounds capacity) with a hook for mixing and using speed 4 (120 rpm); 1,500 g of previously chopped meat were passed through the grinder; the first portion of the brine was added and tumbled for 15 min; then the remaining brine was added and tumbled for another 15 minutes. Afterwards, the product was stored under refrigeration for 24 h (0 to 4 °C) in a 20 cft LaSelle refrigerator. Then, the product was stuffed in an ALIFAN casing, zero lessening, 190 interior diameter, using a stuff machine (RAMON brand EH-25 L capacity), before cooking by immersion in a tank (TALSA® brand T240G-240 L capacity), where it reached an internal temperature of 72 °C. Afterwards, it was cooled in cold water and taken to a refrigeration chamber at 4 ºC for 24 h (20cft LaSelle chamber), then it was sliced with a slicer (TORREY brand model RS275) into 2 to 3 mm slices. It was vacuumed packed in a packing machine (KOMET brand PLUS VAC 20) into half pound units (for sensory evaluation and syneresis) and 4, 7 cm long blocks (for TAP evaluation) in multiwall packages( Alico® PE/PA) coextruded with barriers to aromas and gases and medium barrier to water vapor, and finally, the product was stored in a chamber at 4 ºC (20cft LaSelle).
Statistical design. Mixture designs were used and measured for individual effects, for pair and triple interactions, with three components: Locus Bean Gum (LBG), Kappa carrageenaan (KC) and Iota carrageenan (IC), which allowed for the use of mixture designs with cubic arrangement, expressed through the following equation:

The assumptions of normality (e ~ Normal (0, s2)) were checked, constant variance (s2 = constant) and independence of the errors (r = 0).
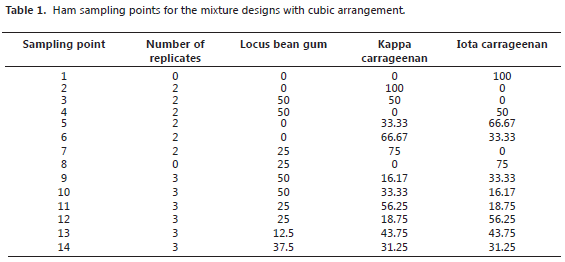
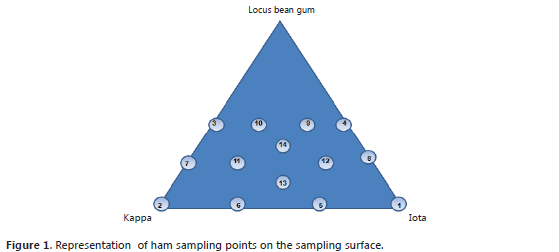
Sampling points. The hams for the current study had the same formula in terms of meat content, salts and other ingredients (1% of the total formula, meat: brine corresponds to the mixture of hydrocolloids). In the mixture of hydrocolloids, the KC and IC were in the range of 0 and 100%, while the LBG was between 0 and 50%. In the cubic arrangement, it was necessary to explore 14 points in the sampling surface, for which 2 replicates were performed in the sampling peripherical points and 3 replicates in the central points, which where chosen only after pre-tests. It was decided not to explore points 1 and 8 because during the pre-experimental phase and literature review, it wasn't expected to find the optimal point in this area. The mixtures under evaluation are shown in Table 1 and Figure 1.
Syneresis tests. Syineresis was determined by the difference of weight with an analytical scale, Mettler Toledo XP10002S with 0.01 g resolution, as follows: inicial weight of the ham slices before vacuum packed (g) = P1; the day of the analysis, the packaging was opened and the slices were dried with a disposable absorvent towel, Wypall®, then the dried ham slices were weighed (g)=P2. Syneresis was expressed as: Syneresis = (P1-P2) x 100/P1.
Texture tests. A TAP test with a texturometer, TA-XT2i Stable Micro System®, Godalming, UK, was carried out; cylinderical-shaped hams were obtained from the vacuum packed blocks using a puncher, 15 mm diameter x 25 mm length, every ham cylinder was measured using a vernier to enter the height and diameter into the software for the required adjustment and they were compressed by half the height of the cylinder, at a test speed of 1 mm s-1 piston distance, with a loading cell of 25 kg.
Sensory analysis. The sensory analysis was carried out through a ranking test using 5 trained judges of the INTAL Foundation; hardness, elasticity and general acceptance were evaluated. For the evaluation of each parameter, one sample piece of every sampling point was given to the judges, who arranged them from the best to the worst performance for every evaluated parameter. Water between 5-7 °C was provided during the evaluation as a way of neutralization. The evaluations were carried out on a square table with artificial zenithal lighting.
RESULTS AND DISCUSSION
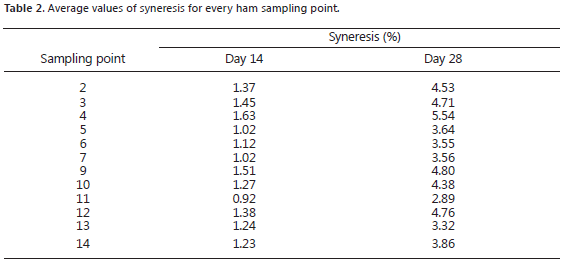
In Table 2, the average results of syneresis for days 14 and 28 of the hams are shown for every sampling point; these data were entered in the software Design-Expert version 6 to obtain the response surface and the ANOVAS for this variable. According to the results, one can see the way time increases the syneresis percentage; this same behavior was stated by Montoya et al. (2010) and Restrepo et al. (2010).
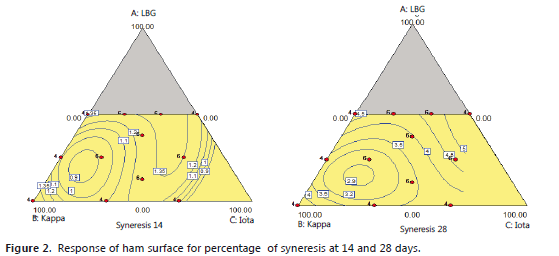
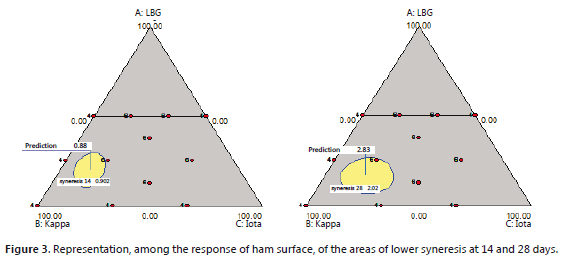
In Figure 2, the response surface obtained from the sampling points under evaluation is shown. The curves of level show the concentrations with the same syneresis percentages. The point corresponding to 100% KC shows a syneresis higher than 1.4% and 3.8% for the days 14 and 28, respectively. In many companies dedicated to ham production, Kappa carrageenan is the only hydrocolloid used due to its high gel strength, so this point can be taken as a pattern or reference value (Tovar, 2003 and Lopez, 2004). The line that indicates 50% LBG showed high syneresis and in the region close to the 50:50 LBG: IC combination, the highest syneresis was shown (syneresis higher than 1.4% and 5.0% at 14 and 28 days) due to the viscosity of the brine that made the tumbling difficult, interfering with the sufficient extraction of meat protein necessary to hold water. The lowest syneresis was shown in the region close to the sampling point T11, with an expected syneresis lower than 0.9% and 2.9% for the days 14 and 28, respectively. These values of syneresis are consistent with the study reported by Restrepo et al., (2010), who evaluated 50% extension hams with the addition of 0, 1 and 1.2%, of the total weight mixture, of Kappa carrageenan and tara gum proportion of 71-29%, showing syneresis at 28 days between 1.5 and 3%, being the treatment with lower syneresis that one with this mixture at 1.2%. In another study carried out by Montoya et al. (2010), the syneresis in ham with 0.5% Kappa carrageenan and 0.3% and 0.5% sodium alginate was evaluated. The highest syneresis was obtained with Kappa carrageenan (average syneresis= 2.6%) and the lowest syneresis with alginate at 0.5% (average syneresis = 1.4%).
For syneresis at 14 and 28 days, the test was significant (P≤0.05), indicating the data can better fit a response surface with a more complex model. In spite of this, the adjusted R2 were 0.84 and 0.93, showing standard deviations of 0.081 and 0.2, with the response surface used in the cubic model.
Additionally, the polynomial coefficients were obtained and the prediction equation for the syneresis at 14 and 28 days (equations 1 and 2) was expressed. The mixture 18.12: 64.46: 17.42 of LBG: KC: IC showed lower syneresis at 14 days (0.88%), and the mixture 16.36: 65.56: 18.08 of LBG: KC: IC showed the lowest expected syneresis at 28 days (2.83%). Fernandez et al. (1991) worked with Kappa and locus bean gum gels, finding the maximum synergistic effect when the ratio of Kappa and locus bean gum was 4:1 and for Iota carrageenan, Fennema (2000) and Calvo (2008), stated to produce medium strength, elastic and low syneresis gels, for what it seems this mixture potentiate the synergistic effects of these 3 hydrocolloids.


In Figure 3, the area of lower syneresis according to the equations 1 and 2 is shown.
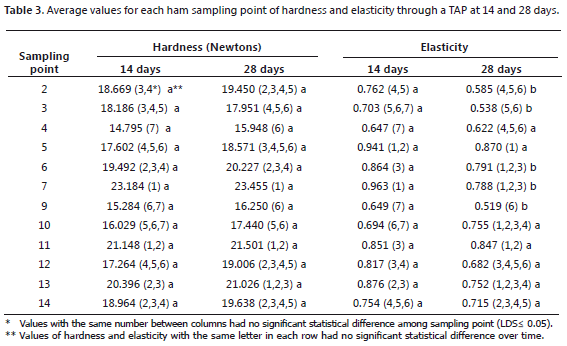
Texture analysis profile. Hardness and elasticity were evaluated through a TAP test. In Table 3, the average data of these properties at 14 and 28 days are shown.
Treatment T7 showed the most notable values for hardness at 14 and 28 days and, for elasticity, at day 14 but not day 28, a behavior that can be mainly attributed to the effect of the combination of hydrocolloids because, as stated by various authors, hardness and elasticity in a ham are associated with the myofibrilar protein content and an appropriate manufacturing process, thus, a hard and elastic ham is characteristic of products with a high meat content and a suitable manufacturing process (Válková et al., 2007; Verbeken et al., 2005); but this is not the case according to the conditions of the evaluation in which both conditions, protein content and manufacturing process, are kept invariable.
The values obtained are consistent with those reported by Válková et al. (2007), who determined hardness through a TPA test in cooked hams, finding a median of 16.82 N, with a maximum of 25.86 N and a minimum of 9.6 N, in 13 samples of commercial hams. While, Hsu and Chung (2001) evaluated the elasticity in meat balls with Kappa carrageenan, finding values between 0.92 and 1.03.
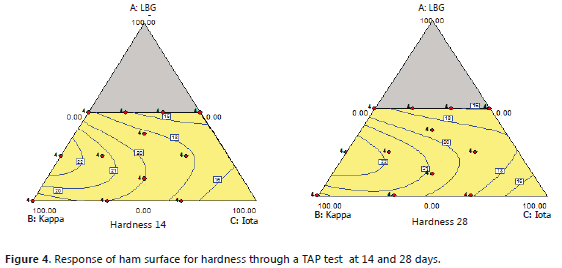
With the experimental data, the response surface was obtained to observe the behavior of the hardness in the sampling space and to identify the behavior of the hardness over time, which are shown in Figure 4.
The test of lack of adjustment for hardness through a TAP test for the days 14 and 28 suggested the special cubic model for both times. It was possible to obseve in the ANOVA for the special cubic model that the lack of adjustment was not significant (P=0.6089 and P=0.8464), which demonstrates that the response surface satisfactorily fits the data from the sampling points with this model. With the special cubic model, the standard deviation was 1.612 N and 1.919 N for the days 14 and 28. In both response surfaces, it can be noticed that the least hardness of the ham was in the line that represents the mixtures with 50% LBG and the region close to 100% IC, while the region containing more KC showed the highest values of hardness. The hardness of the samples increased with time, finding that at 28 days, the curves of level move, resulting in higher values for each sampling point; a behavior consistent with the findings of Restrepo et al. (2010) and Montoya et al. (2010), proving the assertion of Lopez (2004), about the behavior of KC in the presence of proteins, creating strong and complex structures due to chemical attractions.
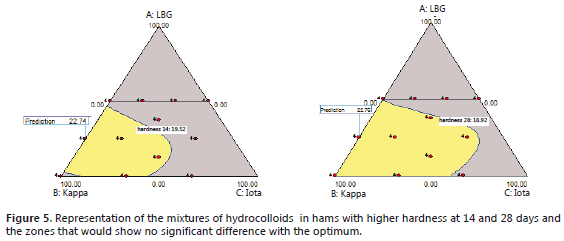
Polynomial coeficients were also found and the prediction equation for hardness at 14 and 28 days (equations 3 and 4) was expressed. With these, the mixture that would show the highest value of this characteristic was predicted, which was 24.72: 75.28 of LBG: KC and 23.39: 76.61 of LBG: KC, for days 14 and 28, respectively (Figure 5); with values very close to those found by Fernandez et al. (1991), who worked with gels of KC and LBG, and found the maximum effect when the ratio of KC: LBG was 4:1, while Arda et al. (2009), evaluating the transition temperatures into gel from mixtures of KC and LBG, found the maximum synergistic effects in the ratio of 8:1.
To define the zone of similar behavior, 2 standard deviations were substracted from the value of maximum hardness resulting in a limit of 19.52 N and 18.92 N, so any mixture in this area will have no statistical difference from the optimum.
This zone is shown in Figure 5. As shown in the wider region, where many mixtures of hydrocolloids could comply, the reason for having such a wide region is due to the high variability that shows the data of instrumental texture (VC= 8.75% and 10.02% for hardness at 14 and 28 days).
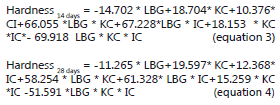
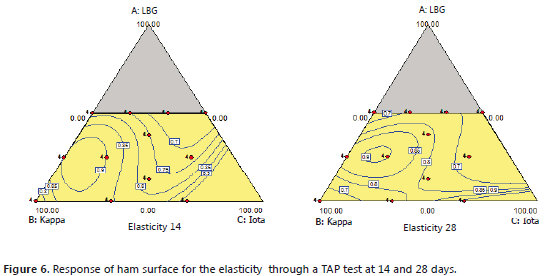
With the data of elasticity, the response surface was obtained with the objective of evaluating the behavior, in the sampling space, over time, that shows the elasticity of the hams of study (Figure 6).
The lack of adjustment test for elasticity at 14 and 28 days suggested the cubic model for both times (P=0.1546 and P=0.1418). In both response surfaces, it is noticeable that the least elasticity was found in the line that represents the mixtures containing 50% LBG and the point 100% KC, while the region with more IC content and a region close to the mixture 80: 20 of KC: LBG shows the highest elasticity. Over time, the elasticity of the samples decresased, notably, at 28 days, the curves of level move, resulting in a small area with elasticity higher than 0.9.
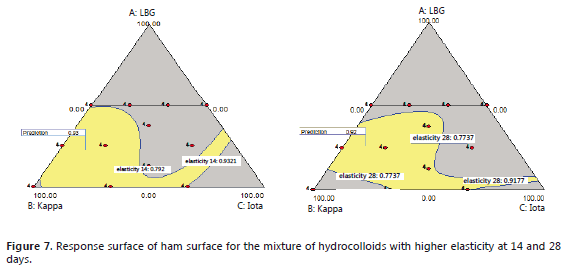
The coeficient of the polynomial components was obtained and the equation of prediction for elasticity at 14 and 28 days was developed (equations 5 and 6). With these equations, the mixture with the highest elasticity in the response surface was predicted, defining the sample 23.21: 67.82: 8.98 of LBG: KC: IC, along with the one with the highest values of elasticity at 14 days and 6.51: 60.58; 12.91 of LBG: KC: IC, and the one with the highest elasticity at 28 days (Figure 7), finding a synergistic effect similar to that stated by Fernández et al. (1991).
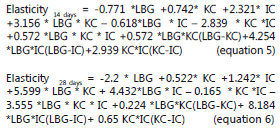
Substracting 2 standard deviations from the optimum value of elasticity, the area that would not represent significant statistical difference with the optimum was obtained. This zone can also be noticed in Figure 7. As shown, it is a very wide area due to the high variability of the data (VC= 8.96 and 9.76 for the elasticity at 14 and 28 days).
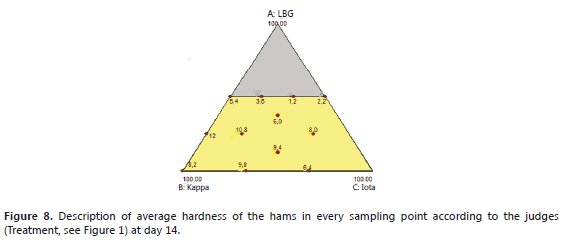
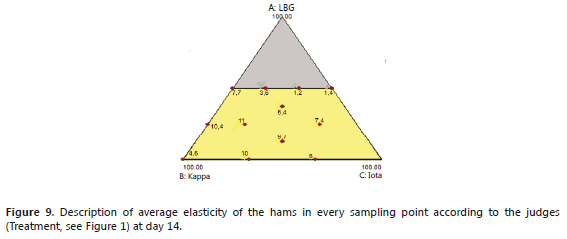
Sensory analysis. The sensory analysis was based on the 12 treatments through a ranking test, where 3 attributes were evaluated: hardness, elasticity and general appearance. In this analysis, each judge gave grade 12 to the best ham, the next one 11 and so on, until finding the lowest performance with grade 1.
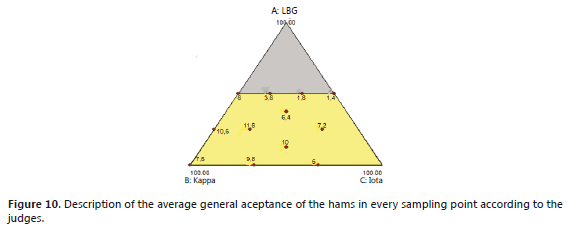
In Figures 8, 9 and 10, the average scores according to the judges in the grading for each characteristic can be seen.
T11 and T7, corresponding to the mixtures 25: 56.25: 1875 and 25: 75: 0 of LBG: KC: IC, received the best scores for hardness, elasticity and general acceptance, having the points closest to the optimal obtained for hardness and elasticity by instrumental methods. The sampling points with the lowest performances were 4, 9 and 10, which belong to the line that represents 50% LBG; the low hardness and elasticity of these hams are likely due to the lack of gelling capability of locus bean gum or because the brines were too viscuous to allow the proper protein extraction during tumbling (Fennema, 2000).
CONCLUSIONS
In general, the treatments T7 (25:75 LBG: KC) and T11 (25: 56.25: 18.75 LBG: KC: IC) were those that showed the best performance, regarding the characteristics of hardness, elasticity, syneresis and sensory characteristics, in 100% extension cooked hams evaluated at 14 and 28 days post-manufacturing.
The prediction of lower syneresis in the mixture 1587: 65.66: 18.48 of LBG: KC: IC means that the 100% extension cooked hams, in which these mixtures of hydrocolloids at 1% of the total product were added to the tumbling brine, will show less "purges" -syneresis- in the packaging during their shelf life than those munufactured with these same hydrocolloids in other ratios and included in the brine at the same levels.
The prediction of the highest hardness in 100% extension cooked hams was found with tumbling brine 1% of hydrocolloids with the mixtures 24.72: 75.28: 0 and 23.39: 76.61: 0 of LBG: KC: IC, while the lowest instrumental hardness was shown in the region close to 50% LBG and 50% IC, which coincided with the evaluation of the judges who described treatments 4 and 9 with the lowest grades located in this region.
The higher values of instrumental elasticity were shown in mixtures 23.21: 67.82: 8.98 and 26.51: 60.58: 12.91 of LBG: KC. IC for the days 14 and 28. In the sensory analysis, T7 (25:75 of LBG: KC) and T11 (25: 56.25: 18.75 of LBG: KC: IC) obtained the best scores for this characteristic.
According to the lack of adjustment test, the special cubic model and the cubic model fit the variables hardness and instrumental elasticity, respectively; the lack of adjustment test was significant for syneresis, which means that a more complex model could adjust the data to the response surface even more.
BIBLIOGRAPHY
Arda, E., S. Kara and O. Pekcan. 2009. Synergistic effect of the locust bean gum on the thermal phase transitions of k-carrageenan gels. Food Hydrocolloids 23(2): 451-459. [ Links ]
Calvo, M. 2008. Bioquímica de los alimentos. En: http://milksci.unizar.es/bioquimica/temas/azucares/xantana.html; consulta: mayo 2010. [ Links ]
Amako, D. and Y. Xiong. 2001. Effects of carrageenan on thermal stability of proteins from chicken thing and breast muscles. Food Research International 34(2-3): 247-253. [ Links ]
Fennema O. 2000. Química de los alimentos. Segunda edición. Editorial Acribia, Zaragoza España. 1258 p. [ Links ]
Fernandes, P.B., M.P. Gonçalves and J.L. Doublier. 1991. A rheological characterization of kappa carrageenan/galactomannan mixed gels: a comparison of locust bean gum samples. Carbohydrate Polymers 16(3): 253-274. [ Links ]
Flores, M., E. Giner, S. Fiszman, A. Salvador and J. Flores. 2007. Effect of a new emulsifier containing sodium stearoyl-2-lactylate and carrageenan on the functionality of meat emulsion systems. Meat Science 76(1): 9-18. [ Links ]
Garcia, E. and A. Totosaus. 2008. Low-fat sodium-reduced sausages: Effect of the interaction between locust bean gum, potato starch and K-carrageenan by a mixture design approach. Meat Science 78(4): 406-413. [ Links ]
Hsu, S.Y. and H.Y. Chung. 2001. Efects of k-carrageenan, salt, phosphates and fat on qualities of low fat emulsified meatballs. Journal of Food Engineering 47(2): 115-121. [ Links ]
Jarmoluk, A. and Z. Pietrasik. 2003. Response surface methodology study on the effects of blood plasma, microbial transglutaminase and k-carrageenan on pork batter gel properties. Journal of Food Engineering 60: 327-334. [ Links ]
López, J. 2004. Curso virtual de industria cárnica de la Universidad Nacional de Colombia, Sede Bogotá ICTA. En: http://virtual.unal.edu.co/cursos/agronomia/2001819/lecciones/cap05/cap05_01.; consulta: mayo 2010. [ Links ]
Montoya, L. 2004. Efecto de la adición de alginato de sodio sobre las purgas en jamón cocido, tajado, empacado al vacío. Informe Final de Especialista en Ciencia y Tecnología de Alimentos. Facultad de Ciencias Agropecuarias. Universidad Nacional de Colombia, Medellín. 69 p. [ Links ]
Montoya, L., D. Restrepo and H. Suarez. 2010. Influencia del alginato de sodio sobre la sinéresis del jamón cocido. Revista Facultad Nacional de Agronomía Medellín 63(1): 5409-5415. [ Links ]
Pietrasik, Z. and A. Jarmoluk. 2003. Effect of sodium caseinate and k-carrageenan on binding and textural properties of pork muscle gels enhanced by microbial transglutaminase addition. Food Research International 36(3): 285-294. [ Links ]
Pietrasik, Z. and E. Li-Chan. 2002. Binding and textural properties of beef gels as affected by protein, k-carrageenan and microbial transglutaminase addition. Food Research International 35(1): 91-98. [ Links ]
Restrepo, D., F. Molina and K. Cabrera. 2010. Efecto de la adición de carragenina Kappa I.II y goma tara sobre las características del jamón de cerdo picado y cocido. Revista Facultad Nacional de Agronomía Medellin 63(2): 5717-5727. [ Links ]
Tovar A. 2003. Guía de procesos para la elaboración de productos cárnicos. Serie Ciencia y Tecnología, No. 121. Editorial Convenio Andrés Bello, Bogotá. 32 p. [ Links ]
Válková V., A. Saláková, H. Buchtová and B. Tremlová. 2007. Chemical, instrumental and sensory characteristics of cooked pork ham. Meat Science 77(2): 608-615. [ Links ]
Ulu, H. 2006. Effects of carrageenam and guar gum on the cooking and textual properties of low fat meatballs. Food Chemistry 95(4): 600-605. [ Links ]
Verbeken, D., N. Neirinck, P. Van Der Meeren and K. Dewettinck. 2005. Influence of k-carrageenan on the thermal gelation of salt-soluble meat proteins. Meat Science 70(1): 161-166. [ Links ]


