


 English (pdf)
 Article in xml format
 Article references
 Send this article by e-mail
 Cited by SciELO
  Cited by Google
  Similars in
SciELO
Similars in
SciELO  Similars in Google
 Permalink
Urban organic solid wastes are generated by the communities that inhabit the so-called urban centers. This urban organic waste, also called waste biomass, is comprised of considerable amounts of peels, fruits, and vegetables in an advanced decomposition process (UPME, 2009). Organic waste consists mainly of carbohydrates, starch, protein, small amounts of cellulose and hemicellulose (Park et al., 2010). It represents a source of bioenergy with the potential to reduce the current environmental and energy problems, contributing to the reduction of greenhouse gases, and the acquisition of CO2 emission rights (Robledo-Narváez et al., 2013). The transformation of organic waste by anaerobic fermentation allows better use of it, generating a renewable gas that helps to reduce the consumption of fossil fuels, and the emission of greenhouse gases; especially, if during the process, the metabolic path is oriented to the production of hydrogen instead of methane.
Hydrogen has a calorific value of 122 kJ g-1, which is 2.75 times higher than fossil fuels. This feature has made it a promising alternative fuel; especially, considering that its combustion does not generate polluting emissions. It can also be used for the generation of electric power using it directly in internal combustion engines, in thermal turbine systems or in fuel cells (Kim et al., 2009). In recent years, the production of hydrogen by fermentation, has aroused considerable interest because of the diversity and relatively low cost of the substrate (Lin J et al., 2011) since the yields that can be obtained (3.0 moles of H2 mol glucose-1) and the content of hydrogen in the gas, up to 63% (Papadias et al., 2009).
Despite the comparative advantages of organic waste in the production of hydrogen by fermentation, its use has rarely been reported. Hernández et al. (2014) used coffee mucilage in co-digestion with pig manure to generate hydrogen, obtaining a maximum production rate of 7.6 NL H2 Lof mucilage.day -1, and hydrogen content in the gas up to 39%. Mohan et al. (2009) showed the viability of hydrogen production from plant residues, indicating that its generation depends on the concentration of the substrate and its composition. Gómez et al. (2009) studied the behavior of organic waste with an inoculum obtained from a municipal wastewater treatment plant, indicating that a low organic loading speed favors the fermentation performance. The authors report that the maximum production of hydrogen was 67 L H2 kgTVSadded -1, and although the yield was unstable, its recovery could be achieved by stirring the mixture, suspending the feed, and controlling the pH in the range of 5-5.5.
Gómez-Romero et al. (2014) studied the co-digestion process of raw cheese whey with fruit vegetable residues for the production of biohydrogen, using five C/N ratios (7, 17, 21, 31, and 46) at a pH of 5.5 and 37 °C. The highest yield was 449.84 mL H2 gCOD -1 for a C/N ratio of 21. The reported pH range for maximum hydrogen production is between 5.0 and 6.0. Wang and Wan (2008) report an optimum pH around 5.5 when anaerobic sludge, sucrose or glucose is used as a substrate in batch and continuous cultures. However, given the complex composition of organic waste, it is necessary to study the effect of pH on the hydrogen production when said substrates are used. The pH of the medium affects the yields of the hydrogen production, the type of organic acids produced, and therefore the specific speed of hydrogen production (Wang and Wan, 2008).
Although the pH impacts the hydrogen production by fermentation, its generation depends on multiple variables such as the type of substrate, temperature, organic loading speed, inoculum, type of reactor, among others. Authors such as Lin CY et al. (2011) and Wang and Wan (2008) carried out studies on the optimization of fermentation processes, finding that the experimental method based on response surface methodology (RSM) allowed them to represent the interaction between variables, to minimize the error in determining the effect of the parameters, and to determine the optimal conditions of operation. Therefore, it is considered an appropriate technique to optimize the fermentative hydrogen production (Muñoz-Páez et al., 2012).
The evolution of hydrogen by fermentation has also been studied through kinetic models such as Monod and Gompertz, the latter being the most used to describe the progress of microbial growth, substrate degradation, soluble metabolites production, and hydrogen production in batch fermentation (Chang et al., 2011). This equation has been used with great fit (R2>0.90) by different authors such as Luo et al. (2011), who wanted to correlate experimental results with a mathematical model. The Gompertz model is an empirical expression of three parameters that are experimentally adjusted: lag phase time (λ), potential H2 production (Hmax), and hydrogen production rate (Rmax). Despite the fact that with it, high correlation coefficients between the observed and adjusted data from the hydrogen production are obtained (Wang and Wan, 2008), the three parameters of the model are limited to the specific experimental conditions, that is to say, the experimental conditions of each research.
The present study used an experimental design, based on the response surface methodology (RSM), to carry out a planned number of experiments and analyze the responses statistically, identifying the individual and interactive effects of the pH of acidification, the operation pH, the acidification time, and the rate of stirring, in relation to the production of hydrogen using urban organic waste as a substrate. The aim of this work was to analyze the incidence of some physical and chemical parameters in the hydrogen production when urban organic waste is used as a substrate, in which is believed that the pH of acidification and the acidification time have more incidence in the hydrogen production than the operation pH and stirring speed.
MATERIALS AND METHODS
A set of tests were structured based on an experimental design of central composition with four factors and two levels in each factor. The levels of the factors were taken from results achieved in preliminary tests (data not shown). The substrate used corresponded to a mixture of organic waste of fruits and vegetables not suitable for consumption due to mechanical damage and phytosanitary problems, coming from the Central Mayorista de Antioquia (CMA). These were reduced in size and feed to a reactor in a 1:1 ratio between water and substrate. The same waste composition was used in each test. The physicochemical analysis that was performed on the substrate included the determination of the Biochemical Oxygen Demand (BOD), Chemical Oxygen Demand (COD), Total Soluble Solids (TSS), Total Volatile Solids (TVS), and Volatile Fatty Acids (VFA). For this procedure, two samples of 500 mL were taken at the beginning and the end of each fermentation. The concentrations of BOD (5210-B), COD (5220-B), VFA, TSS (2540-B) and TVS (2540-E), were carried out according to the analytical methods of the Standard Methods for the Examination of Water and Wastewater of the APHA-AWWA-WEF, 19th edition of 1995.
The independent variables or factors were the acidification time (ta), operation pH (pHo), pH of acidification (pHa) and stirring (w). The response variables were hydrogen production (HP, L H2 d-1), cumulative hydrogen production (CHP, L H2) and maximum content of hydrogen in the gas (MCH, %H2). To determine the response variables a gas meter (Metrex G2.5 with precision of 0.040 m³ h-1 and a maximum pressure of 40 kPa) with a silica gel humidity trap was coupled. Of the gas produced per day, a sample was taken in Tedlar bags with a capacity of 1 L, using 85% of its volume to be evaluated by means of gas chromatography. For this, a gas chromatograph (GC, Varian 3800) equipped with a thermal conductivity detector (TCD) was used, with columns connected in series Hs N6-07N (Hayesep), and Ms 13x4-09N (Molesieve) with a BackFlush-Bypass system, oven temperatures and detector of 40 and 170 °C respectively.
Regarding the independent variables, the pH was monitored daily with a portable pH-meter HI 98103 Hanna Instruments, equipped with a standard LB electrode with a range of 0-14 pH, resolution of 0.01 pH and accuracy of ±0.2 pH. For stirring, was used a helical ribbon impeller, coupled to a gear-motor, a speed variator and a timer. Three stirring rates were defined according to preliminary tests; all of them were applied during five minutes with a frequency of every hour. The acidification time (ta) consisted in the number of days elapsed from the beginning of the fermentation until the addition of a base (agricultural lime) was started.
The results in each response variables were fitted to multivariable second-order polynomial models, where the "backward" method was used to select the significant parameters in each model. The verification of the fit of the models was made using variance analysis with a significance level of 5%. Besides, an optimization was carried out in order to maximize the response variables, to obtain the combination of these responses and establish under these conditions the values of the factors. The fit and optimization of the models was done through the Design Expert V9® software. The optimization process followed the method of statistical desirability, in addition a canonical correlation analysis of the response surfaces in the variables was carried out, and the stationary point was located in the experimental region with the SAS software, version 9.0® .
Besides to the model obtained by non-linear regression, the modified Gompertz model was used to describe the Cumulative Hydrogen Production (equation 1).
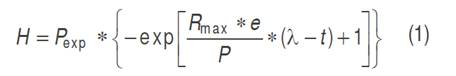
Where: H is the cumulative production of hydrogen (mL), λ the lag phase time (h), P is the potential production of hydrogen (mL), R max is the maximum rate of hydrogen production (mL h-1) in the time interval, t corresponds to the hours per day of biohydrogen production and e is 2.718281828 (Valdez-Vazquez and Poggi-Varaldo, 2009). The cumulative production of hydrogen (H) was obtained by adding the liters registered in each test every day, from the first day until the presence of hydrogen in the gas ceased. The lag phase time corresponded to the days elapsed from the moment the lime was added to the bioreactor until the production of hydrogen began. The potential production of hydrogen (P) was the cumulative total of the production in each test, while the maximum production rate was given by the ratio between the maximum value of hydrogen production and the hours that were required for it in each test. The fit of the experimental data to the Gompertz model (R² and R²adj) was done with the Curve Fitting Tool (CFTools) from Matlab, version 2012®.
All experimental tests were carried out in a stainless-steel bioreactor, hermetically sealed, with a volume capacity of 20 L and operated at 30 °C in batch mode. The tests were performed in the Agricultural Mechanization Laboratory of the Faculty of Agricultural Sciences of the Universidad Nacional de Colombia, Medellín campus.
RESULTS AND DISCUSSION
Characterization of the substrate
The substrate was comprised of a mixture of green leaves waste (cabbage and lettuce) and fruits (papaya, mango, guava, and orange). The results of the initial and final physicochemical characterization of the substrate are shown in Table 1. Tests E1, E2 and E5 showed inconsistent results, attributed maybe to the lack of uniformity in the size of the waste at the time of the analysis (data not shown).
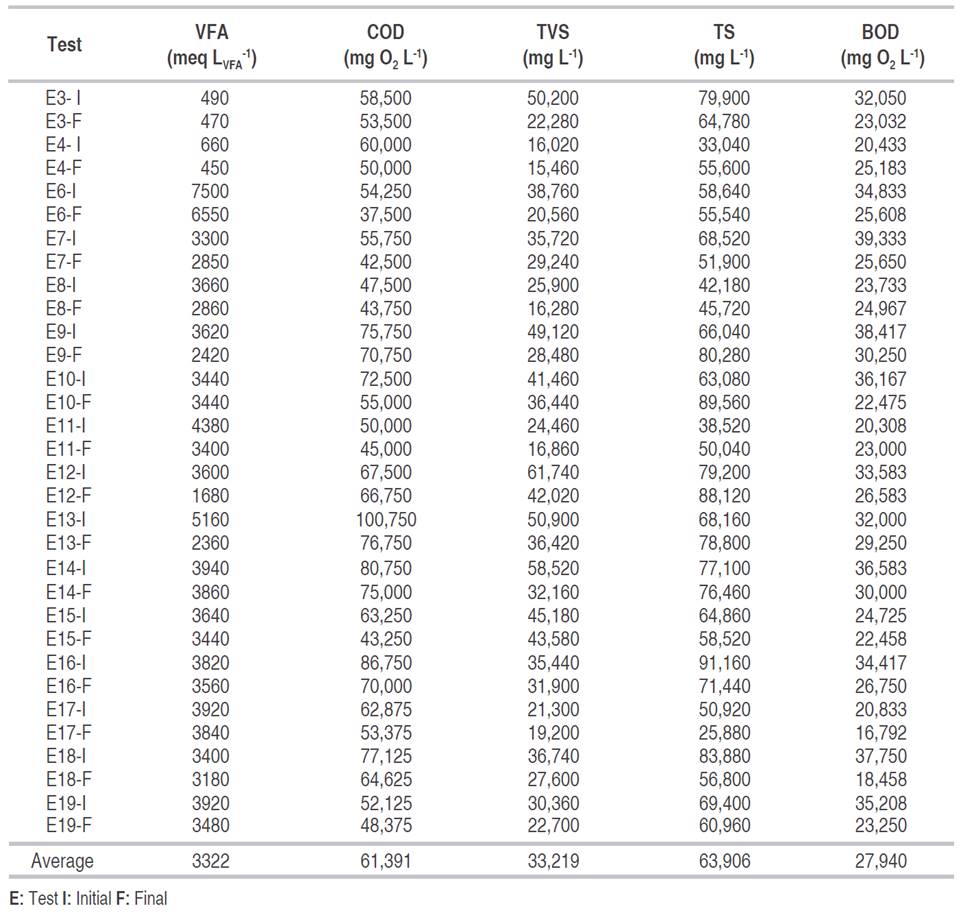
The percentages of organic matter removal varied between 1 and 36%; the highest COD value 100,750 mg O2 L-1 was observed in test E13, in which a 24% of organic matter was removed, and a 15.2% of hydrogen in the gas was obtained. An increase in the percentage of removal, up to 18%, was observed at high concentrations of organic matter. This increase may happen because with the increment in the organic load there is a greater amount of carbohydrates and hemicellulose available to be used as a substrate by the bacterial population (Mohan et al., 2009). However, the maximum production did not occur with the highest COD value. This discrepancy can be explained since high initial values of COD can generate an accumulation of metabolites and instability in the pH (Redondas et al., 2012).
It has been reported that the adequate concentration of Total Solids (TS) to obtain hydrogen from organic waste varies between 1.3 and 50 g L-1 (Sekoai and Gueguim Kana, 2013). In the present work, the concentration of TS ranged from 25.8 to 91.2 g L-1. For this last value, the content of H2 in the gas decreased, while the CO2 increased to more than 70%, similar results to those presented by Rangel (2011). Likewise, the hydrogen content in the gas was low or zero for tests E7, E15, and E18, in which there was a concentration of total solids of 68.5, 64.8, and 83.8 g L-1 respectively. This situation coincided with the report of others authors, Liu et al. (2009) studied the production of hydrogen from organic solid waste at different TS concentrations.
Volatile Fatty Acids (VFAs) showed a wide range of variation, from 350 to 7500 meq LVFA -1, this last value was the initial value for test six in which a maximum hydrogen percentage of 6.41 was obtained. High values of VFA, higher than 3000 mg L-1 (3000 meq LVFA -1), generate a VFA accumulation that favors the depletion of the buffer capacity of the substrate, affecting directly the pH, which plays a crucial role in the hydrogen production and in the growth of the acidogenic microbial population (Elbeshbishy et al., 2011).
Hydrogen production and performance indicators
The hydrogen production (HP) ranged between 0 and 14.4 L d-1, the maximum hydrogen content in the gas (MCH) was between 0 and 42.4%, and the cumulative production of hydrogen (CPH) was between 0 and 20.4 L (Table 2). In some tests, there was not hydrogen production, as was the case of tests 1, 15, 18 and 19. The highest values of hydrogen production were observed in tests 2, 4 and 8 with 14.4, 9.8 and 6.4 L H2 d-1 and a hydrogen content in the gas of 36.9, 42.4 and 24.5%, respectively. The mentioned tests had acidification times of 2.2 and 1 day. The hydrogen production per day was higher compared to those obtained by other authors such as Ueno et al. (2007) and Kim et al. (2008), who in tests with organic and restaurant waste found productions of 5.4, and 1.47 L H2 d-1. Concerning hydrogen content, the values obtained were lower than those reported by these same authors (55%), with a maximum value of 42.4%.
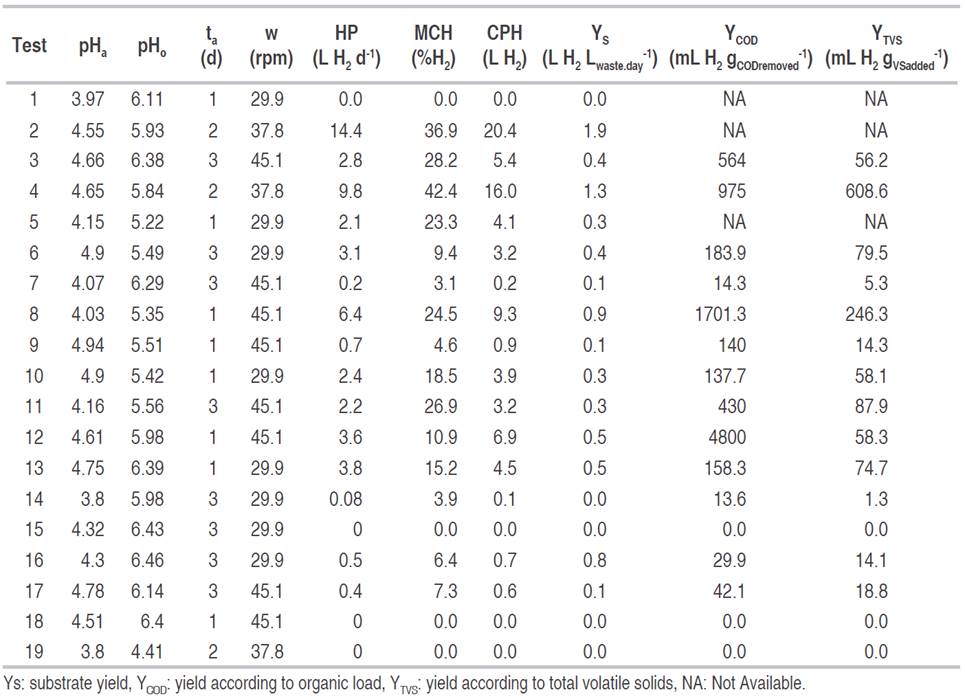
The maximum daily and cumulative production were obtained for pHa, pHo, and stirring of 4.55, 5.93, and 37.8 rpm, respectively. In turn, the highest hydrogen content in the gas was reached for pHa, pHo, and stirring of 4.65, 5.84, and 37.8 rpm, respectively. These results coincide with those given by other authors such as Fernández et al. (2010), who using food waste under these conditions and with mesophilic temperature obtained high hydrogen production. Other authors (Valdez-Vazquez and Poggi-Varaldo, 2009) achieved up to 58% of hydrogen in the gas for a mesophilic regime, using an inoculum from wastewater.
The maximum yield of the substrate was of 1.9 L H2 Lwaste.day -1 in test two. This result was obtained without using any inoculum. Shin et al. (2004) found yields of 0.33 L H2 Lwaste.day -1 with waste from marketplaces in a continuously agitated bioreactor and an inoculum pretreated with high temperatures at intervals of 15 min for 2 d, and a pH of 6.5; reaching a hydrogen content in the gas of 13%. Robledo-Narváez et al. (2013), reported very similar values using a batch-type reactor with urban organic waste with inoculum and pH value of 6.8, the yield obtained was 0.27 L H2 Lwaste.day -1.
The maximum yield reached, according to the organic load, was 4800 mL H2 gCODremoved -1. This yield was higher than reported by other authors (Kim et al., 2008) who obtained a yield of 128 mL H2 gCODremoved -1, with organic waste in batch fermentation and pH between five and eight. Other authors, instead, report that in fermentations oriented to the production of hydrogen using urban waste and sludge from treatment plants, the yield was 9873 mL H2 gCODremoved -1, with pH between 5.5 and 6.0, and using inoculum pretreated with high temperatures (Zhu et al., 2008).
The maximum yield with respect to the volatile solids added (YTVS), was obtained in test 4 with 608.6 mL H2 gVSadded -1, which corresponds to the test with the highest hydrogen content in the gas. A value much higher than reported by Nagao et al. (2012), who obtained yields of 48 mL H2 gVSadded -1 with a mixture of urban organic waste in an operation pH range between 5.2 and 5.5, with operating conditions similar to those evaluated in this work. Lee et al. (2010) obtained yield of 118 mL H2 gVSadded -1 with retention time of 96 d, for organic and restaurant waste. Other authors with crop and livestock waste have found that the yields can show significant variation, from 3 to more than 290 mL H2 gVSadded -1, because of the different composition of the raw material (Guo et al., 2010).
Cumulative Production of Hydrogen (CPH) according to the modified Gompertz model
The CPH, according to the modified Gompertz logistic model, showed that the highest volume of hydrogen was reached in test 2 with 20.3 L H2, followed by test 4 with 15.9 L H2 (Figure 1). The production does not begin for all the tests at the same time because this depends on the acidification time used in each of them.
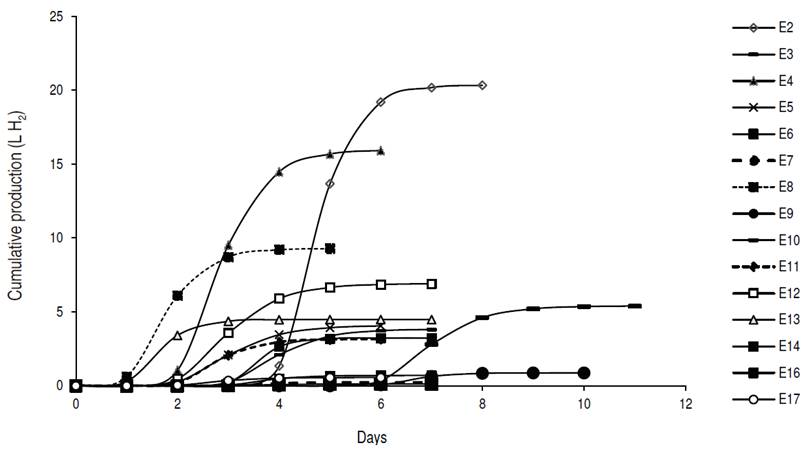
The CPH increased until reaching its asymptotic value Hmax. At this point, the daily hydrogen production ceased due to the depletion of the substrate given that the fermentations were made in batch. The experimental data were fitted appropriately to the modified Gompertz logistic model, obtaining multiple correlation coefficient higher than 0.99 (Table 3).
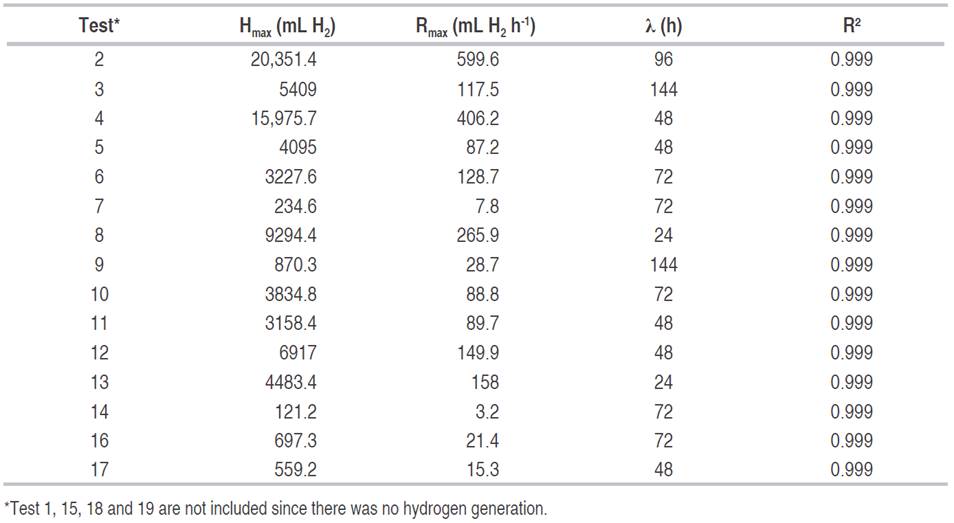
The highest hydrogen production speeds were observed in tests 2 and 4, at 599.6 and 406.2 mL H2 h-1, and adaptation times of 96 and 48 h respectively. Sharma and Li (2009) obtained hydrogen production speeds of 13 mL H2 h-1 with urban organic waste and wastewater, with correlation coefficients higher than 0.95. Gadhe et al. (2014) found a delay in the hydrogen production speed with loads higher than 50 gCOD L-1, coinciding with the results obtained in tests 3, 7, 9, 11, 14, 16 and 17 of this work, whose concentrations were between 50 and 86.75 gCOD L-1. The results seem to indicate that with organic matter concentrations greater than 70 gCOD L-1 and acidification time of 3 d, there is a decrease in the average speed of hydrogen generation.
Statistical analysis and mathematical models obtained by regression
The analysis of variance for the different response variables according to a second-order polynomial quadratic model shows that in each variable the models are statistically significant (P <0.05, Table 4). Also, in none of the cases, there is influence of the individual effects. However, two of the quadratic effects (B2 and C², operation pH and the acidification time, respectively) and combinations (AB and AD), have a statistically significant effect in the hydrogen production. The interaction between BC is significant only for the maximum content of hydrogen (MCH, %), and the cumulative production of said gas (CPH, L H2).
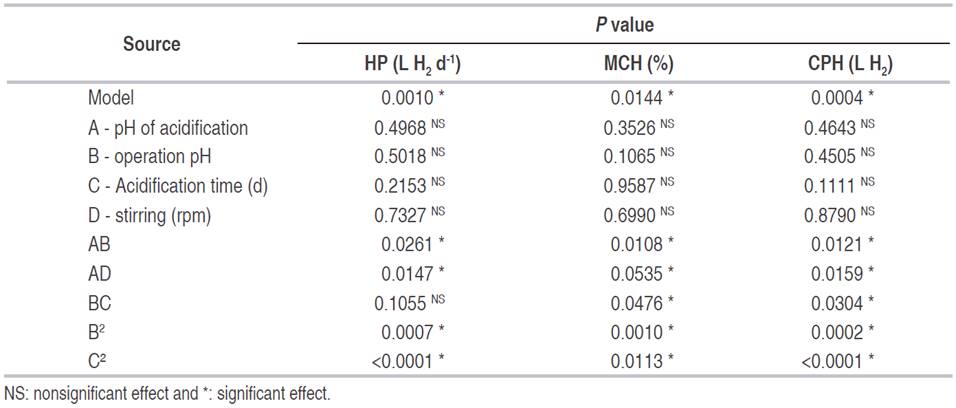
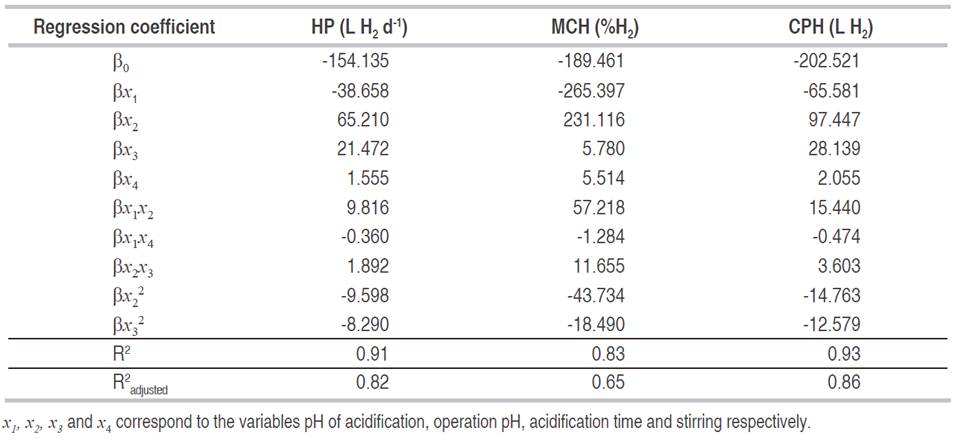
In the regression models, the variation around the mean explained by them was higher than 83% (Table 5). This situation indicates that models adequately represent the experimentation and it can be used for predictive purposes in the variables evaluated. However, in the variable maximum content of hydrogen (MCH), the variation explained by the models, taking into account the number of terms, decreased to 65% (R2 adjusted) which means the model could be reduced by eliminating the components that do not have a significant effect.
Numerical optimization of the models
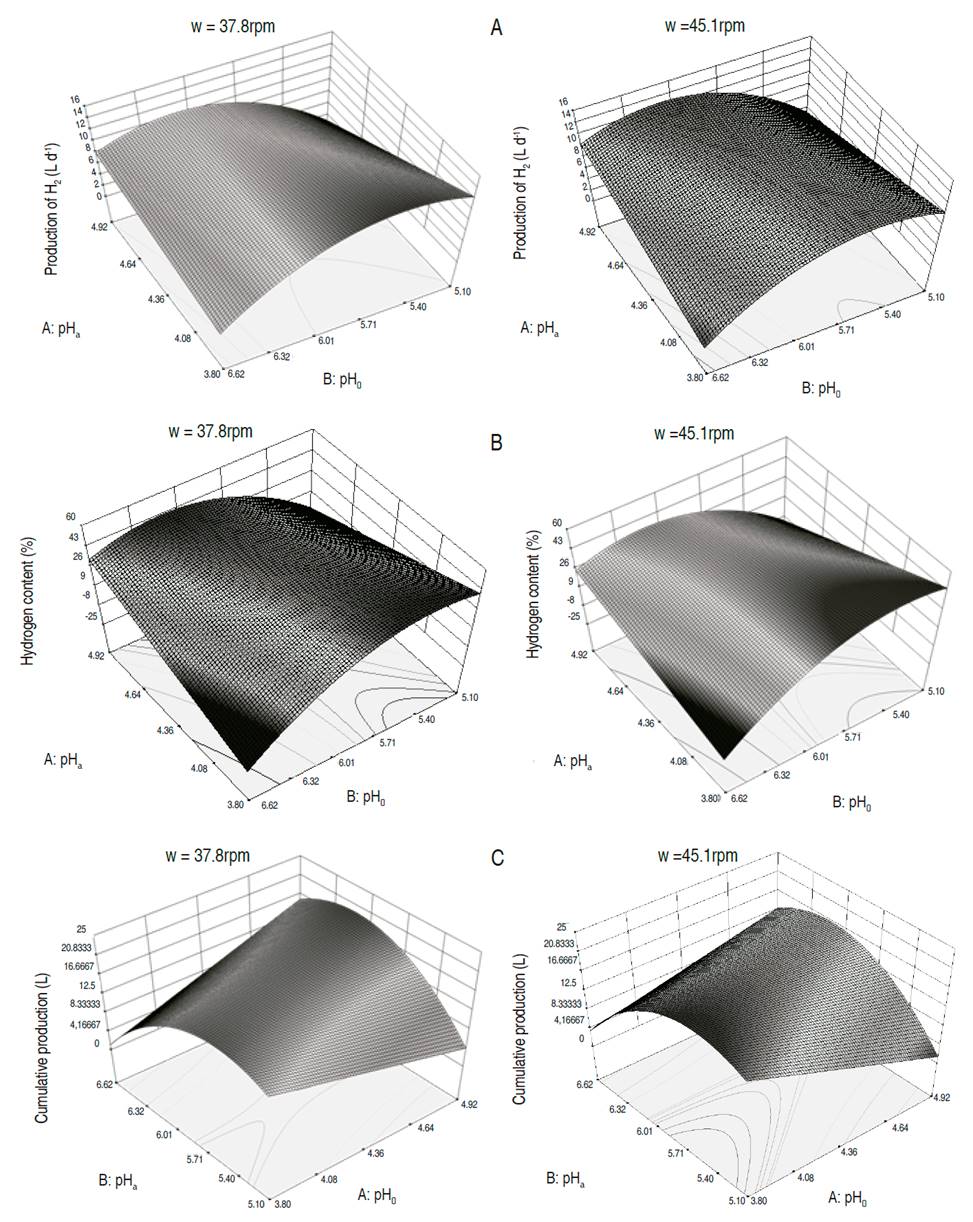
The optimization allowed to maximize the hydrogen generation, estimating the maximum daily production at 14.9 L H2 d-1 for pHa values of 4.9, pHo of 6.0, ta of 2 d and stirring of 40.2 rpm. The maximum hydrogen content in the gas is estimated at 49.2% at a pHa of 4.9, pHo of 6.2; ta of 1.9 d and stirring of 41.4 rpm. Likewise, the maximum cumulative production of hydrogen was of 21.6 L H2, for a pHa of 4.9, a pHo of 6.08, a ta of 2 d and stirring of 41.4 rpm. Values in the independent variables close to those mentioned above, also allowed to achieve the best results in hydrogen production during the experimentation. The simultaneous optimization of the three response variables showed that the fermentation should be carried out at a pHa of 4.9, a pHo of 6.0, a ta of 1.9 d and stirring of 29.9 rpm. With these values, the daily production is estimated at 14.7 L H2 d-1, the maximum content of hydrogen in the gas in 50.1% and the cumulative production in 21.6 L H2. In general, when the pHa increases and the pHo drops, or when the pHa drops, and the pHo increases, the production of hydrogen decreases taking as reference a two-day acidification time (Figure 2).
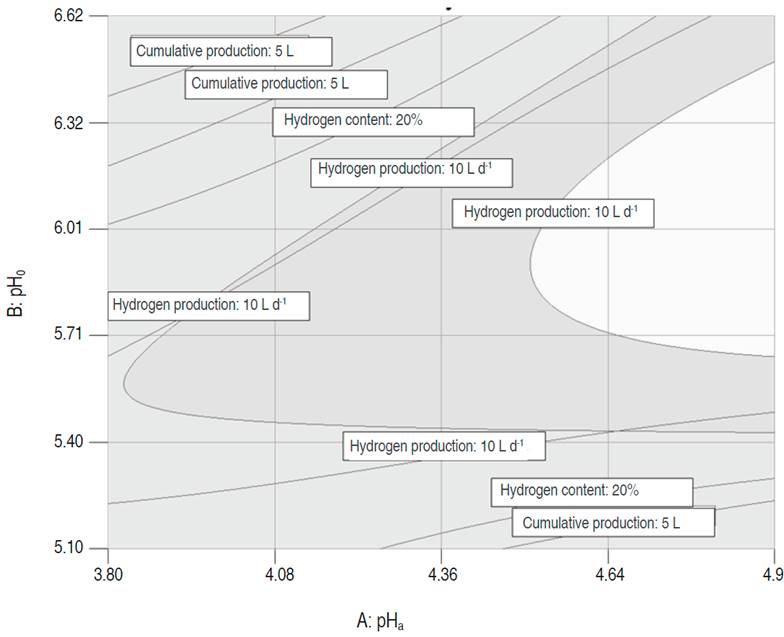
Graphical optimization
The graphical optimization displays the area of feasible response values in the factor space. Figure 3 shows the superposition of the contour plots of each variable, which allowed to find the intersection area that provided the best values for the multiple responses. The regions that did not meet the optimization criteria are shaded in dark gray, and in light gray the optimization area. The above-mentioned area was found for pHa values between 4.5 and 4.95, pHo between 5.6 and 6.3, acidification time of 2 d and stirring of 37.1 rpm; reaching a production of 14.9 L H2 d-1, a maximum content of hydrogen of 44.2% and a cumulative production of hydrogen of 22.8 L H2.
Canonical analysis
With the canonical analysis, the second-order models were rewritten in their canonical form, that is to say, in terms of the canonical variables that are transformations of the coded variables obtained in the models. In addition, the response surfaces were characterized, finding for each model the coordinates of the stationary points, the type of point, and the surface orientation. The stationary point was that in which the derivative of the model was zero. The results of the canonical analysis for the three responses show that in all cases there was a stationary point, corresponding to a saddle point. The coordinates of the stationary points and the value of the point for the hydrogen production (HP), the maximum content of hydrogen (MCH) and the cumulative production (CPH) are presented in equations 2, 3 and 4 respectively.


The coordinates of the stationary point for the four variables were found within the experimental region that was worked, and within the numerical values found by the numerical optimization. It was also found that the coordinates of the stationary point for the cumulative production variable (L H2), were close to those of the points found for the maximum content of hydrogen (% H2) and production variables (L H2 d-1), that is to say that both the numerical optimization and the graph, show a common region for the optimum.
CONCLUSIONS
It was possible to obtain hydrogen from anaerobic fermentation of organic waste without using inoculum in a batch-type bioreactor, varying the acidification time, the rate stirring, the pH of acidification, and operation pH, obtaining up to 14.4 L H2 d-1, hydrogen content up to 42.4%, and cumulative production of 20.4 L H2. The optimization of the variables studied leads to the conclusion that for the production of hydrogen the linear variables (individual effects) have no significant influence. However, the quadratic terms for operation pH and acidification time, and the interactions between pH of acidification and operation pH, and between pH of acidification and stirring have a statistically significant effect. The response variables were adjusted to second-order polynomial models with an R2 between 0.83 and 0.93. In addition, it was possible to optimize the three response variables obtaining a maximum of 14.9 L H2 d-1 and 49.2% of H2 by numerical optimization, and of 22.8 L H2 accumulated by graphical optimization.

