


 English (pdf)
 Article in xml format
 Article references
 Send this article by e-mail
 Cited by SciELO
  Cited by Google
  Similars in
SciELO
Similars in
SciELO  Similars in Google
 Permalink
Durum wheat (Triticum durum Desf.) is an important field crop in Algeria. It is mainly grown on the high plateaus area, which belongs to a vast geographical region where agriculture, because of climatic changes, has been forecast to be at higher risk due to an increase in the frequency and severity of drought episodes (Sahnoune et al., 2013). Selection of drought-tolerant cultivars is sought to minimize the effects of water scarcity and sustain crop production. The release of improved cultivars that require lower amounts of water per unit yield and characterized by high yield potential, is essential for more sustainable agricultural practices, particularly in rainfed, drought-prone areas (Belagrouz et al., 2018). Durum wheat breeding program aims to select genotypes with improved biotic and abiotic stresses tolerance and high grain yield potential (Annicchiarico et al., 2005). Crop end cycle drought and high temperatures induce changes in plant physiological functions, causing damages, inhibiting growth, and thereby reducing grain yield.
Relative water content refIects a balance between water supply to the leaf and leaf transpiration rate. This trait is seen as an important indicator of plant water status under drought stress conditions (Dhanda and Sethi, 2002). Chlorophyll content or stay green is positively associated with photosynthetic rate, grain yield improvement, and transpiration efficiency under drought stress conditions (Benbella and Paulsen, 1998). Concomitant improvement of both harvest index and biological yield increase yield potential and enhance water use efficiency (Quarrie et al., 1999; Belagrouz et al., 2018). These traits could serve as selection criteria to improve both stress tolerance and yield potential indirectly. Little information is available on the inheritance of these characters, under rainfed durum wheat cropping systems, it is, therefore, necessary to assess the estimates of gene effects to ensure better selection gain.
Knowledge of genetic behavior and type of gene action controlling physiological and agronomical targeted traits is a fundamental principle for designing an appropriate breeding procedure for genetic improvement (Fellahi et al., 2016; Hannachi et al., 2017). Inheritance of quantitative traits has been described as a moving target because these traits are affected not only by the action of multiple genes, with small individual effect, but also by the interaction between genes and between genotype and environment. Genetic statistical models have been devised to investigate the inheritance of such traits (Mather and Jinks, 1982; Kearsey and Pooni, 1996). Generation means analysis is, among such models, a useful technique to estimate variance components, heritability, and gene effects governing traits of interest (Mather and Jinks, 1982; Kearsey and Pooni, 1996). This technic helps to understand the performance of selected parents and the potential of the resulting population to employ for either heterosis exploitation or pedigree selection (Singh et al., 1985; Singh and Chaudahry 1985).
Results of various studies, investigating the genetic basis of quantitative traits related to stress tolerance (yield and yield components) reported that dominance effects and epistasis were more important and predominant than additive effects (Bhutta and Mishra, 1995; Golparvar et al., 2006; Mahpara et al., 2018). However, Dhanda and Sethi (1998) reported significant additive gene effects and high narrow-sense heritability for harvest index, biological yield, and relative water content concluding that possibilities existed to improve these traits under drought stress condition. The present study aims to assess the nature and magnitude of additive, dominance, and epistatic gene effects for some physiological and agronomical targeted traits in rainfed durum wheat through generation means analysis.
MATERIALS AND METHODS
Site, plant material, and experimental design
Two phenotypically divergent durum wheat (Triticum durum Desf.) varieties, namely, Bousselam, derived from Heider/Martes//Huevos de Oro cross, and Mrb5, derived from JoriC69/Haurani (Adjabi et al., 2014) were hybridized during 2015-2016 cropping season at the Field Crop Institute, Agricultural Experimental Station of Setif (ITGC, AES, 36°12’ N 05°24’E, 1080 m.a.s.l., Setif, Algeria). The F1 generation was grown the following season (2016-2017), along with parental genotypes which were crossed again to obtain F1 generation, and the seeded F1 was crossed to each parent to obtain backcross generations.
The next season (2017-2018), the six basic-generation, that is parents (P1, P2), first and second filial (F1, F2) and backcrosses (BC1, BC2) generations were sown in a randomized completed block design, with five replications. Parents, F1, and backcross generations were sown in one row, 2 m long, 20 cm inter-row spacing and 10 cm plant-plant spacing in the row. The F2 generation was sown in thirty rows 2 m long. Recommended cultural practices for the area were followed to raise a good crop. 80 kg ha-1 of mono-ammonium phosphate (52% P2O5 + 12% N) was applied just before sowing, and 80 kg ha-1 of urea (46% N) was broadcasted at the tillering stage. Weeds were controlled chemically by application of 150 g ha-1 of Zoom (Dicamba 66% Triasulfuron 4%) and 1.2 L ha-1 of Traxos (22.5 g L-1 of Pinoxaden, 22.5 g L-1 of Clodinafop-propargyl, 6.5 g L-1 of Cloquintocet-mexyl) herbicides.
Data collection
Data were collected from 5, 5, 10, and 30 plants per replication of parents, F1, backcrosses, and F2 generation, respectively. The small sample size was used for generations whose variability is only from the environmental origin (homogeneous generations. i.e., Parents and F1), while the large sample size was used for generations whose variability was both environmental and genetic origin (heterogeneous generations, i.e., BCs and F2). Relative water content (RWC) was determined according to Barrs and Weartherly (1962) as described by Pask et al. (2012). Fresh leaves were collected, at the anthesis, from each generation per replication and weighted immediately to record fresh weight (FW). Leaf samples were placed in distilled water for 24 h and weighed again to record turgid weight (TW). Leaf samples were then subjected to oven drying at 72 °C for 24 h to record dry weight (DW). RWC was calculated as follow: RWC=[(FW-DW)/(TW-DW)]×100. Flag leaf chlorophyll content (Chl, CCI) was determined with a CCM-200 chlorophyll meter (Opti-Sciences, Tyngsboro, MA, USA) at the anthesis growth stage. Chlorophyll measurements were taken from the middle of the flag leaf. The following measurements, plant height (PH, cm), plant dry weight (BIO, g), number of spikes (NS), number of grains per spike (NGS), grain yield (GY, g), 1000-kernel weight (TKW, g), and harvest index (HI, %), were also determined on a plant basis at crop maturity.
Data analysis
Collected data were subjected to a simple parametric analysis of variance using Cropstat software (IRRI, 2007) to test generation effect. Whenever this effect, tested against the residual mean square, was significant, genetic analysis for the specific trait was undertaken. Traits’ mean, maximum, minimum and coefficient of variation values were calculated to describe the distribution of generated generations relatively to the crossed parents, and mean values were separated using Duncan Multiple Range Test at 5% probability level. Contrast method was employed to test differences between homogeneous (non-segregating) and heterogeneous (segregating) generations and within homogeneous generations; between F1 and mid-parent, and between parents, and within heterogeneous generations; between F2 and average backcrosses, and between backcrosses (Steel and Torrie, 1982). The ANOVA F-test determines the significance of generation effect, which is a prerequisite to proceed for the generation means analysis, while contrasts test the presence of additive vs. dominance effects.
In the generation means analysis, notations adopted for gene effects were (m), (d), (h), (i), (j), and (l) representing main, additive, dominance gene effects, additive×additive, additive×dominance, and dominance×dominance epistatic gene effects, respectively. Additive-dominance model adequacy was tested using Chi-square (χ2) test as proposed by Cavalli (1952). Three-parameter model was employed to determine (m), (d), (h) gene effects in the absence of epistasis. Whereas in the presence of non-allelic interaction six-parameter genetic model ((m), (d), (h), (i), (j), and (l)) was adopted (Mather and Jinks, 1982). The most appropriate genetic model (three vs. six parameters) was also determined using the ABCD scaling test. This test provides information regarding absence or presence of gene interactions, and when the scale is adequate, the values of A, B, C, and D tests should be zero within the limit of their respective standard errors (Mather and Jinks, 1982). Significance of any one of these scaling tests indicates the presence of genes interaction, suggesting the inadequacy of the additive - dominance model. Gene effects were tested for significance using the t-test (Kearsey and Pooni, 1996). Three and six-parameter analyses were performed using GENMEANS subroutine implemented in Tnaustat software (Manivannan, 2014).
Genotypic and environmental variance components, of the measured traits, were estimated by equating the observed values of the different generations as follows: σ2 E=¼(σ2 P1+σ2 P2+2σ2 F1), σ2 D=(2σ2 F2-σ2 BC1-σ2 BC2), σ2 H= 4(σ2 F2-½σ2 D-σ2 E) (Mather and Jinks, 1982). Standard errors were calculated with /, where σx is the standard deviation of the parameter examined. The significance of the mean value of a particular parameter was tested against its corresponding standard error, via a Student’s t-test, as suggested by Mather and Jinks (1982) and Uzokwe et al. (2017).
Broad-sense heritability (h2 bs) was calculated as follow: h2 bs=(σ2D+σ2H)/(σ2D+σ2H+σ2E)=(σ2G)/(σ2P) (Kearsey and Pooni, 1996), where σ2D, σ2H, σ2E, σ2G, and σ2 P stand for the additive, dominance, environmental variance components, genetic, and phenotypic variances, respectively. When σ2 D, σ2 H, or σ2 E estimates were negative or zero, h2 bs was calculated as σ2G/σ2P where σ2 G is the genetic variance and σ2 P is equal to two times the variance of the F2 progeny (2σ2 F2) (Kearsey and Pooni, 1996). Narrow-sense heritability (h2 ns) was estimated as follow: h2 ns=σ2 D/(σ2 D+σ2 H+σ2 E)=(σ2 D)/(σ2 P), standard errors (SE) of these estimates were calculated as: SE(h2 bs)=[SE(σ2G)]/(σ2 P) and SE(h2 ns)=[SE(σ2 D)]/(σ2 P) (Hallauer and Miranda Filho, 1989). Significance of these parameters, h2 bs and h2 ns was tested using a t-test equals to the ratio of heritability over its standard error (Halloran et al., 1979). Heritability was considered as low (<30%), moderate (31-60%) and high (>61%) as proposed by Robinson et al. (1949), Johnson et al. (1955), as reported by Azimi et al. (2017).
The average degree of dominance was estimated as  and expected a response to selection, absolute value (R) and relative to the grand mean (R%), was derived according to Sing and Chaudhary (1999) as follows:
  and
and  trait mean. Relationship between studied traits and grain yield was inspected through genotypic correlation coefficient (rg), which was derived as the ratio of covariance to the square root of the product of the corresponding variances of the two traits considered. Genotypic covariance was determined using the property of the analysis of variance of the sum of two variables as suggested by Kwon and Torrie (1964) and described by Mansouri et al. (2018), using Past software (Hammer et al., 2001). The standard error of rg was derived using the formulae of Reeves (1955), reported by Koots and Gibson (1996), as follows. The Student’s t-test was used to determinate the significance of the correlation coefficient:
Where h2i and h2j are the trait’s heritabilities considered.
RESULTS AND DISCUSSION
Mean performances
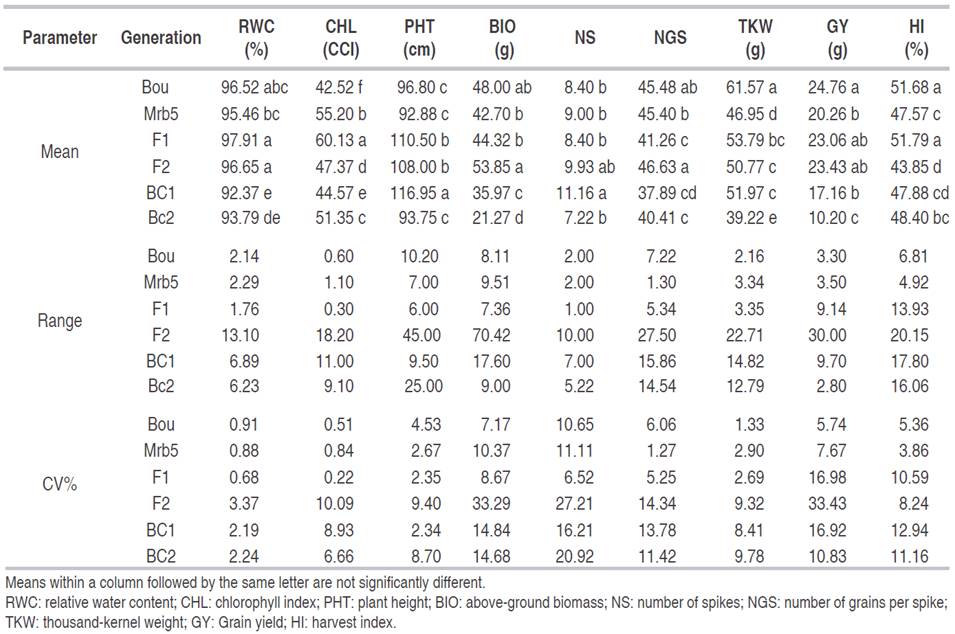
The analysis of variance (Table 1) revealed significant differences among generations’ traits; RWC, CHL, PHT, BIO, NS, NGS, TKW, GY, and HI. Significant generation effect is a prerequisite to perform generation means analysis to study the inheritance of the targeted traits. The mean of traits varied among generations; from 92.37 to 97.91% for RWC, from 42.52 to 60.13 CCI for CHL, from 92.88 to 116.95 cm for PHT, from 21.27 to 53.85 g for BIO, from 7.22 to 11.16 spikes for NS, from 37.89 to 46.63 kernels for NGS, from 39.22 to 61.57 g for TKW, from 10.20 to 24.76 g for GY, and from 43.85 to 51.68% for HI. Because of segregation effects, range and CV% were higher in F2 and BCs than in parents and F1, for all traits considered (Table 2).
Table 1 Mean square deviations of the analysis of variance for nine physio-agronomical traits in durum wheat cross.
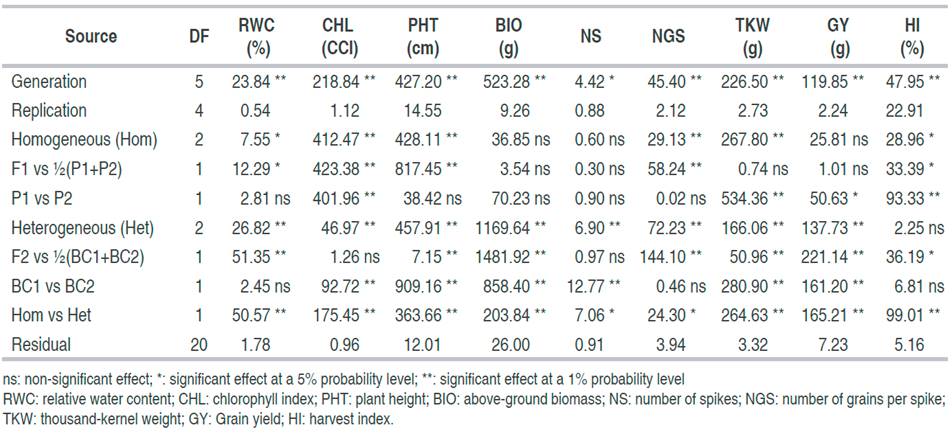
Table 2 Mean performances, range and CV% values of the 6-basic generations for nine physio-agronomical traits in durum wheat cross
Application of generation means analysis procedure is based on the hypothesis that the studied generations must arise from a cross, involving two contrasting genotypes. The differences expressed during this cropping season, between the parents involved in the present cross, are shown in Figure 1. DMRT test showed that differences between crossed parents were only significant for GY, HI, TKW and CHL, for which Bousselam had an advantage, except CHL which was at the advantage of Mrb5 (Figure 1). This is confirmed by the contrast analysis (Tables 1 and 2). Dvojković et al. (2010) found that the crossed parents differed significantly for some traits but not for others. Hence, the choice of Bousselam and Mrb5 varieties as parents to develop breeding material for conducting genetic studies and improve both stress tolerance and yield potential appears appealing for some traits.
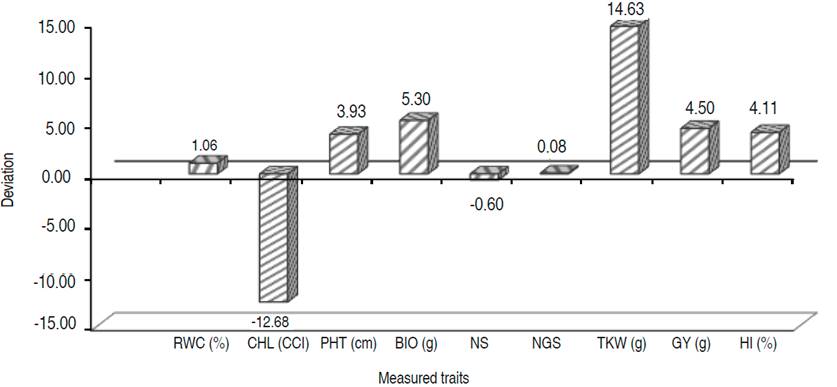
Figure 1 Mean deviations (xBousselam- xMrb5) between the parents for the nine studied traits. RWC: relative water content; CHL: chlorophyll index; PHT: plant height; BIO: above-ground biomass; NS: number of spikes; NGS: number of grains per spike; TKW: thousand-kernel weight; GY: Grain yield; HI: harvest index.
Significant differences existed among the means of the non-segregating generations for RWC, CHL, PHT, TKW, HI, and NGS but not for BIO, NS and GY, as shown by the analysis of variance. Contrast analysis showed that F1 means differed significantly from mid-parent average for RWC, CHL, PHT, NGS, and HI, and non-significantly for BIO, NS, TKW, and GY (Table 1). These results suggested that partial dominance was involved in the genetic control of RWC, CHL, PHT, NGS, and HI; while additive genetic control was expressed for BIO, NS, TKW, and GY. In this context, García-Navarro et al. (2016) reported for two characters that the average values of F1 were higher than the mid parent values, indicating incomplete dominance of the alleles controlling these characteristics.
The sign of the deviation of the mid-parent mean value from F1 mean value suggested that dominance acted in the direction of the increased trait value for RWC, CHL, PHT, and HI, and in the direction of decreased trait values for NGS (Table 2). This suggested that dominant alleles control high values of the first cited traits, while recessive alleles control high values of NGS. Based on contrast analysis, differences between parents were significant for CHL, TKW, GY, and HI but not for RWC, PHT, BIO, NS, and NGS (Tables 1 and 2). Significant differences existed among segregating generations for all studied traits except for HI. Mean values of the F2 generation deviated significantly from the BCs generations mean values for all studied traits except for CHL and NS (Table 1). Position of the F2 mean among the segregating generations (F2 and BCs) varied among traits. According to the DMRT test, F2 average was significantly higher than both BCs’ means for TRE, BIO, NGS, and GY. It was significantly higher than BC1 and significantly lower than BC2 for CHL. It was significantly higher than BC2 and significantly lower than BC1 for PHT, there was non- significantly differences between F2 and both BC1 and BC2’s means for NS, but significantly different from BC2 and non-significant different from BC1 means for TKW. F2 mean was significantly different from BC2 but not from BC1 mean for TKW. Harvest index F2 average was non-significantly different from BC1 but significantly different from BC2 means (Table 1 and 2). These results indicated that the mean values of the generated populations fell within the parental range for some traits and outside of this range for other traits suggesting dominance to over-dominance gene expressions. According to Dvojković et al. (2010), differences between F2 and BC generation mean values arise from different parental allelic contributions.
Gene effects
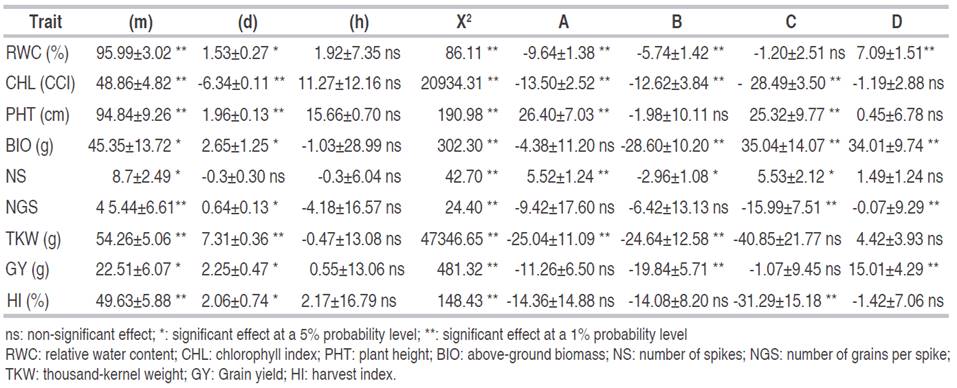
Application of the additive-dominance model with three-parameter revealed that (m) and (d) components were significant for all traits, excepted (d) effect for NS. The (h) gene effect was non-significant for all traits (Table 3), suggesting that almost all studied traits were under the genetic control of additive nature. However, the deviation of the observed from the expected generation means was highly significant for all traits, as shown by the Chi-squared test. This result suggests that the three-parameter model was not adequate to explain the observed genetic variation for the traits under study because of the presence of non-allelic interaction. The inadequacy of the three-parameter model was also shown by the significance of at least one of the A, B, C, and D scaling tests (Table 3).
Table 3 Joint scaling and scaling tests for adequacy of the additive-dominance model for nine physio-agronomical traits in durum wheat cross.
Estimates of the effect of genes are derived from the six-parameter model given in Table 4. Gene main effect (m) was significant for all analyzed traits, indicating that these traits were quantitatively inherited. These results are in accordance with Ninghot et al. (2016) and Bilgin et al. (2016). Additive (d) and dominance (h) gene effects, additive×additive (i), additive×dominance (j) and dominance×dominance (l) non-allelic interactions were significant for BIO and GY. Additive (d) gene effect, additive×additive (i), additive×dominance (j) and dominance×dominance (l) non-allelic interactions were significant for TKW. Dominance (h) gene effect, additive×additive (i), additive×dominance (j) and dominance×dominance (l) non-allelic interactions were significant for RWC. Additive (d) gene effect and additive×dominance (j) non-allelic interactions were significant for PHT and NS. Additive (d) and dominance gene effects (h), and dominance×dominance (l) non-allelic interaction were significant for CHL, while dominance gene effect (h), and additive×additive (i) non-allelic interaction were significant for HI.
Table 4 Estimates of gene effects of the six-parameter genetic model for nine physio-agronomical traits in durum wheat cross.
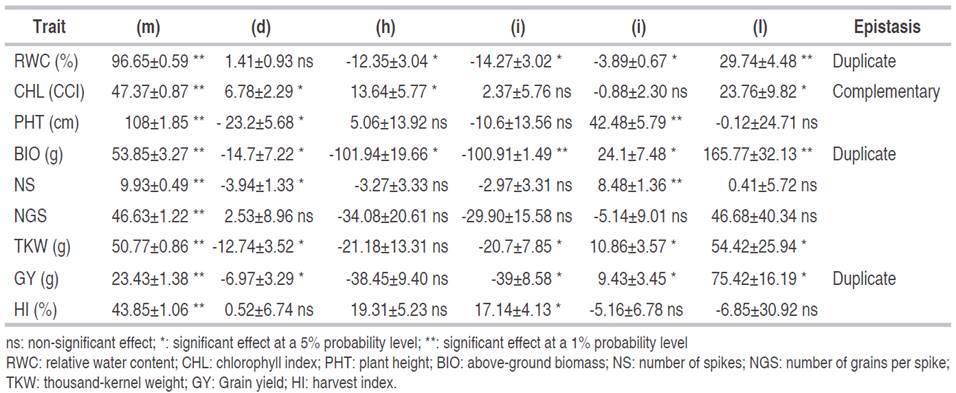
Additive (d) and dominance gene effects (h), additive×additive (i), additive×dominance (j) and dominance×dominance (l) non-allelic interactions were non-significant for NGS. The 6-parameter model was not adequate for this trait, suggesting that higher than digenic interaction should be tested (Table 4) Either (h) and (l) and (j) had higher values than (d) and (i), suggesting that dominance played a major role in the inheritance of RWC, CHL, PHT, BIO, NS, TKW, GY, and HI (Table 4). According to Kearsey and Pooni (1996), a greater magnitude of dominance compared to additive gene effects arises when genes are dispersed in the parents. In this case, the estimate of the additive component is reduced compared to the dominance component estimate. Results of the present study indicated that genes controlling the studied traits are predominantly dispersed in the parents. Kearsey and Pooni (1996) mentioned that epistasis is determined when dominance (h) and dominance×dominance (l) effects were significant. When these effects had the same sign, epistasis is of complementary type, while different signs indicated duplicate epistasis. In the present study, the presence of duplicate epistasis controlling the inheritance of RWC, BIO, and GY is suspected because (h) and (l) components had opposite signs. This type of epistasis limits the variability range and early selection efficiency (Kearsey and Pooni, 1996). Thus, selection of RWC, BIO, and GY must be delayed to advanced generations to benefit from the reduction of non-fixable genetic variation and exploit transgressive segregants due to significant additive×additive (i) gene effects and duplicate type epistasis.
Dominance (h) and dominance×dominance (l) epistatic gene effects had a similar sign; which suggested complementary epistatic effects for CHL. Compared to what is reported in the literature, the results of the present study corroborate findings of Ferrari et al. (2018), who observed that for GY additive (d) gene effect was not significant, but dominance (h) and dominance×dominance (l) epistatic effects made the higher contribution to the inheritance of this trait. For this character, Ljubičić et al. (2016) reported duplicate type epistasis, proposing to delay selection for this trait because of the narrow range of variability and high probability of low selection success in an early generation. Analysis of the nature and magnitude of the gene effects of quantitative traits helps to design an efficient improvement program (Shekhawat et al., 2000). Goldringer et al. (1997) found that PHT was inherited additively, while GY showed larger epistatic than additive effects. The six-parameter model revealed that non-additive (h) and epistatic genetic effects, and some additive (d) gene effects played a significant role in the inheritance of the studied traits. Dominance (h) and dominance×dominance (l) gene effects were relatively higher compared to additive (d) gene effects for all traits except NGS, revealing the low importance of additive gene effects in the genetic control of the studied traits. It seems that the genetic control of a given trait cannot be definitively characterized because it depends on the genetic material studied and the environmental conditions. Based on the findings of the present research, it can be concluded that the investigated traits show complex genetic behavior, which implies that early selection would be less efficient. Selection in advanced generations is recommended for the improvement of the above-cited traits.
Heritabilities, degree of dominance, expected response to selection, and genotypic correlation
Estimates of heritability are useful for a breeder to weigh the proportion of variation which is inheritable from that which is non-heritable. Results of the present study indicated that broad sense heritability values varied from almost 1.00 for CHL to 0.59 for HI. Based on the Student’s t-test, these values were significant for RWC, CHL, PHT, BIO, NS, NGS, and GY and non-significant for TKW and HI. Narrow senses heritability values were somewhat lower than their counterpart broad sense heritabilities, varying from 0.93 for NGS to 0.35 for TKW, but they were significant for all trait, except HI (Table 5). The fact that h2 bs of TKW was non- significant, while its counterpart h2 ns was; it arises from the size of the standard error of each parameter, low for h2 ns and large for h2 bs. Globally these heritability values corroborated those reported by Dvojković et al. (2010), who found that narrow sense heritability values ranged among crosses, from 0.35 to 0.42 for NGS, from 0.50 to 0.50 for GY, and from 0.29 to 0.41 for TKW. Novoselovic et al. (2004) reported for the same parameters, values ranging, among cross combinations, from 0.54 to 0.81 for PHT, from 0.09 to 0.76 for NS, from 0.11 to 0.99 for NGS, from 0.21 to 0.78 for GY, and from 0.49 to 0.72 for TKW. High heritability values indicate that the environment least influences the characters studied in their expression, which suggests that selection for these traits would be effective owing to their high genetic transmissibility.
Table 5 Broad (h2 bs) and narrow sense (h2 ns) heritabilities, average degree of dominance (/), genotypic correlation between GY (rg) and the studied traits, and expected response to selection expressed as % of the trait overall mean (R%).
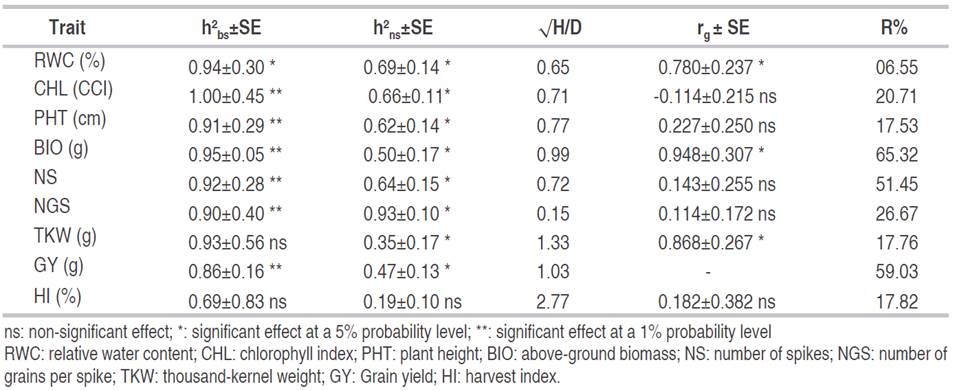
The average degree of dominance values was less than unity: 0.15, 0.65, 0.71, 0.72, and 0.77 for GY, RWC, CHL, NS, and PHT, respectively; it suggested partial dominance. Complete dominance was observed for BIO and GY, whose average degree of dominance was equal to unity, while super-dominance was involved in the genetic control of TKW and HI (Table 5). Thus, the preponderance of non-additive genetic control and low to intermediate heritability values suggested delaying selection to later advanced generation for the studied traits. These results agree with those reported by Dorri et al. (2014) and Fellahi et al. (2016).
Mohamed et al. (2013) reported predominance of additive gene effect in the inheritance of TKW while the predominance of non-additive gene effect was involved in the inheritance of PHT, NS, and GY per plant. These authors also noted that the average degree of dominance indicated overdominance for TKW, and partial to complete dominance for PHT, NS, and GY. Madic et al. (2002) found that the average degree of dominance indicated over-dominance in the inheritance of HI, which showed a low, narrow-sense heritability of 0.26 because of a strong environmental effect on the expression of this trait. However, Mohamed (2014) reported significant additive genetic effects and greater influence of epistasis.
Selection is concerned with changes of two or more characters simultaneously; thus, this study of the relationships between agronomic traits becomes important. This information helps to identify useful characters which are an indicator of grain yield potential. In this context, phenotypic correlation is less important than genetic correlation because environmental effects usually inflate it. Genetic correlation provides a measurement of genetic association between characters and is used in selection to target another character genetically more complex. Genotypic correlation coefficients, relating GY to the other studied traits, found in this study, were non-significant for CHL (-0.114ns), PHT (0.227ns), NS (0.143ns), NGS (0.114ns) and HI (0.182ns) and significant for RWC (0.780*), BIO (0.948*) and TWK (0.668*) (Table5). These results suggested that delayed selection based on RWC, BIO, or TKW may improve GY substantially. Expected response to selection is based on phenotypic variability, broad-sense heritability, and selection intensity (5% selection intensity). Based on the classification of this parameter, attributed to Johnson et al. (1955); values found in the present study were low, being less than 10% for RWC, moderate, in the 10 - 20% range, for PHT, TKW and HI, and high, above 20%, for CHL, BIO, NS, NGS, and GY (Table 5). These results corroborated findings of Majumder et al. (2008) who noted that PHT, NS, NGS, TKW, HI, and GY showed an appreciable genetic advance of 23.39, 13.31, 39.06, 33.88, 31.90, and 32.82%, respectively. Fellahi et al. (2015) reported estimates of the expected response to selection ranging from 10.58% for TKW to 63.25% for GY.
CONCLUSION
Results of the present investigation indicated that gene main (m) effects, derived from the six-parameter model, was significant for all studied traits; while significance of additive (d), dominance (h), additive×additive (i), additive×dominance (j) and dominance×dominance (l) gene effects and allelic interactions varied among traits. These results suggested that dominance played a major role in the inheritance of the studied traits and that the genes involved in the inheritance of these traits are predominantly dispersed in the parents with the presence of duplicate epistasis for RWC, BIO, and GY, and complementary epistasis for CHL. Narrow sense heritability values varied from 0.93 for NGS to 0.35 for TKW and significant for all trait except HI. The average degree of dominance values was less than unity for GY, RWC, CHL, NS, and PHT, suggesting partial dominance. Complete dominance was observed for BIO and GY, while super-dominance was involved in the genetic control of TKW and HI. High genotypic correlation coefficients were found between GY and RWC, BIO, and TWK. Expected responses to selection were low for RWC, moderate for PHT, TKW, and HI, and high for CHL, BIO, NS, NGS, and GY. Based on these findings it can be concluded that the investigated traits show complex genetic behavior, which implies that early selection would be less efficient; therefore, it is recommended delaying the selection to advanced generations to benefit from the reduction of non-fixable genetic variation and exploit transgressive segregators due to the significant interaction additivity×additivity (i) of the gene and duplicated epistasis.

