


 English (pdf)
 Article in xml format
 Article references
 Send this article by e-mail
 Cited by SciELO
  Cited by Google
  Similars in
SciELO
Similars in
SciELO  Similars in Google
 Permalink
Molecular hydrogen (H2) as an energy vector has aroused great interest given its high energy capacity, the diversity of applications, and the low environmental impact during its use. It can be obtained through microorganisms in microbial electrolysis cells, photo-fermentation, and dark fermentation. In the first case, the cost of the electrodes is high; and in the second one, it is necessary to supply light, creating a negative energy balance (Show et al., 2011; Liu et al., 2015). Dark fermentation does not depend on the light supply, it is considered more sustainable, and it allows the use of complex substrates such as organic waste (Laxman et al., 2015, Ortigueira et al., 2015). These complex substrates are discarded in agricultural, livestock, agro-industrial processes, and human activities; making them abundant and inexpensive (Ghimire et al., 2015). Fermentations with simple substrates composed of monosaccharide such as glucose, fructose, xylose or mannose generated high yields in hydrogen production; however, their cost and limited availability restrict their use.
Some researchers have proposed the co-digestion of several types of organic waste, previously sterilized and with the addition of inoculum, in order to reach and even exceed the yields obtained when using simple substrates. This approach could make it possible to achieve a better balance of the Carbon/Nitrogen ratio, a better dilution of toxic components, an increase in the loading of biodegradable organic matter, an improvement the nutrient balance, and the production of synergistic effects among microorganisms (Angeriz-Campoy et al., 2015). Besides, the co-digestion helps to regulate the increase in the volatile organic acid concentrations, which are produced when biohydrogen is generated and can limit the gas generation. It has been documented that for concentrations higher than 9 g L-1 of butyric acid, the growth of several hydrogen-producing bacteria is inhibited (Chong et al., 2009).
In the biohydrogen production by fermentation, the use of pure cultures has prevailed. However, its main limitation lies in the availability of the substrate and in guaranteeing its sterilization (Lee et al., 2011). When using organic waste, the simultaneous presence of obligate and facultative anaerobic bacteria can contribute to improving the yields (Elsharnouby et al., 2013). In these cases, some bacteria can facilitate the hydrolysis of complex carbohydrates, leaving them available for the hydrogen-producing bacteria; besides, different types of bacteria can consume a particular component without competing with others (Chong et al., 2009; Mthethwa et al., 2019). Fermentations that use substrates with a low cost, high-availability, rapid assimilation, and that do not require pretreatment and sterilization, are considered the most desired (Elsharnouby et al., 2013). Furthermore, when a low-cost acidification pretreatment is applied, some bacteria that consume hydrogen will die, which could improve hydrogen production (Prabakar et al., 2019). A fermentation based on an indigenous consortium could satisfy these demands because the bacteria would be adapted to thrive in a non-sterile environment and would adjust better to sudden changes during fermentation (Show et al., 2011).
Few reports are available in Colombia about the generation of hydrogen by fermentation, Hernández et al. (2014) used coffee mucilage in co-digestion with pig manure to generate hydrogen, obtaining a maximum production rate of 7.6 NLH2 Lmucilage-day -1, and hydrogen content in the gas of up to 39%. They also identified that said gas was generated through two metabolic pathways, butyric and acetic. Cano (2015) studied the production of biohydrogen from urban organic waste, achieving yields of 1.9 LH2 Lwaste-day -1 and 132.9 mL of H2 per gram of Volatile Solids (VS) added, finding that the hydrogen content and its production were fitted to second-order polynomial models. Their subsequent optimization indicated that the maximum values were reached at a pH of 6.2, an agitation of 41 rpm and an organic load between 45,000 and 75,000 mg O2 L-1.
Considering the requirements (inoculum and susbtrate) of hydrogen production nowadays, the objective of the present work was to evaluate the effect of substrate composition, organic load, acidification time, operation pH, and temperature on the hydrogen production obtained by anaerobic fermentation of a complex substrate, composed of fruit and vegetable wastes with coffee mucilage, in mesophilic conditions without sterilization of the substrate and using its native microorganisms.
MATERIALS AND METHODS
The tests were performed in the Agricultural Mechanization Laboratory of the Faculty of Agricultural Sciences at Universidad Nacional de Colombia, Medellín campus. Their execution was done under a central composite experimental design (CCD), with five factors, two levels in each factor, and three dependent variables, which was implemented in the Design Expert® software version 9.0 from State-easy. The central composite experimental design was partial to reduce the number of trials and cost. The study factors were substrate composition (SC, %), organic load (ORL, mgO2 L-1), acidification time (AT, days), operation pH (pHo) and temperature (Tf, °C). The design produced 26 tests, and the factor values were normalized between cero and one (Myers et al., 2009).
SC was a proportion by volume of fruit and vegetable waste (lettuce, Tommy Atkins mango, Valencia orange, guava, and papaya), and fresh coffee mucilage. The Central Mayorista de Antioquia supplied the fruit and vegetable wastes, and the fresh mucilage by Casa de Sabaneta farm in Sabaneta (Antioquia), using a mechanical demucilager for Castillo coffee variety. At the beginning of each test, the fruits and vegetable waste were crushed and mixed with the mucilage, and then deposited in a 20-liter stainless steel bioreactor operated in batch mode with a working volume of 14 L. Then, nothing was done to the process during the AT. This process was natural, no chemical compound was added, and when this time ended, agricultural lime was added (with 95% of calcium carbonate, CaCO3, 2% humidity and 54% soluble CaO), until reaching the operation pH of the test, with a range of ±0.2. Simultaneously, the temperature was increased until reaching the value corresponding to the test, and the mixture was stirred at 45 rpm for 5 minutes every hour. This agitation was the same for all the tests.
The SC levels, fresh mucilage:fruit and vegetable ratio, were 80:20, 20:80, 50:50, 100:0, and 0:100. ORL was defined as the chemical oxygen demand of the substrate (COD), with a lower level of 20,000 mgO2 L-1. It was calculated at the beginning and the end of the tests (iCOD and fCOD respectively, mgO2 L-1), the same as the total volatile solids (iTVS and fTVS, mg L-1). For each trial, the organic load was obtained by diluting the substrate in water. In both cases, samples of 250 mL were taken and analyzed according to methods 5220D and 2540E (APHA, 2012). AT levels were of 1, 2, and 3 days. pHo was recorded with a YK-21PH device, with a resolution of 0.02 and an accuracy of ±0.2, and an S450CD Sensorex electrode. The lowest level of pHo was of 5.5, as recommended by Moreno et al. (2013), the same as the COD levels. The temperature of the tests (Tf) was measured in the bioreactor with an analogous sensor with a resolution of 1 °C and an accuracy of ±1 °C. The levels were of 30, 35 and 40 °C, according to preliminary tests.
The dependent variables were the maximum hydrogen content in the gas (MHC, %), maximum daily hydrogen production (MDP, LH2 d-1) and the cumulative hydrogen production (CHP, LH2). Samples were taken using Tedlar bags with a capacity of 1 L in order to measure the fraction of hydrogen present in the gas (Restek 22950). These samples were analyzed by gas chromatography in an Agilent 3000 Micro-GC instrument, equipped with a thermal conductivity detector (TCD), a molecular-sieve 5A column of 10 m×0.32 mm with Argon 5.0 carrier gas, and a column PLOT U of 8 m×0.32 mm with Helium 5.0 carrier gas. In the samples, the hydrogen (H2), oxygen (O2), nitrogen (N2), methane (CH4), monoxide, and carbon dioxide (CO, CO2) concentrations were quantified. The temperature of the injector was of 60 °C and 80 °C for the column, and the pressure was of 206.8 kPa.
The MDP was obtained as the product between the hydrogen content and the gas volume per day, which was recorded with a Metrex G2.5 gas meter with a precision of 0.040 m³ h-1 and a maximum pressure of 40 kPa. CHP was the sum of the daily hydrogen production. In addition, four process indicators were defined as follows: productivity (HP, LH2 Lwaste -1 d-1), specific production regarding the substrate (SPS, LH2 kgwaste -1), specific production regarding the volatile solids (SPVS, mL H2 gVSadded -1), and specific production according to the decrease of contaminant load (SPC, mL H2 gCODremoved -1 ). For these calculations, the maximum daily hydrogen production was taken and divided between the volume of the substrate used, the mass of the substrate, the volatile solids added and the difference between the iCOD and the fCOD, to obtain the respective indicators.
For MHC, MDP and CHP non-linear models were obtained using multiple regression, whose coefficients were determined by least squares. The Stepwise method was used to reduce the models by eliminating some of the low significance terms (Myers et al., 2009). Then an analysis of variance (ANOVA) was performed, where an F test was used to determine the significance of the models and the P-value (<0.05) to obtain the statistical significance of their terms. The coefficients of determination, R2, R2 adjusted, and R2 prediction were obtained to analyze the fit of the models and its predictive capacity. Additionally, the assumptions of the models were checked through a residue analysis where their normal distribution, the constant variance of the error, the identification of outliers, the influence of the tests through Cook's distances, Leverage values, difference in the fit (DFFITS), and in the coefficients (DFBETAS) were verified.
The Design Expert 9.0® software was used to obtain the models and then optimize them using two methods. One was a numerical method of step-by-step ascent, which progress is a function of the regression coefficients, and the other was a graphic method based on the maximization of the desirability function (Equation 1). The graphic optimization included the superposition of multiple response surfaces to find a region where the three dependent variables are optimized (Myers et al., 2009).

Where:
RESULTS AND DISCUSSION
Hydrogen production in experimental tests
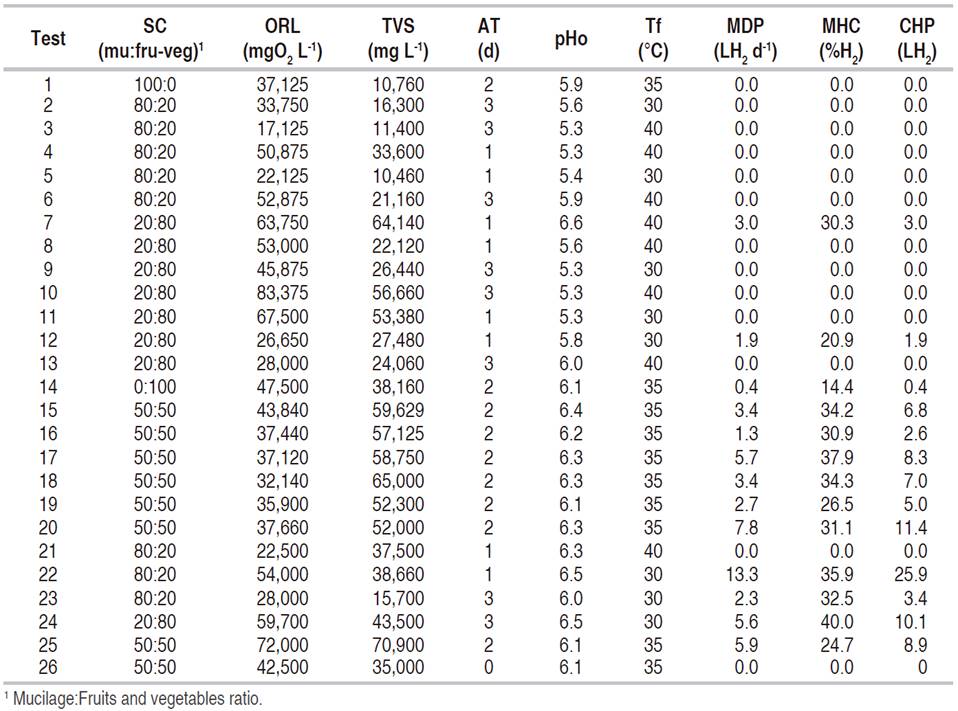
Table 1 shows the results for the dependent variables. Test 22 stands out because in it the maximum daily and cumulative hydrogen production is twice as high as the next value. However, the highest hydrogen content in the gas was recorded in test 24.
Mathematical models obtained by regression
Regression models and analysis of variance.Table 2 shows the variance analysis for the three dependent variables with the significant terms, their coefficients, the significance of the models, and the coefficients of determination. All the models were significant; the variation around the mean explained by the models was acceptable with values of determination between 81.8% and 90.8%. The variation described by the models, keeping in mind the number of terms, ranged between 67.6% and 81.2% (R2 adjusted). Meanwhile, the variation explained by the models for new data (R2 prediction) varied between 41.5 and 66.9%, which could indicate that there is a difficulty to estimate some values accurately, in sectors of the analysis space.
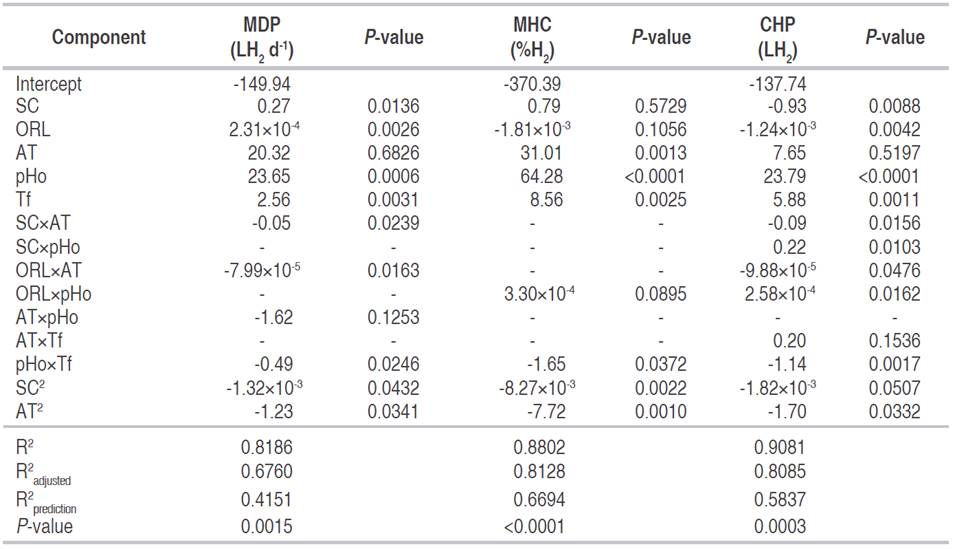
In MDP and CHP, the variables SC, ORL, pHo, and T showed a significant effect. In the MDP the interactions between SC and AT, ORL and AT, and pHo and Tf were significant with negative coefficients, these indicate that if both of them increases, the daily hydrogen production will decrease. In the CHP, the interactions between SC and AT, SC and pHo, ORL and AT, ORL and pHo, and pHo with Tf were equally significant. The positive coefficients for the interactions SC-pHo and ORL-pHo indicate that an increase in them generates an increase in the cumulative hydrogen production. In MHC, AT, pHo, Tf, and the interaction between pHo and Tf had a significant effect. The latter with a negative coefficient, therefore if both increase, the MHC decreases. In the three dependent variables, the quadratic terms of the SC and the AT are significant with negative coefficients.
Regarding the independent variables, when the substrate was composed of a single type of waste, the hydrogen production was a very low or nothing at all (test 1 and 14), in turn, the highest values recorded were in test 22, with an SC of 80:20. Hernández et al. (2014) reported the generation of hydrogen with fresh coffee mucilage in co-digestion with pig manure in a 50:50 ratio. Angeriz-Campoy et al. (2015) found that hydrogen production improved when organic municipal solid waste and food waste were used. Tawfik and El-Qelish, (2014) indicated that in co-digestion when passing from a mixture of 1:2 to 1:3, the hydrogen production doubled. The highest hydrogen production under co-digestion can be associated with: a better balance of nutrients, a better carbon/nitrogen ratio, an increased in the biodegradable load, the dilution of toxic substances, the synergistic effects of microorganisms, and a better buffering capacity of the pH (Sreela-or et al., 2011; Zhou et al., 2013; Tyagi et al., 2014; Elsamadony and Tawfik, 2015).
The production of hydrogen decreased when ORL was lower than 30,000 and higher than 70,000 mgO2 L-1 and increased for values between 37,660 and 59,700 mgO2 L-1. These results are consistent with the ones reported by Moreno et al. (2013) and Cano (2015), using fruits and vegetable waste. Srikanth and Venkata Mohan (2014) and Elsamadony and Tawfik (2015) stated that if the ORL decreases, there is a smaller amount of food for bacterial growth; however, an excessive increase can generate inhibition by the accumulation of volatile fatty acids, lowering the pH and interrupting the hydrogen production. Additionally, the inhibition may occur due to high concentrations of ammonium, generated by compounds present in the municipal organic solid waste (Jiang et al., 2013, Zahedi et al., 2013, Hidaka et al., 2015).
The highest hydrogen generation was reached at a pHo of 6.5, 30 °C, and 1 day under acidic conditions. There was no production at a pHo lower than 5.8, a similar situation to the reported under mesophilic conditions and with organic solid waste by Choi and Ahn (2014), Dareioti et al. (2014), and Cano (2015). When the temperature was set at 40 °C, only there was hydrogen production for an organic load higher than 60,000 mgO2 L-1. In fermentations with organic solid waste, temperatures higher than 39 °C produce enzymes denaturation and higher than 41 °C, produce the death of microorganisms (Laothanachareon et al., 2014; Arimi et al., 2015; Ghimire et al., 2015). In general, all the independent variables presented significance in the models; however, pHo and AT had the highest coefficients, especially the pHo. The pHo is very important to hydrogen production by fermentation; variations in the extracellular pH can damage the plasma membrane of microorganisms and inhibit the enzymatic activity of hydrogenase (Robledo-Narváez et al., 2013, Dareioti et al., 2014).
Residual analysis
In MDP, MHC, and CHP, the normal probability compared to the internally studentized residuals showed a straight-line trend, verifying that the models fulfilled the assumption of the normal distribution of residuals. Regarding the verification of the constant variance of the error, the externally studentized residual compared to the estimated values did not show a defined pattern, with randomly distributed estimates and verifying the constant variance in the error. In the verification of atypical results (outliers), the externally studentized residual showed that only the hydrogen content in test 23 was considered atypical. This result prompted its verification, but no anomalies were found in it, preserving its value.
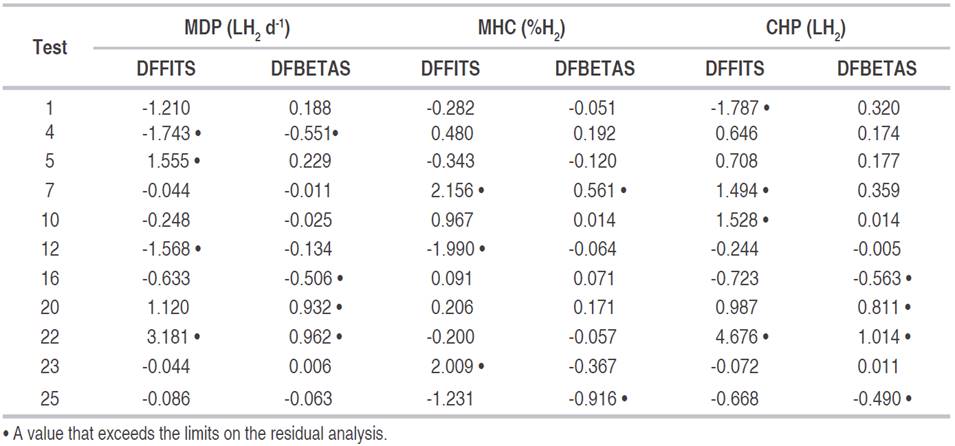
In the influence analysis of the dependent variables of the tests, the Leverage distance value was lower than one (1) in all the variables; thus, all the tests were relevant in the fit of the models without any of them been highly infIuential. In Cook’s distance, only the CHP variable in test 22 was superior to one (1), indicating that it could be an atypical case; however, it was not infIuential since its Leverage was lower than one (1). Regarding the DFFITS indicator, eight tests were outside the desired range, having a greater incidence in the prediction of the models. Likewise, six tests had a DFBETAS value outside the desired range, having a higher incidence in the regression coefficients (Table 3).
Analysis of process indicators
The process indicators show that hydrogen production was associated with the removal of the organic load (reduction of COD and TVS). The high values obtained in HP, SPS, SPVS, and SPC, especially in test 22, indicate that a significant amount of the substrate was used in the production of hydrogen. This implies greater use of the carbon and energy sources, contributing to the efficiency of the process (Table 4). The high transformation of organic matter into hydrogen in a mixed culture, like the one used in the present work, may be due to the presence of high-performance bacteria on the appropriate conditions, or to the synergic work of bacteria that consume the different organic fractions of the substrate (Mohanakrishna et al., 2011; Robledo-Narváez et al., 2013; Chinellato et al., 2013; Reungsang et al., 2013; Choi and Ahn, 2014; Yang et al., 2019).
Table 4 Results of the process indicators for the experimental tests where there was hydrogen production.
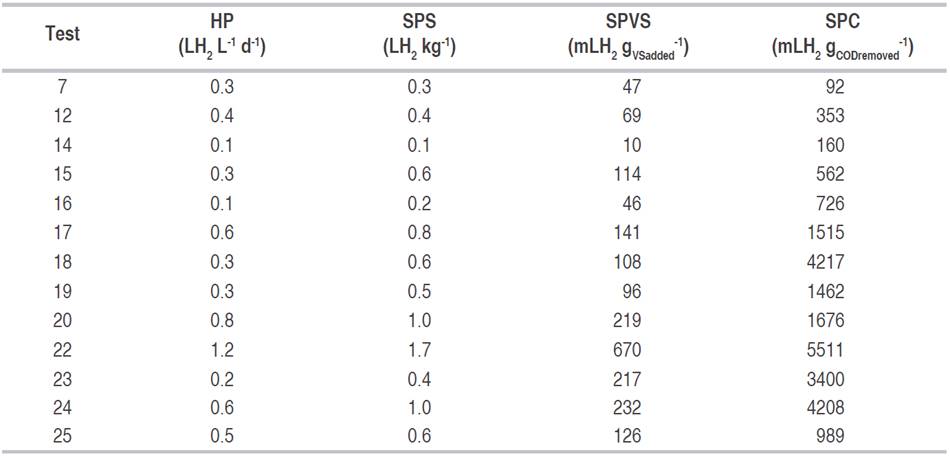
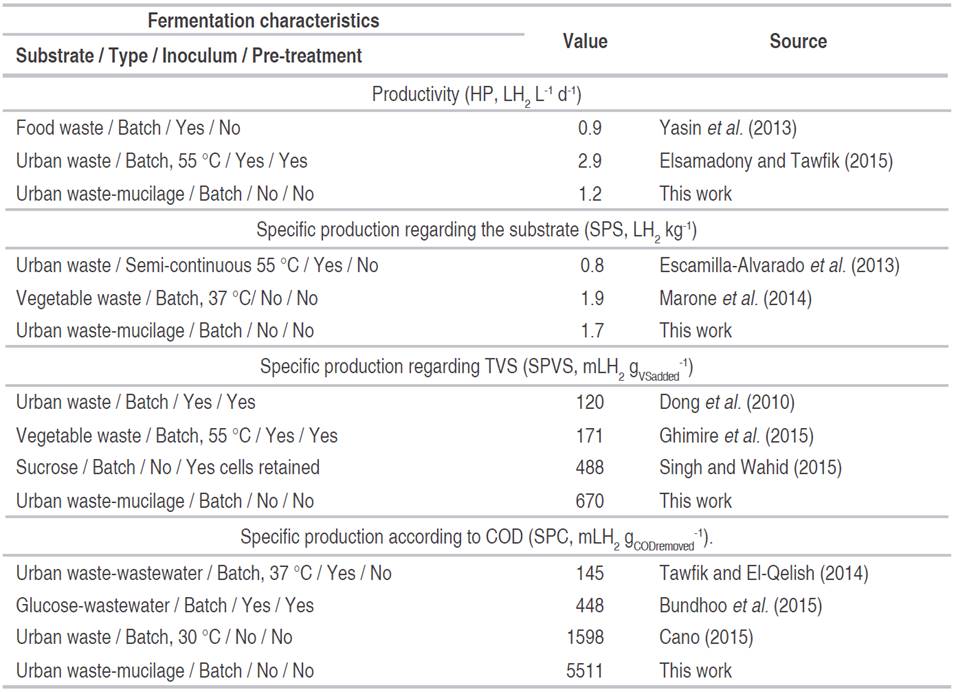
The maximum values obtained in the present work, for the four indicators analyzed, are comparable to those reported when organic waste has been used in thermophilic conditions (between 55 and 60 °C, with negative energy balance), in reactors in semi-continuous mode, continuous, use of inoculum and pre-treatment (Table 5). In the current research, no inoculum was added, and no sterilization process was performed; this means that the microorganisms native to the waste were used (substrate without pretreatment). This implies that this type of bioprocess is simpler, faster, and with a lower energy requirement (operation at 30 °C), thus increasing its potential as a hydrogen generation method.
Optimization of the models obtained by regression
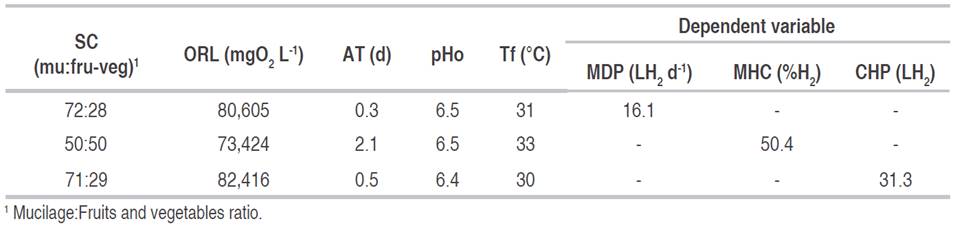
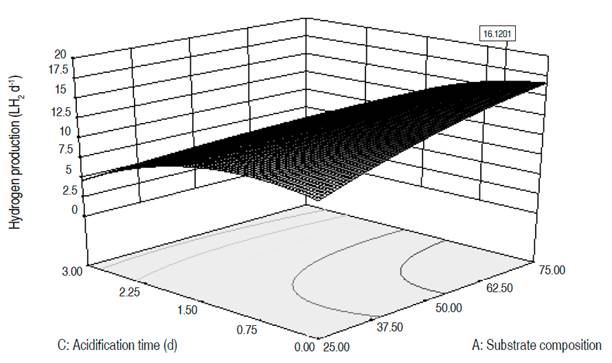
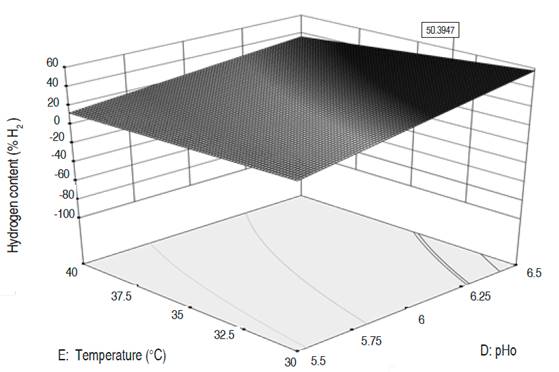
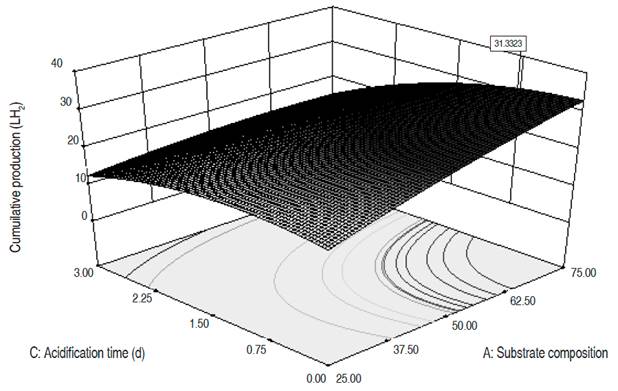
Numerical optimization. The three dependent variables were optimized, reaching higher values than those obtained during the experimental phase (Table 6). The MDP went from 13.3 to 16.1 LH2 d-1, the MHC from 40% to 50.4% and the CHP from 25.9 to 31.3 LH2. The optimal values for the MDP and CHP are reached for an organic load around 80,000 mgO2 L-1, a substrate composition close to 70:30, a pHo of 6.5, a temperature of 31 °C and an AT between 6 and 12 hours. These conditions, except for the ORL, are close to the ones in test 22, where the highest values for MDP and CHP were obtained. To reach the maximum hydrogen content in the gas, the temperature, pHo, and ORL values must be similar to the aforementioned for MDP and CHP, while the AT is of 2 days, and the substrate composition must be 50:50. The response surfaces for the three optimized variables are presented in Figures 1, 2, and 3. The graphs correspond to the interactions that were significant in the variance analysis. The figures show that the MDP and CHP increase as the AT decreases and the amount of mucilage becomes higher than the amounts of fruits and vegetables (SC). Meanwhile, the hydrogen content in the gas increases when the temperature decreases and the pHo rises up to 6.5.
Table 6 Numerical optimization of the dependent variables and their corresponding value in the independent variables.
Graphical optimization. In the study space, the area that provided the highest values simultaneously for all three-response variables was identified (hatched zone in Figure 4).
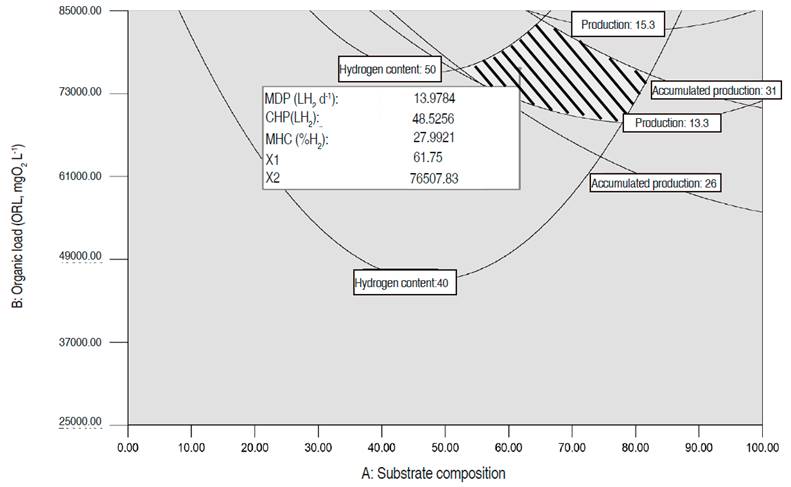
In this region, the MDP ranges between 13.3 and 15.3 L H2 d-1, the MHC between 40% and 50% and the CHP between 26 and 31 LH2. The area was obtained for an AT of one day, a pHo of 6.5, a temperature of 30.4 °C, an ORL between 68,000 and 83,000 mgO2 L-1, and an SC between 52:48 and 82:18. The values for the variables ORL, SC, AT, pHo, and Tf, are in accordance with those obtained in the numerical optimization for the three dependent variables. Both optimization methods show that for the three dependent variables the highest values are reached under mesophilic conditions (temperature of 30 °C), with a pHo of 6.5 and an AT of less than a day, which reduces the startup time of the production. The results are in accordance with the values reached in the experimental phase, and with those reported in other studies with organic waste in mixed culture, where the optimum production is reached with a temperature between 30.3 and 38 °C and a pH between 5.5 and 7 (Sreela-or et al., 2011; Nath and Das, 2011; Sekoai and Gueguim-Kana, 2013). Additionally, the results indicate that hydrogen production increases when the substrate includes both types of waste (co-digestion), instead of just one type. This is similar to that reported by other authors such as Hernández et al. (2014), Gomez-Romero et al. (2014), Angeriz-Campoy et al. (2015) and Elsamadony and Tawfik (2015).
CONCLUSIONS
Given the results obtained, it was concluded that it is possible to produce hydrogen and achieve high yields (1.2 L H2 L-1 d-1, 1.7 L H2 kg-1 of waste, 670 mL H2 gVSadded -1 and 5511 mL H2 gCODremoved -1) without using inoculum, without pre-treating the substrate, and under mesophilic conditions. Also, all the variables analyzed showed a significant effect on hydrogen production, being the operational pH (pHo) the most significant variable. The variables under study were adjusted to second-order polynomial models with coefficients of determination higher than 0.8186, and according to residual analysis, all the assumptions of the regression were fulfilled. Hydrogen production was successfully optimized when the substrate composition (SC) was between 68:32 and 83:17, the organic load (ORL) between 68,000 and 82,000 mgO2 L-1, the acidification time (AT) between 12 and 24 hours, the pHo of 6.5 and the temperature between 30 °C and 33 °C.

