


 Inglés (pdf)
 Articulo en XML
 Referencias del artículo
 Enviar articulo por email
 Citado por SciELO
  Citado por Google
  Similares en
SciELO
Similares en
SciELO  Similares en Google
 Permalink
In cereal crops, artificial selection has rapidly evolved, covering a wide range of technical and scientific activities, with the objective of developing varieties, with high yield potential, good adaptation, and end-use quality. Selection can be mono or multi-traits, early or late. Mono-trait selection is based on simply inherited traits such as earliness, plant height, and disease resistance. It is usually carried out early on F2, F3 up to F4 filial generations. For complex traits such as yield, accumulated biomass, and tillering capacity, it is practiced in advanced generations that are somehow fixed and have been subjected to single-trait selection in early generations for highly inherited traits. Selection effectiveness is largely dependent on the existing genetic variability among individuals making up the population under selection. Only the genetic part of the variability is transmissible to the offspring and is useful for selection. Selection efficiency is also dependent on the degree of genetic determination, which measures the proportion of genetic variability within the total phenotypic variability (Acquaah, 2007). Heritability represents the breeder’s ability to recognize the difference between individuals for a given trait and, therefore, the possibilities to improve this trait. High heritability values allow breeders to have a grip on the selected trait (Fellahi et al., 2017). In addition to phenotypic variability and heritability, selection efficiency also depends on the relationships among the traits. A better understanding of the existing relationships between traits is interesting and necessary to identify those which could serve as selection criteria and what are their effects on traits not targeted in the selection process. Yield is a complex quantitative trait whose variation is under polygenic control, predominantly of non-additive nature. It exhibits low heritability, instability and presents significant genotype×environment interaction (Purshase et al., 2000; Annicchiarico et al., 2005; Montesinos-López et al., 2018, Laala et al., 2018). Look for alternative methods and selection criteria to improve this trait efficiently is necessary (Bouzerzour, 1998). Indirect selection is an analytical method based on the use of morpho-physiological traits and yield components that are predictive of yield potential and good abiotic stress tolerance (Fleury et al., 2010; Reynolds and Langridge, 2016). Kumar and Bahl (1992) noted that indirect selection might be more efficient when the secondary trait is highly correlated with the primary trait (usually grain yield) and is easily measurable. This method involves several steps ensuring enough knowledge of the physiological mechanisms of drought tolerance followed by the genetic study of these traits before moving to their use as selection criteria in the breeding scheme. Index-based selection is currently used to make the selection more efficient (Carvalho et al., 1999). The index is, by itself, an additional trait, established through an optimal combination of several measured characteristics, for which simultaneous selection is sought, to improve overall population phenotypic values (Cruz et al., 2006). Several indices were developed, and are currently employed in various cultivated crops such as wheat (Ghaed-Rahimi et al., 2017; Fellahi et al., 2018), cotton (Ribeiro et al., 2018), popcorn (Lima et al., 2018), snap bean (Gomes et al., 2018), soybean (Bizari et al., 2017), potato (Silva G et al., 2018a), sugarcane (de Azeredo et al., 2017), and strawberry (Vieira et al., 2017). The use of index-based selection in genetic improvement of field crops helps breeders for selecting genotypes that combine high yield potential and other desirable characteristics. This research aims at investigating the variation in expected genetic gains generated in response to mono-traits and index-based selection and to compare the efficiency of these selection strategies in advanced bread wheat (Triticum aestivum L.) populations.
MATERIALS AND METHODS
Plant materials and experimental design
The experiment counted with 602 genotypes, including 599 F4-breeding lines and three standard varieties. Breeding lines were developed through pedigree selection method, from 20 bi-parental crosses made between nine bread wheat genotypes. Controls were Rmada (Vee's/Bow's//Alondra's/Pavon's), Hidhab (HD1220/3*Kal/Nac), and El-Wifak (K134/4/Tob/ Bman/Bb/3/Cal/5/Bucc), which are registered as varieties. Plant material was grown, during the 2014-2015 cropping season, in the experimental field of the Algerian National Institute of Agronomic Research (INRAA), Research Unit of Setif (INRAA-UR Setif, 36°15’N; 5°87’E; 1,081 masl). The experiment was arranged in a Federer augmented block design (Federer, 1955). Each of the three blocks contained 200 breeding lines and three controls. The experimental plot is a single 1-m long row, spaced 0.2 m apart, having 0.2 m2 area. Land preparation was carried out according to the recommended practices for the area. Before sowing, 100 kg ha-1 of 46% superphosphate fertilizer was applied. Granstar [Tribenuron methyl] herbicide was used to control weeds, and, when necessary, weeds were removed manually to keep the crop clean. At the tillering stage, plots were fertilized with 75 kg ha-1 of 35% urea. As April rainfall was almost nil (6.8 mm), and to avoid crop failure, the experiment was irrigated thrice during the May -June period, adding 60.0 mm irrigation water to the 343.6 mm rainfall received during the crop cycle (September-June).
Measurements
The following traits were assessed: FIag leaf chlorophyll content (CHL, Spad) was measured at the heading stage with SPAD-502 chlorophyll meter (Minolta Camera Co., Osaka, Japan). Canopy temperature (CT, °C) was determined at the same growth stage in each plot, between 11:00 h and 14:00 h, using a Sixth Sense LT300 infrared thermometer, following the procedure described by Pask et al. (2012). FIag leaf area (FLA, cm2) was determined according to the procedure established by Spagnoletti-Zeuli and Qualset (1990) as  , where L and l refer to the flag leaf length and width, respectively; 0.607 is the regression coefficient relating leaf area determined by the gravimetric method to leaf area determined by the L×l product. Heading date (HD, d) was recorded as the number of calendar days from January first to the date when 50% of the spikes were half-way out from the flag leaf sheath. Plant height (PH, cm) was measured at maturity from ground level to terminal spikelet tip, awns excluded. Above-ground biomass (BIO, g m-2) was estimated from a hand-harvested area of one row, 0.5 m long×0.2 m inter-row spacing. This sample also served, after mechanical threshing, to determine grain yield (GY, g m-2) and the number of spikes (SN, # of spikes per m2). Thousand kernel weight (TKW, g) was derived from the count and weight of a seed sample of 250 grains. The number of grains per spike (NGS, #) was derived from estimated values of grain yield, number of spikes and thousand kernel weight as
  where: NGP is the number of grains per plant, calculated by the equation:
  . Harvest index (HI, %) was obtained by the formula:
  .
.
Statistical analysis
Data collected were subjected to an analysis of variance (ANOVA) following the procedure outlined by Cruz (2006). The linear model for the analysis of the augmented block is:  where: Yij is the treat mean value for the ith treatment, which can be broken down into ci which is the effect of the ith control and gij which is the effect of the ith genotype in the jth block; βj is the effect of the jth block and εij is the residual associated with the ith treatment in the jth block. Fisher’s least significant difference test at 5% probability level (LSD5%) was calculated according to Steel and Torrie (1960). The phenotypic (σ2p), genotypic (σ2g), and environmental (σ2e) variances were calculated for each trait based on the expected mean squares derived from the ANOVA table. These variances served to calculate genetic and environmental parameters, including the variation index, which is the ratio
  , where Cvg is the genetic coefficient of variation, and Cve is the residual coefficient of variation. Broad-sense heritability was calculated according to Cruz (2006):
  where: σ2
g and σ2
p as defined above.
where: σ2
g and σ2
p as defined above.
Selection strategies and expected genetic gains
Three selection approaches were employed to estimate direct and indirect expected genetic gains among the F4 lines displayed through mono-trait and indices-based selection. Direct selection expected gain was calculated according to Cruz (2006):  where ∆Gi refers to the expected gain, Hi
2 is the broad-sense heritability; Si is the selection differential,
where ∆Gi refers to the expected gain, Hi
2 is the broad-sense heritability; Si is the selection differential,  is the mean value of the selected lines and
  is the mean estimate of the base population for the ith trait. Direct selection gain, was expressed as the percentage of the population mean, as follow:
  . Selection was done in the sense of increased values for each one of the measured traits, except for canopy temperature and days to heading for which decreasing mean value was targeted. Indirect selection gain was estimated as outlined by Cruz (2006):
  , where: GSj(i) refers to the jth trait gain, when the selection was based on the ith trait;
  is the mean value of the jth trait for the selected lines based on the ith trait;
  is the mean value of the jth trait;
  is the broad-sense heritability of the jth trait and is to the selection differential of the jth trait, in which the selected lines showed the best performance for the ith trait. Indirect selection gain is converted as the percentage of the population mean as follow:
  .
.
Expected gain was also calculated using Smith and Hazel (1943), Williams (1962), Pesek and Baker (1971), Subandi et al. (1973), Mulamba, and Mock (1978) and Cruz (2006) indexes. A value of one was adopted as the economic weight for all selection strategies applied. Among the 599 evaluated lines, the top15 breeding lines, for each selection approach, were identified. The coincidence coefficient was obtained through the ratio of double coincident lines between two selection approaches and the total of selected lines, in percentage. A high coincidence coefficient, between two selection approaches, indicated concordance of their results (Gomes et al., 2018). Statistical data analysis was done using Genes software (Cruz, 2013).
RESULTS AND DISCUSSION
Genetic variability and heritability
Even though the overall mean somewhat hid variability present among breeding lines, results of the analysis of variance revealed a significant genotype effect for plant height, above-ground biomass, grain yield, and harvest index at a 5% probability level. The residual coefficient of variation values (Cve) was below 17%, indicating a relatively good experimental precision (Table 1). Comparisons of range magnitude with critical value for yield components, and related agronomic traits, provide evidence of the presence of appreciable genetic variability among the breeding lines, suggesting that selection within these populations could lead to the identification of potentially useful breeding lines. Chlorophyll content varied from 33.5 to 58.3 Spad, canopy temperature ranged from 20.4 to 29.9 °C, heading date from 125.0 to 139 days, and flag leaf area from 7.3 to 42.7 cm. Plant height ranged from 45.0 to 121.0 cm, the number of spikes from 110.0 to 920.0 spikes per m2, while thousand-kernel weight varied from 30.0 to 61.0 g and the number of grains per spike from 10.8 to 63.6 grains (Table 1). Above-ground biomass ranged from 320.0 to 3,440.0 g m-2, grain yield from 102.0 to 1,434.0 g m-2 and harvest index from 14 and 61.3%.
Table 1 Analysis of variance results, overall mean, range, least significant difference (LSD5%), broad-sense heritability (H2 bs), coefficients of genetic (Cvg), and experimental (Cve) variation and the ratio of genetic to the residual coefficient of variation (Cvg/Cve) for the measured traits.
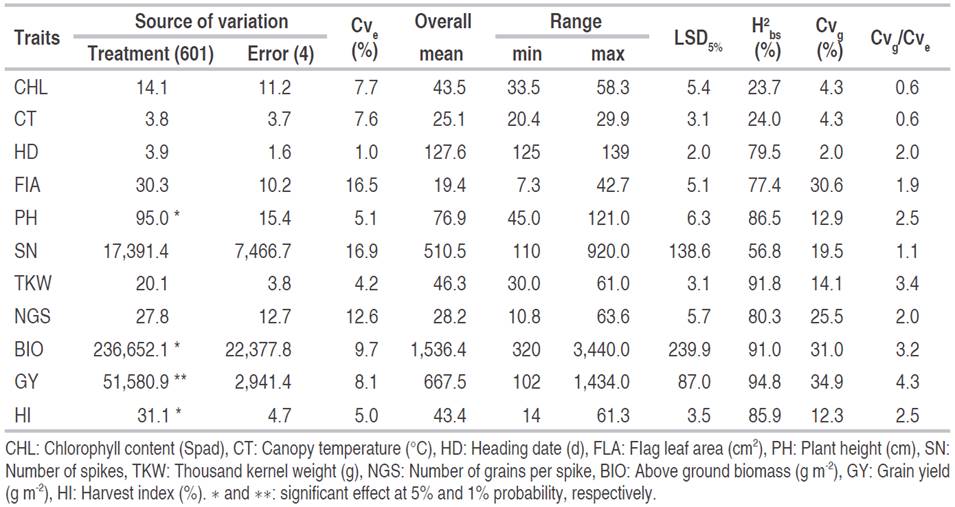
Broad-sense heritability estimates varied from 23.7 to 94.8% (Table 2). High H2bs values were recorded for grain yield (94.8%), thousand kernel weight (91.9%), biomass (91.0%), plant height (86.50%), harvest index (85.9%), number of grains per spike (80.3%), heading date (79.5%), flag leaf area (77.4%), and number of spikes (56.8%). This behavior suggests that the traits mentioned above are highly heritable, being less subjected to environmental variation. This is supported by the Cvg/Cve, ratio values which are greater than one, suggesting a good correlation between predicted and observed mean values for these traits, and favorable selection conditions for achieving high genetic gains. Chlorophyll content (23.7%) and canopy temperature (24.0%) showed low H2 b s estimates associated with Cvg/Cve ratio values below unity, indicating that both traits were subjected to a significant environmental effect. Genetic coefficient of variation (Cvg) values varied from 2.0% to 34.9%. High values were observed for flag leaf area (30.6%), spikes fertility (25.5%), biomass (31.0%), and grain yield (34.9%); indicating that these traits showed enough variability, which could be exploited through selection.
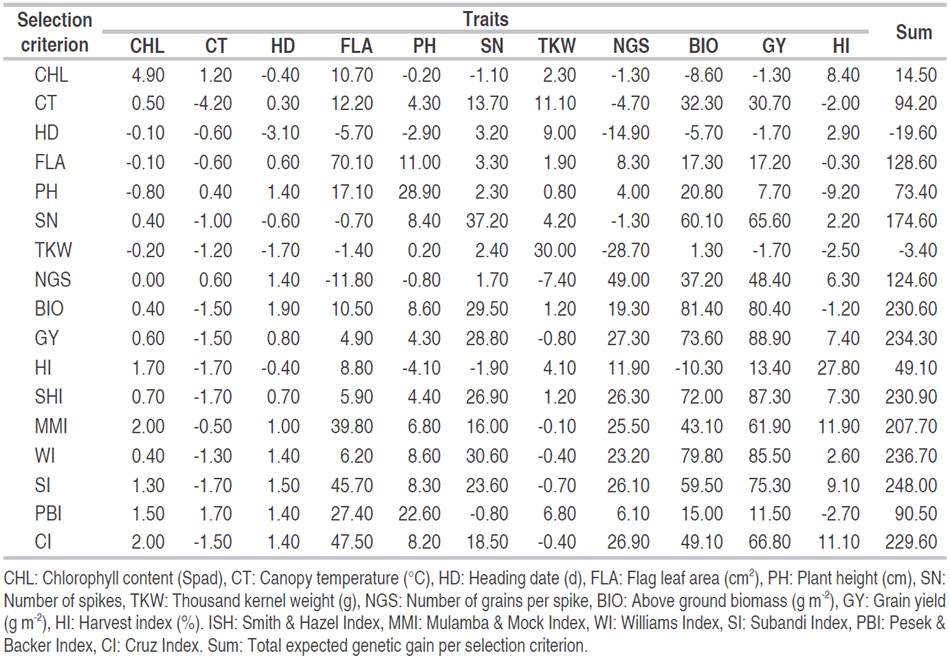
Expected genetic gains
Expected genetic gains, expressed as a percent of the base population mean, are presented in Table 2. Total expected genetic gains varied from -19.6% for selection based on the number of days to heading to 248.0% for selection based on the Subandi index. Expected genetic gains exhibited by direct selection for CHL, CT, and HD were lower than 5.0% for CHL (4.9%), CT (-4.2%), and HD (-3.1%, Table 2). CHL selection improved FLA indirectly by 10.7%, HI by 8.4%, and reduced BIO by -8.6%. CT selection caused significant improvement in FLA, SN, TKW, BIO, and GY, which increased by 12.2, 13.7, 11.1, 32.3, and 30.7%, respectively. HD selection induced significant changes in TKW, which gained 9.0%, NGS, FLA, and BIO, which decreased by 14.9, 5.7, and 5.7%, respectively. CH, CT, and HD expected genetic gains derived from indirect selection for FLA, PH, SN, NGS, BIO, GY, and HI were almost nil, being less than 2.0% and were lower than expected genetic gains caused by direct selection (Table 2). CHL and CT have low broad-sense heritability, while HD showed relatively weak variability, as suggested by its low Cvg value (Table 1). These results corroborated with those of Bárbaro et al. (2007), who found that larger gains are generated from characters exhibiting greater genetic variation while lower gains are expected from selection for traits showing lower genetic variability. Based on the mono-trait selection and among the three traits cited above, CT, with total gains of 94.2%, comes out as a surrogate trait to improve indirectly and simultaneously FLA, SN, TKW, BIO and GY without any significant changes for the other measured traits. Mono trait selection for any one of the following variables FLA, PH, SN, NGS, TKW, BIO, GY, and HI, generated higher direct expected genetic gains than indirect selection. In fact, the expected genetic gains from direct selection against the best expected genetic gains of indirect selection were 70.1% vs 47.5% via CI, for FLA; 28.9% vs 22.6% via PBI for PH; 37.2% vs 30.6% via WI for SN; 30.0% vs 11.1% via CT for TKW; 49.0% vs 27.3% via GY for NGS; 81.4% vs 79.8% via WI for BIO; 88.9% vs 87.3% via WI for GY; and 27.8% vs 11.1% via CI for HI (Table 2). These results corroborated those reported by Bizari et al. (2017), who found that gains from direct selection were superior to those for indirect gains, for all the characters. Cargnin et al. (2007) compared three selection indices in 240 F2:4 wheat families derived from eight segregating wheat populations and reported that the highest gains were estimated by direct selection. The advantage of multi-trait selection is analyzed based on total expected genetic gains. As total gains obtained from SHI, MMI, WI, SI, and CI selection indices were of the same magnitude as those generated through selection based on GY (Table 2).
Therefore, the comparison of mono vs. multi-trait selection efficiency was made relatively to selection based on GY. Analysis of indirect gains of mono-trait selection based on CHL, CT, HD, and FLA relative to GY based selection showed a strong negative effect of this selection strategy on GY, SN, NGS, and BIO (Figure 1). In fact, 49.0, 32.0, 49.0, and 39.0% reduction in GY expected genetic gain was observed when mono trait selection was based on CHL, CT, HD, and FLA, respectively. Observed declines in BIO expected genetic gains were 50.0, 25.0, 48.0 and 34.0% for the same selection criteria; NGS expected genetic gain was reduced also by 27.0, 30.0, 39.0 and 18.0%; while SN expected gain declined by 35.0, 18.0, 30.0, and 30.0%, respectively. These decreases indicated the inefficiency of these traits as a selection criterion, relatively to GY selection (Figure 1).
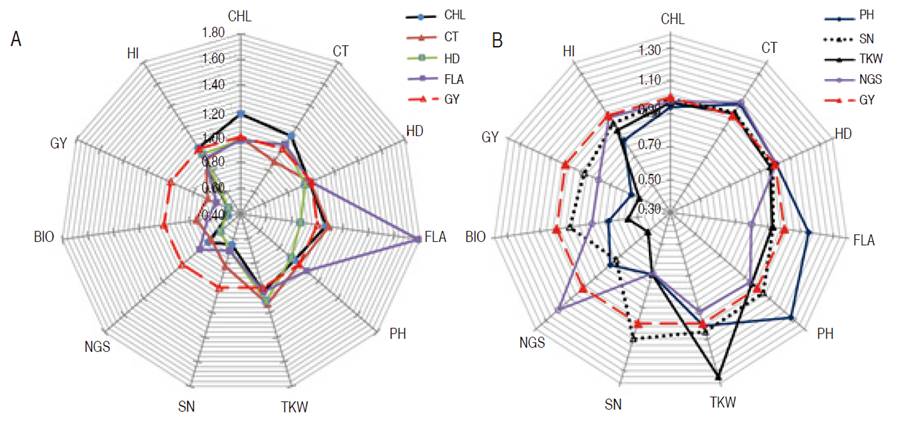
Figure 1 Direct and indirect gains of mono-trait selection based on A. CHL, CT, HD, and FLA; B. based on PH, SN, TKW, NGS, relatively to GY based selection.
Besides, their direct gain which was greater (27.0%, 10.0%, 34.0%, and 20.0% for PH, SN, TKW, and NGS, respectively) than indirect gain due to GY based selection, analysis of indirect gains exhibited by these traits indicated a sizeable negative effect on GY, BIO, and HI (Figure 1). Indirect gain due to selection based on PH declined GY, BIO, and HI by 44.0, 32.0, and 18.0%, respectively, and caused 31.0 and 22.0% reduction in NGS and NS, respectively. The indirect gain for TKW, caused by PH based selection was almost zero. Selection based on SN declined GY, BIO, and HI by 13.0, 8.0, and 6.0 %, respectively, and caused a 27.0% reduction in NGS. Indirect gains for PH and TKW, due to SN based selection, were below 5.0%. Selection based on TKW declined GY, BIO, and HI by 49.0, 44.0, and 11.0%, respectively, and caused a 52.0% reduction in NGS and 31.0% in SN (Figure 1). The indirect gain for PH due to TKW based selection, was low, having a 4.0% value. Selection based on NGS declined GY and BIO by 22.0% and caused a 32.0% reduction in SN and 7.0% in TKW. Indirect gains for HI, PH, and TKW from indirect selection based on NGS were 1.0, 6.0, and 7.0%, respectively (Figure 1). Because of negative indirect expected genetic gains, selection based on these traits appears to be inefficient when compared to indirect gains induced through GY based selection. Selection based on BIO resulted in almost similar direct and indirect gains as GY based selection, but HI based selection caused a significant gain decrease in NGS (14.0%), SN (36.0%), BIO (0.51.0%), and GY (41.0%, Figure 2). Analysis of the effect of index-based selection suggested that SHI and WI expressed equivalent results as GY based selection. Compared to GY based selection, MMI, SI, PBI, and CI index-based selection caused significant indirect gain increases, 20.0% to 52.0%, in FLA. MMI induced 15.0, 16.0, and 15.0% gain a decrease in SN, BIO, and GY, respectively. SI caused gain decrease value of 9.0 and 7% for BIO and GY while application of PBI appeared as the least efficient selection strategy among index-based selection, as it induced negative indirect gains in NGS (210%), SN (34.0%), BIO (36.0%), GY (42.0%) and HI (10.0%). CI-based selection, compared to GY based selection, decreased indirect genetic gain in SN (12.0%), BIO (15.0%), and GY (12.0%, Figure 2).
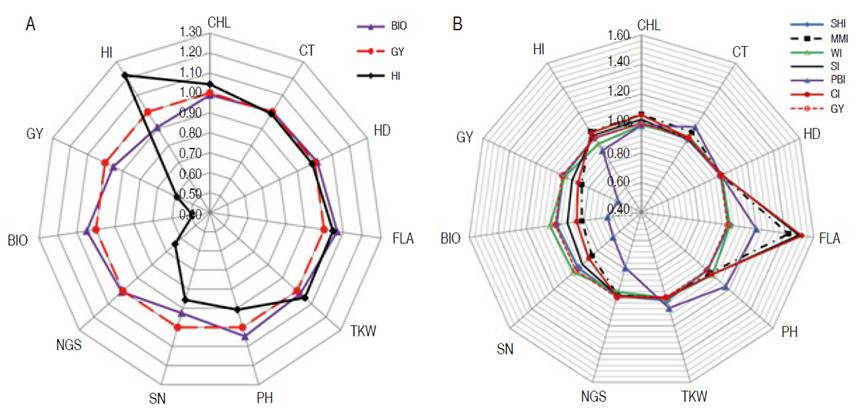
Figure 2 Direct and indirect gains of mono-trait selection based on A. BIO and HI; B. based on indices, relatively to GY based selection.
Globally, it can be said that index-based selection appeared to be more efficient than individual trait-based selection, but equivalent to GY based selection. In this context, Costa et al. (2008) reported that SHI and PBI indices were advantageous over direct selection for soybean grain yield. Index-based selection generated gains that are evenly distributed among all traits. This is useful since, in stressed environments, genotypes, bearing a combination of physiological and morphological traits known to influence positively plant performance, are desirable. In this study, SHI and WI expressed equivalent results as GY based selection, with positive gains for all traits included in the index. Using index-based selection Silva and Viana (2012), as well as Vasconcelos et al. (2010), found greater and well-distributed gains for the main characters of the passion fruit and alfalfa. In this study, the PBI index was the least efficient among the six evaluated indices. This index resulted in genetic variation loss in several important desired traits, exhibiting negative indirect gains. This contrasted with the results of Cargnin et al. (2007), who demonstrated that PBI exhibited the highest expected genetic gains. These authors reported that gains expected through indices selection for grain yield were larger than those obtained by the direct and indirect mono-trait selection, except for yield-based selection. Mahdy (1988) found that the selection-based index was more efficient for yield improvement compared to single-trait selection in a segregating population of wheat. Silva B et al. (2018) found that SHI provided high predicted gains for all the assessed traits in elephant grass. Ribeiro et al. (2018) found that MMI was the most suitable index for selecting high yielding genotypes with good fiber technological components in upland cotton. Bhering et al. (2012) reported that SI was promising for selection, providing balanced predicted gains for several traits of interest. According to Valério et al. (2009), as well as Fellahi et al. (2018), differences in the results of direct, indirect selection and index-based selection depend on crosses background, targeted selected traits and genotype×environment interaction.
The results of the present study indicated, so far, that SHI and WI index-based selection was advantageous to obtain sizeable gains distributed among several desired traits, without significant gain loss in the principal trait. This selection strategy is useful when a breeder focused on developing plant ideotype. The results indicated that high expected genetic gains were observed from single trait selection. This is useful to identify genotypes carrying interesting genes, like those related to stress tolerance (i.e., canopy temperature), which are often weakly associated with the principal trait (i.e., grain yield). Such genotypes could be used in biparental crosses to increase genetic variability and to accumulate favorable genes in elite advanced breeding lines. The coefficients of coincidence values ranged from 0 to 86.7%, being low for direct selection based on CHL, HD, FLA, and PH, which resulted in few lines selected simultaneously, and high for yield, yield components, and index-based selections, excluding PBI index. None of the lines selected for GY were found among those selected for CHL, HD, FLA, PH, and PBI. The highest coincidence coefficients were recorded for WI (86.7%), SHI (80.0%), and BIO (66.7%), suggesting outcomes likeness of selection based on GY, SHI, WI and to lesser extend on BIO.
Characterization of the potentially high yielding breeding lines
In order to identify the most promising genotypes for grain yield, all the selected lines through different methods were scored according to their appearance frequency. The scoring results indicated an absolute frequency ranging from one to eight. The top 15 breeding lines (Lines number 11, 55, 59, 60, 99, 150, 159, 160, 180, 182, 189, 285, 300, 521, and 558), with a score equal or greater than 4, were retained. These lines descended from nine out of twenty bi-parental populations studied by Fellahi et al. (2018). Compared to the average of the control varieties, the relative changes brought by the top 15 lines are shown in Figure 3. Significant improvements were achieved for FLA (26.22%), PH (14.62%), NGS (20.31%), BIO (38.99%), GY (44.04%), and CT (-14.53%). These differences were 1 to 4 times higher than LSD5%. These results indicated that the effective selection of superior individuals within this plant material contributes certainly to the improvement of yield and its related traits under conditions in the semi-arid regions of the Algerian high plateaus. Based on the Euclidian distance, Ward’s method, these breeding lines formed three clusters (Figure 4).
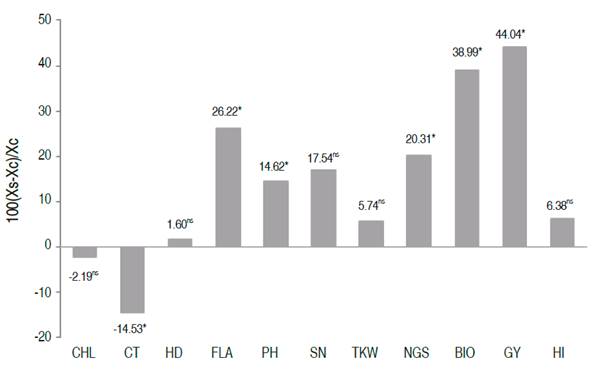
Figure 3 Relative deviation of the average of the 15 retained lines (XS) from the average (XC) of the three control varieties [100×(XS-XC)/XC)] for the assessed traits.
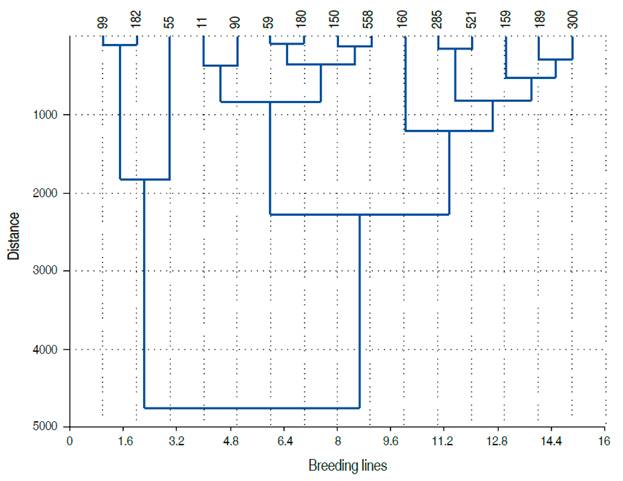
Lines 11, 59, 90, 150, 180, and 558 clustered apart (cluster 1). Lines 55, 99, and 182 formed cluster 2; while lines 160, 285, 521, 159, 189, and 300 grouped in cluster 3. The average values per cluster (absolute value and expressed as % of maximal value) indicated that FLA, BIO, GY, and TKW and HI discriminated efficiently between clusters (Figure 5, Table 3).
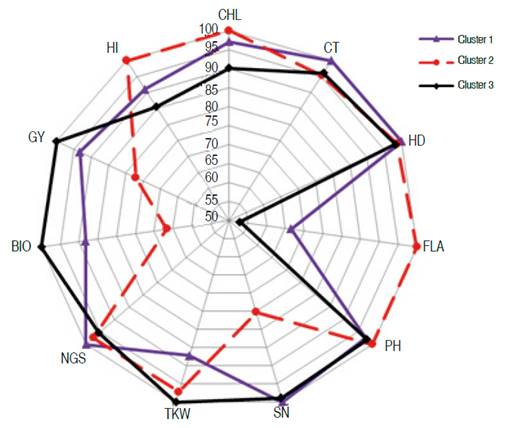
Figure 5 Behavior of the three clusters for the eleven measured traits in the top 15 selected lines.
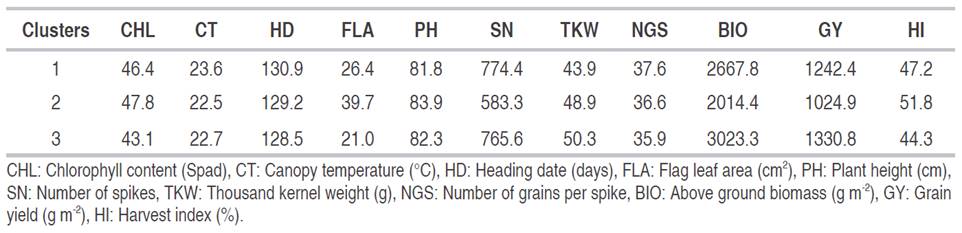
Genotypes belonging to cluster 3 had the best values in terms of yield performance, biomass and grain weight with a short vegetative cycle, low chlorophyll content, small leaves, and lower spike fertility compared to the genotypes of clusters 1 and 2. Lines of cluster 2, which had larger leaves with high chlorophyll content and decreased canopy temperature, were taller, less performing with increased harvest index. On the other hand, genotypes of cluster 1 were later, shorter with increased canopy temperature and fertile tillers. They were also characterized by low grain weight compared to the genotypes of clusters 2 and 3 (Figure 5).
CONCLUSION
Heritability estimates were sufficient for the prediction of next-generation means when the plant material selected is under the same environmental and management conditions. The results pointed out that those high expected genetic gains were observed from single trait selection, suggesting possibilities to identify genotypes carrying interesting genes, which are often weakly associated with grain yield. However, index-based selection was more efficient over the above approaches employed. Indeed, Smith and Hazel index and William index expressed equivalent results as grain yield based selection and provided the most satisfactory gains in all traits studied. The coefficients of coincidence values were low for direct selection based on chlorophyll, heading date, flag leaf area, and plant height, which resulted in few lines selected simultaneously, and high for yield, yield components, and index-based selections, excluding Pesek and Baker index. Cluster analysis grouped the 15 best-selected lines in three divergent groups that discriminated clearly for flag leaf area, thousand kernel weight, biomass, and harvest index.

