


 Inglés (pdf)
 Articulo en XML
 Referencias del artículo
 Enviar articulo por email
 Citado por SciELO
  Citado por Google
  Similares en
SciELO
Similares en
SciELO  Similares en Google
 Permalink
Potato cultivation is one of the most widespread agricultural activities in Colombia. Its production is distributed in 283 municipalities, mainly in the departments of Cundinamarca, Boyacá, Nariño, Antioquia, Santander, Norte de Santander, Cauca, Tolima, and Caldas, with a share of 3.3% in the national Gross Domestic Product. For the year 2017, 169,002 ha were reported with a production of 3,740,000 t. Its cultivation benefits 110,000 families and generates 75,000 direct jobs and 189,000 indirect jobs (Fedepapa, 2017). The 94% of the production is consumed mainly as a fresh product and 6% is used in industry (Agronet, 2019).
The potato is one of the most genetically diverse cultivated species, with diploid, triploid, tetraploid and pentaploid species, the vast majority is found in the Andean zone of South America. In the Andes, the genus is represented by eight cultivated species and about 200 wild ones. The rich diversity of the cultivated species is included in a polyploid series (2n=24, 36, 48, and 60 chromosomes), which includes 4,000 edible varieties, with high genetic potential for yield and broad adaptability to different climates, which has allowed it to become one of the most important crops of the world diet (Estrada et al., 2000).
However, the crop is subjected to different biotic and abiotic stresses that threaten its sustainable development. In this sense, one of the main biotic stress in the field, not only in Colombia but worldwide, is the late blight caused by Phytophthora infestans (Mont.) of Bary. It is a pathogen belonging to the Oomycete class, in the Chromista kingdom and phylogenetically related to Diatoms and brown algae. This fungus has a rapid development in high humidity conditions and can survive for days or even weeks, although its sporangia cannot withstand freezing temperatures. The main strategy adopted by farmers to control this pathogen is the application of fungicides, a practice that has represented between 10 and 29.9% of production costs (Juyó et al., 2011).
One of the alternatives for solving the biotic problems of crops is finding cultivars with genetic tolerance, which can be integrated into chemical control to reduce the use of fungicides, decrease the cost of production, and decline the damage to human health and the environment. Obtaining tolerant cultivars to late blight can provide additional protection to the crop over time, reducing the risk of losses from the disease and/or the costs of chemical control in each crop cycle (Muñoz et al., 2019).
In the case of P. infestans, researches have been carried out in various fields from conventional breeding, biotechnology, molecular marker assisted breeding to genetic transformation. Cristinzio and Testa (1999), used the technique of plant electrolyte exudation caused by the filtering of the pathogen culture to detect genetic tolerance under in vitro conditions of 10 potato cultivars to P. infestans with eight strains. Electrolyte leakage was used to screen leaf and tuber tissues with fungal culture filtrates. Under the leaf or tuber trials with almost all cultivars there were statistical differences in susceptibility, while leaf tolerance did not correlate with tuber tolerance. The Ajax variety was the least susceptible in the leaf and tuber tests, while Prima was the most susceptible in the tuber tests.
One of the indications of tolerance to P. infestans in potato cultivars is the presence of tolerant genes R1 and R2. Díaz et al. (2003) evaluated different genotypes of S. tuberosum group Tuberosum according to their tolerance to P. infestans and the molecular detection via PCR (Polymerase Chain Reaction) of R1 and R2 genes. The results showed a strong phenotypic and genotypic correspondence regarding the presence of R1 and R2 alleles in the different potato genetic materials containing one or another allele.
In the field of traditional breeding, in Southern and Central American countries, germplasm evaluation has been carried out and methods of inter- and intraspecific crosses, backcrossing and recurrent selection have been used to obtain more productive cultivars with tolerance to P. infestans (Gabriel et al., 2001; Barquero et al., 2005; Solano et al., 2014). In Colombia, Rodríguez et al. (2009), obtained three new varieties of creole potato registered as Criolla Latina with yields between 18 to 20 t ha-1, Criolla Paisa with yields of 22 to 25 t ha-1 and Criolla Colombia with yields of 13 to 15 t ha-1. The first two were reported with moderate tolerance to P. infestans, while the latter was reported as sensitive to this pathogen.
According to the above mentioned authors, it is necessary to increase the probability of finding long-lasting tolerance and to do so, the genetic base of tolerance should be broadened, based on the evaluation of the available germplasm in breeding programs being developed by institutions such as the University of Nariño and the National University of Colombia; in addition, sources of tolerance should be sought in wild germplasm (Forbes and Huarte, 2014) in order to improve traditional varieties, which are generally susceptible to late blight. Therefore, the objective of this study was to select genotypes of guata potato Solanum tuberosum group Andigena by their tolerance to the natural inoculum of Phytophthora infestans (Mont.) of Bary, under conditions of Pasto, South of Colombia.
MATERIALS AND METHODS
Plant material
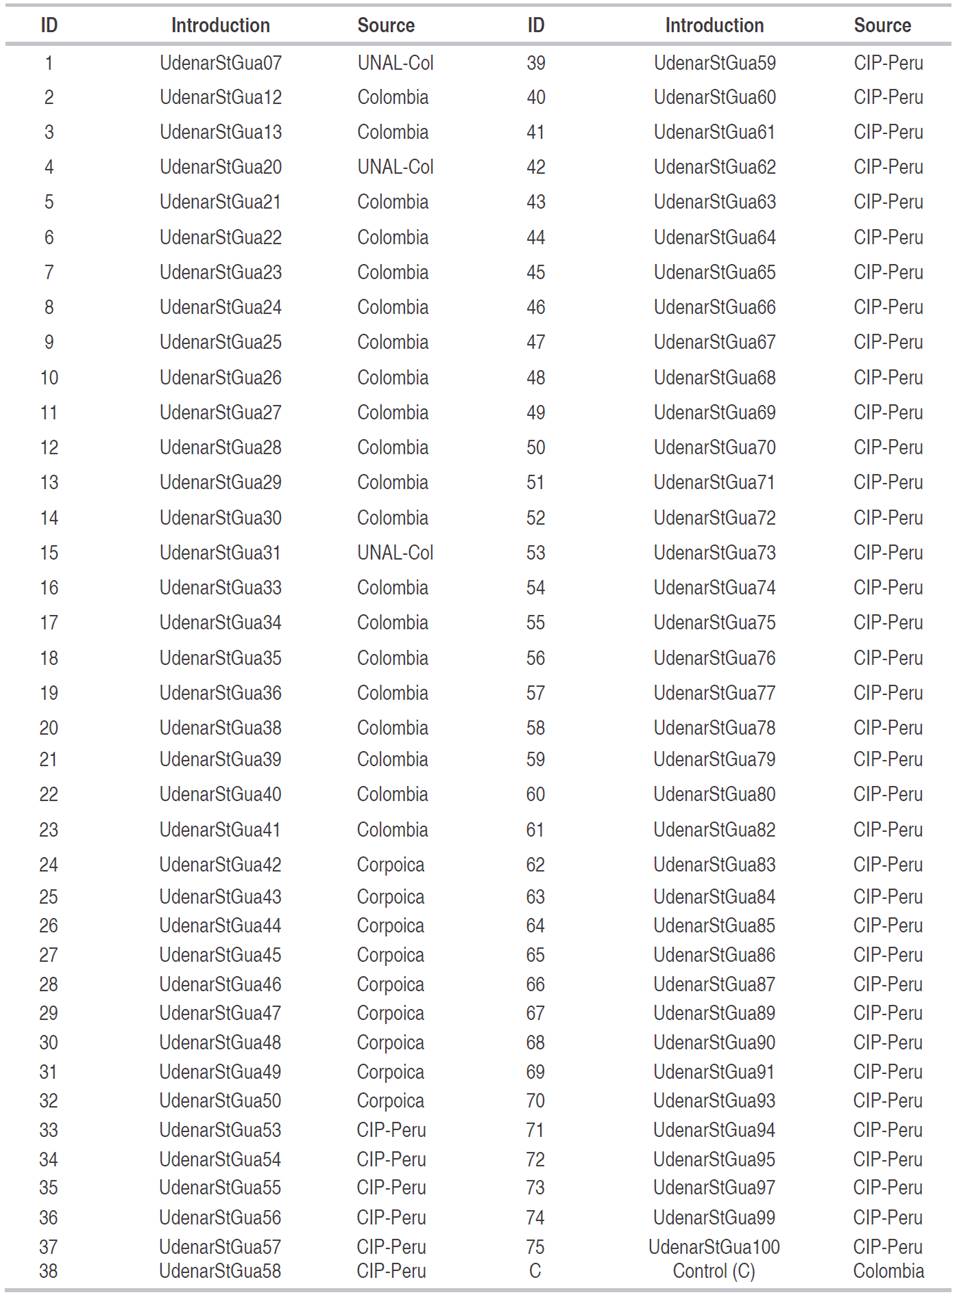
As genetic materials, 76 potatoes were used (Table 1), of which 43 were introduced from the CIP-Peru on July 18, 2016; 21 belong to the working collection of the University of Nariño (UDENAR), three were procured from the National University of Colombia, Bogotá (UNAL) and correspond to the improved varieties Betina, Única and Pastusa Suprema, and nine were obtained from the Central Colombian Collection under the responsibility of AGROSAVIA (Colombian Agricultural Research Corporation). Of these populations, the genetic material susceptible to late blight P. infestans was the variety Capiro (Monsalve-Fonnegra et al., 2012), while Betina is moderately tolerant and Pastusa Suprema is highly tolerant (Ñustez, 2019). These varieties were used as controls of susceptibility and tolerance at field level.
Location
The experiment was carried out in Botana Experimental Farm of the University of Nariño, located at 2,820 masl, 1°09'28.3" NL and 77°16'29.5" WL, with a relative humidity of 82%, average temperature of 12 °C and a rainfall of 800 mm. The area is climatically classified as a low mountain rainforest, with sandy clayey Andisol soils (IDEAM, 2016).
Experimental arrangement
The evaluated genotypes were arranged in a total experimental area of 581 m2, with a distance between furrows of 1.2 m and distance between plants of 0.4 m with previous application of lime and organic matter, for a planting density of 20,833 plants ha-1. The area of the plot was 1.44 m2. Each genotype was randomly located in each plot, which contained three plants. The Capiro introduction was established as a susceptible variety and it was the source of the inoculum. This variety was planted in each five plots. Every seven days, insecticides such as Tiametoxam+Lambdacihalotrina (2 cm3 L-1) and Profenofos+Cipermetrina (0.75 cm3 L-1) were applied. In addition, fungicides such as Carbendazim (1 cm3 L-1) and Difenoconazole (1 cm3 L-1) were applied, in order to protect plants from other pathogens and achieve uniformity.
The first edaphic fertilization was carried out at 20 days and the second one at 40 days after planting. It was applied 840 kg ha-1 of the formula 10-30-10 per plant. Additionally, periodic applications were made with foliar fertilizer in doses of 5 cm3 L-1.
Traits evaluated
In the vegetative phase, the number of stems and stolons per plant was recorded. Severity evaluations (SEV) of the disease caused by P. infestans were made every 14 days. At harvesting stage, yield values per plant and its components were recorded. The methodology for data collection of each of the traits is described below.
Number of stems per plant (NS). The number of stems per plant was counted and recorded for each plot.
Severity (SEV). SEV assessments were conducted from the first week of planting to 134 days of the crop cycle. In each plant of the plot, a leaf from the middle third was randomly marked, in which the periodic SEV evaluations were made. The scale proposed by Clive (1971) was used for the qualification of the leaf area affected by the presence of the pathogen (Figure 1). The scale proposes values of 1, 10, 25, 50, 75 and 100%. The higher SEV values, the higher the susceptibility of the genotype evaluated.
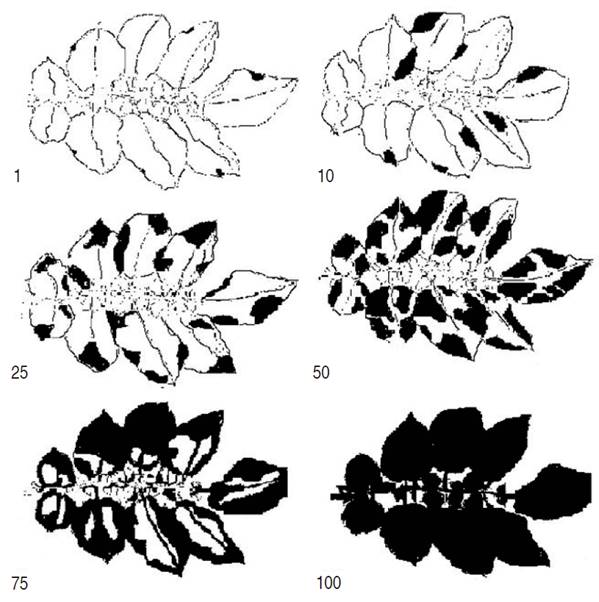
Figure 1 Clive's scale (1971) for the percentage of severity of P. infestans in S. tuberosum leaves, modified by Betancourth et al. (2008).
Area under the disease progress curve (AUDPC). The AUDPC is a variable that estimates the amount of disease throughout the crop cycle. It is calculated using Equation 1 proposed by Campbell and Madden (1990):
Where: t=time of each reading, Yi=percentage of foliage affected in each reading and n=number of readings.
Relative area under disease progress curve (rAUDPC). The rAUDPC value indicates the proportion of infected tissue during the evaluation period, so that genotypes with severity values of 100% showed rAUDPC=1. Low rAUDPC values indicate a low percentage of infection during the evaluation period. These values correspond to the most tolerant genotypes (Pérez and Forbes, 2008). The rAUDPC was calculated using Equation 2:
Where: rAUDPC=relative area under disease progress curve, AUDPCX i =area under the disease progress curve of the i-th genotype, t f=time of the last evaluation and t i=time of the first evaluation.
Rate of disease development (RD). The RD is a trait that measures the progress of the disease throughout the crop cycle. For its estimation, SEV reported in the first and last evaluation were taken as reference. The Equation 3 was used for the calculation of RD (Van Der Planck, 1963).
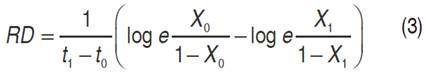
Where: RD=rate of disease development, X0=proportion of disease in the initial time, X1=proportion of disease in the final time, t0=initial time corresponding to the reading of X0 and t1=final time corresponding to the reading of X1.
Decrease in disease (dAUDPC). For the calculation of dAUDPC in percentage, the Equation 4 proposed by Andrade et al. (2016) was applied.

Where: AUDPCi =area under the disease progress curve of the i-th genotype and AUDPCt =area under the disease progress curve of the control variety.
Genotype Susceptibility Scale (GSS). The GSS was calculated based on the resistance, tolerance and susceptibility to late blight scale proposed by Yuen and Forbes (2009) using the Equation 5, having a susceptible cultivar as reference.
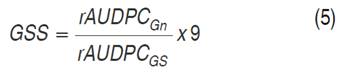
Where: rAUDPCGn: relative area under disease progress curve of the potato genotype (Gn) and rAUDPCGs =area under the relative disease progress curve of the potato genotype with the highest susceptibility (Gs) and 9=value assigned to Gs.
Yield (Yld). Based on the weight of the plot harvested over the number of plants in the plot, the Yld was expressed in tuber weight (kg) per plant.
Number of tubers per plant (NTu). The average Ntu was obtained based on the plants in the plot.
Number of stolons per plant (NSt). The average NSt was determined based on the plants in the plot.
Tuber weight (TW). The TW corresponds to the ratio of Yld to NTu.
Data Analysis
The Path Analysis (PA) was performed, for which the correlations between the traits Yld, NTu, TW, NS, NSt, SEV, GSS, RD, dAUDPC, and rAUDPC were obtained. Based on the correlation coefficients, the traits were determined. Using the Excel program, the path coefficients were obtained to establish the direct and indirect effects on the association between the Yld and the other causal traits.
Likewise, the traits evaluated were subjected to Principal Component Analysis (PCA) and Hierarchical Classification, taking into account that only one of the two highly correlated traits was included in these analyses, in order to group the genotypes evaluated by discriminatory traits, such as yield and disease severity. To test the null hypothesis (Ho) that the group mean is equal to the original population mean, the t-test, proposed by Stiles (2000) was used (Equation 6):
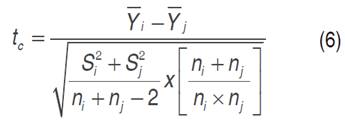
Where: t c=t calculated, =average of the variable in the i-th group, =average of the variable in the j-th group, S2i =variance of the i-th group, S2j =variance of the j-th group, ni=number of individuals in the i-th group and nj=number of individuals in the j-th group.
For the decision rule the t c was compared with the t t (t of the table with a α =0.05 and with degrees of freedom equal to ni + nj -2). If t c < t t Ho is accepted.
Subsequently, the best genotypes were selected based on a selection index (SI), whose weights were established according to the importance of the traits related to the Yld components and the disease. The first step was to standardize (S) the values of each of the traits that made up the SI (Lagos, 2015), using the Equation 7:
Where: Yi j =observation of the variable j-th in the introduction i-th, Y=overall average of variable j-th in the i-th introductions and SD=standard deviation of variable j-th in the i-th introductions. Then, for each introduction (Yi j ) the SI was applied, given by the sum of the products of the standardized value of each variable by its weight (W), as follows: Yld(0.6), SEV(-0.3), rAUDPC(-0.1), dAUDPC(0.5), GSS(-0.05), RD(-0.05), NSt(0.08), NS(0.07), NTu(0.1) and TW(0.15).
RESULTS AND DISCUSSION
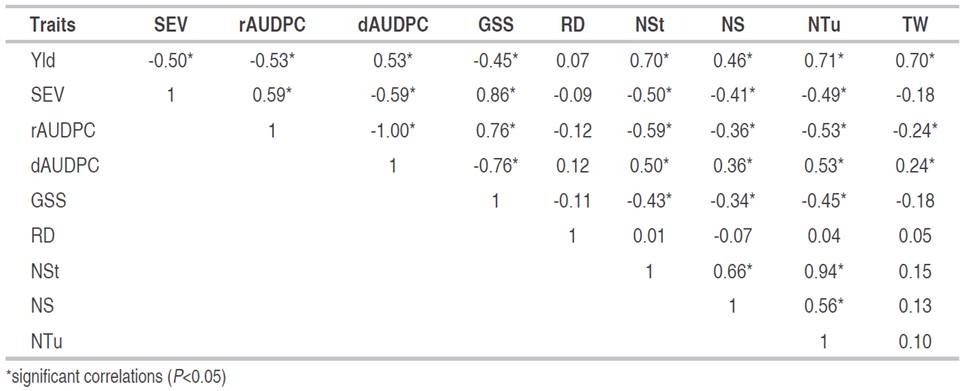
The Correlation Analysis for the 10 traits evaluated (Table 2), enabled to find a significant negative average association between Yld vs SEV (r=-0.50*) and Yld vs rAUDPC (r=-0.53*), indicating that the productive potential of the plants decreased due to the increase infection process caused by the pathogen. Yld vs NSt traits showed high positive association (r=0.70*) similar to Yld vs NTu (r=0.71*). This indicates that to improve Yld, it can be selected based on NSt and NTu.
Table 2 Correlation analysis for traits related to yield and reaction components to disease caused by P. infestans in 76 introductions of S. tuberosum group Andigena.
For the Yld vs NS, the correlation was 0.46* (Table 2), however, the PA showed that the most of this dimension is explained by the indirect effect (outside the diagonal) through NTu with a value of 0.34 (Table 3). The association between Yld vs TW showed a value of association r= 0.70* (Table 2). Similarly, the PA showed that the direct effects (on the diagonal and in bold) explained the greater proportion of the dimensionality of the correlation, with a value of 0.62 (Table 3).
Table 3 Path analysis (PA) for traits related to yield and disease response components caused by P. infestans in 76 introductions of S. tuberosum group Andigena.
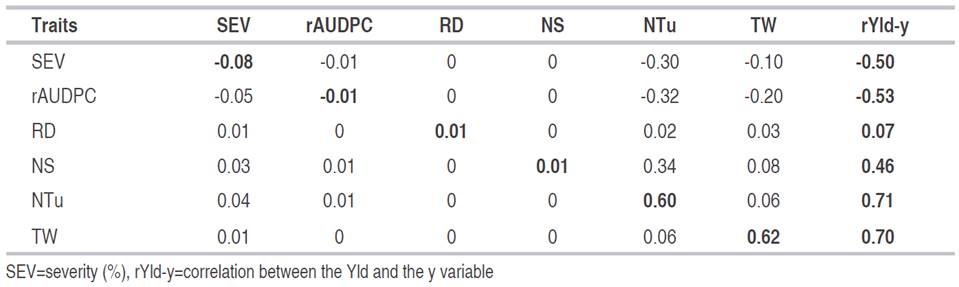
According to the PA in Table 3, the dimension of the correlations of Yld with SEV and rAUDPC is explained in greater proportion by the indirect effects through NTu (-0.30 and -0.32) than by the direct effects of SEV (-0.08) and rAUDPC (-0.01). These results differ from those found by Betancourth et al.(2008), who reported that the direct effect of SEV on Yld explains 50% of the magnitude of the correlation. Furthermore, the direct effect of the correlation between Yld and TW (0.70), is explained in greater proportion by the direct effect of TW (0.62) than by the indirect effects of the other variables of the PA. This result is useful to direct a selection by TW to achieve an increase in Yld.
Table 4 presents the PCA of the selected traits according to the correlation analysis related to the yield and reaction components to the disease caused by P. infestans. The first three components explain 82.70% of the total variance. Yld, NTu, TW, SEV, RD and rAUDPC were included in the PCA, generating six PCs (Núñez and Escobedo, 2014).
Table 4 Principal Component Analysis (PCA) for traits related to yield and reaction to disease caused by P. infestans in 76 introductions of S. tuberosum group Andigena.
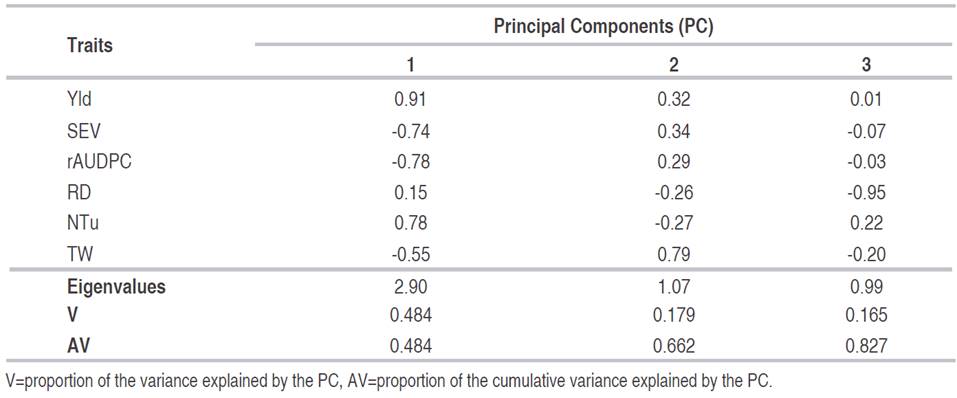
PCs accumulate a portion of the total variance and have greater importance and more accumulated variance the higher their eigenvalues. The PC1, whose eigenvalue is 2.90, has an accumulated variance (AV=48.4%). The first two PCs have an accumulated variance of 66.2% (Table 4). This procedure is used for quantitative data. The aim is to reduce the information, moving from one set of traits to another smaller set representing the former, without making any hypothesis about the meaning of the factors (David et al., 2016).
For the selection of the PCs, the Kaiser Criterion was considered, which is based on the choice of PCs whose values or weights (Bernal et al., 2019). Based on these considerations, the first three PCs that explain 82.7% were selected to explain the variance of the population studied (Table 4).
The traits Yld, SEV, rAUDPC and NTu define the PC1, with variable factor (rv-f) correlation values between -0.74 and 0.91. PC2 is related to the TW that generated the largest contribution to the total variance of the component with an rv-f of 0.79. Regarding PC3, the RD trait made the greatest contribution to the rv-f dimension with -0.95 (Table 4).
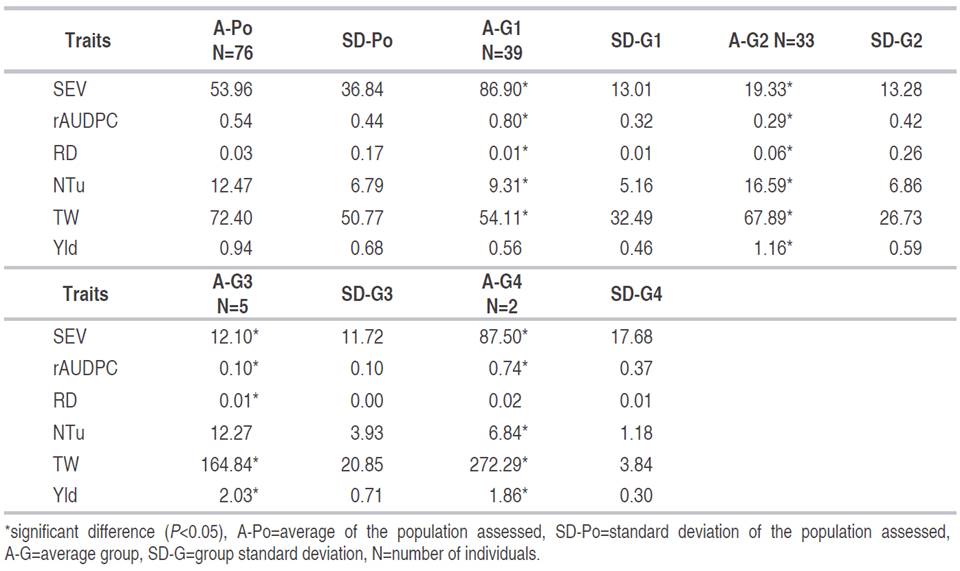
According to the Classification Analysis, four groups were identified (Figure 2 and Table 5). The first group (G1) consisted of 39 genotypes and the susceptible control Capiro identified by T1, T2, T3, T4, which corresponded to 49.37% of the population. This group is characterized by one of the highest percentages of SEV (86.90%) with respect to the general average of the population (A-Po) (53.96%). On the other hand, it showed a rAUDPC of 0.80, with 9.31 NTu and a TW of 54.11 g, which are statistically lower than the average values of A-Po.
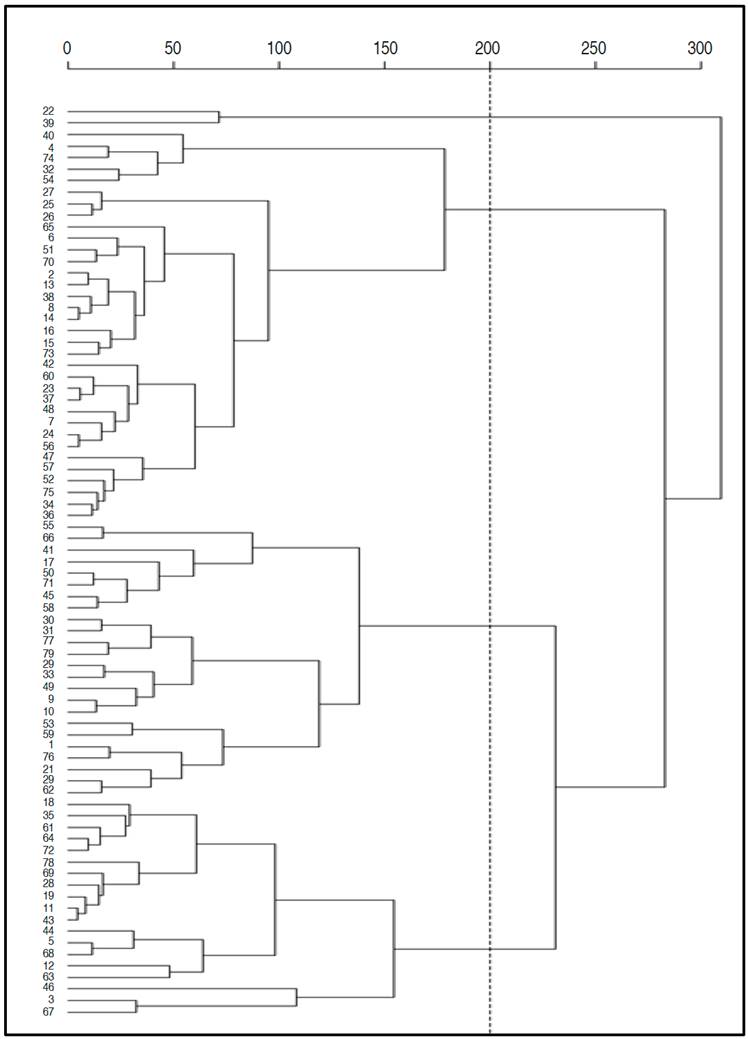
Figure 2 Dendrogram of Hierarchical classification analysis for 75 introductions of S . tuberosum group Andigena and one control sample evaluated for their reaction to disease caused by P. infestans.
The second group (G2) consisted of 33 genotypes, representing 36.71% of the total individuals studied (Figure 2). This group presented an Yld of 1.16 kg per plant which is higher than A-Po of 0.94 kg per plant. It also recorded a low SEV (19.33%), a RD of 0.06, values that differ statistically from population averages. Likewise, the RD (0.06) and the NTu (16.59) were higher than the A-Po (Table 5).
Group three (G3) included five genotypes which are 6.33% of the total population. This group exhibited the highest Yld with 2.03 kg per plant higher than A-Po, a SEV (12.10%) lower than A-Po. The TW (164.84 g) recorded an average statistically higher than A-Po which showed an average of 72.40 g. Finally, group four (G4) included two genotypes, which presented the highest averages of TW and Yld with 272.29 g and 1.86 kg per plant, respectively, higher values than the overall average (Figure 2 and Table 5).
Table 5 Characteristics of four groups formed in the Classification Analysis according to six traits related to components of the disease P. infestans and yield in 76 genotypes of potato Solanum tuberosum.
As it can be seen in the results described above, the introductions with the best behavior with regard to the disease are located in G3 with lower values of SEV and rAUDPC; However, in G4 are located the introductions of better behavior regarding the Yld, even under the pressure of the gradient of the disease, since in spite of reporting significant high values of SEV in comparison with the A-Po, they presented the highest values for the TW, for example, the genotype 40 that corresponds to the variety Red Huila M6 (UdenarStGua40) presented the greater TW with 275 g.
On the other hand, the selection index (SI) allowed the selection of 10 introductions that stood out from the original population, presenting a SI ranging from 1.90 to 3.63 with statistical differences regarding the population average (SI=0.00) (Table 6).
Table 6 Selection index and mean traits of potato S. tuberosum group Andigena introductions chosen for high yield performance (Yld) and low severity levels (SEV) of P. infestans with susceptible and tolerant controls.
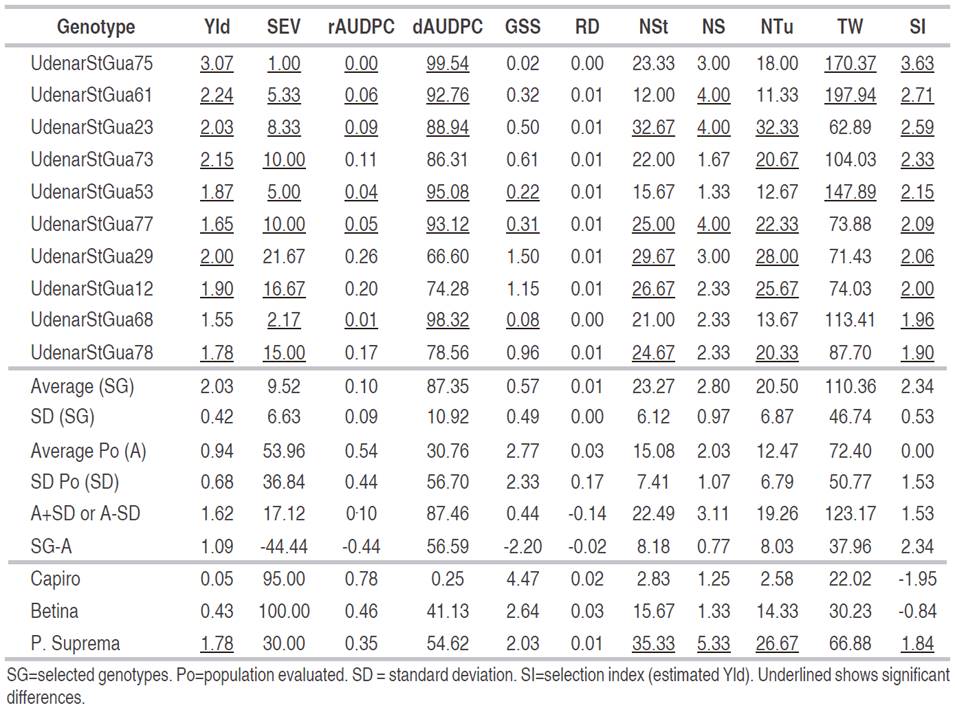
The introductions UdenarStGua53 (CIP 300046.22), UdenarStGua61 (CIP 391011.17), UdenarStGua68 (CIP 392557.171), UdenarStGua73 (CIP 393079.4), UdenarStGua75 (CIP 393280.82), UdenarStGua77 (CIP 393371.164) and UdenarStGua78 (CIP 393371.58) are from the CIP, where they are reported to be tolerant to attack by P. infestans (CIP, 2019). This behavior was similar in the present study, where they obtained values of SEV between 1.0 and 16.67% classified as tolerant and moderately tolerant, and with Ylds between 1.65 and 3.07 kg per plant, with significant differences with regard to the control varieties Capiro (0.05 kg per plant) and Betina (0.43 kg per plant).
Statistically, the Ylds of the 10 introductions surpassed the original population and the Betina and Capiro varieties, which are moderately tolerant and susceptible. With respect to the original population, these 10 selected introductions exceeded the population average by 1.09 kg per plant, which represents an increase in Yld of 53%. However, this gain is subject to factors, such as selection intensity, selection differential (SG-Po) and heritability, which define the true gain known as genetic gain (Nyquist, 1991).
CONCLUSIONS
Principal Components and Hierarchical Classification analyses allowed to discriminate between introductions of Solanum tubersoum group Andigena tolerant and moderately tolerant to the natural inoculum of Phythopthora infestans. As for the correlations of yield with severity and area under the relative disease progress curve, they showed a negative correlation.
The selected genotypes UdenarStGua75, UdenarStGua61, UdenarStGua23, UdenarStGua73, UdenarStGua53, UdenarStGua77, UdenarStGua12, UdenarStGua68 and UdenarStGua78 showed high yield values per plant and severity values below the population mean of 17.12%. Within the selected introductions, those from the International Potato Center-CIP (UdenarStGua75, UdenarStGua61, UdenarStGua73, UdenarStGua53, UdenarStGua77, UdenarStGua68 and UdenarStGua78) are considered as a potential source of tolerance to P. infestans; therefore they are recommended to be included in a breeding program that seeks to obtain tolerant varieties to the disease and should be considered for multi-environmental assessments to determine if there is differential behavior across contrasting conditions.

