


 Inglés (pdf)
 Articulo en XML
 Referencias del artículo
 Enviar articulo por email
 Citado por SciELO
  Citado por Google
  Similares en
SciELO
Similares en
SciELO  Similares en Google
 Permalink
In Panama, rice crop (Oryza sativa L.) is important for agro-industrial development. Provinces of Chiriquí, Veraguas and Coclé have more than 60% of the rice production in the country (Barria, 2012). Since the 90s, producers of these regions are very known by their disposition to use emerging technologies, expecting to improve the yield of their crops. However, the Eastern region of the country, where Tortí and Darién are located, has emerged as an agricultural area (INEC, 2018). Precision Agriculture (PA) plays an important role in rice crop production since it provides techniques that allow optimal use of agricultural supplies (seeds, fertilizers, agrochemicals), regarding the quantification of the spatial and temporal variations of the agricultural cycle (Best and Zamora, 2008; Bongiovanni et al., 2006; IICA, 2014; Fedearroz, 2015).
The rice crop has three morphological phases: vegetative, reproductive, and maturation (Fedearroz, 2015; Serrano et al., 2018). Timely monitoring in the first two phases allows detecting the right place and time for the optimal physical, biological, and chemical treatments that improve the crop yield (Berrío et al., 2015; Brenes-González, 2016; Berger et al., 2019).
Unmanned aerial vehicles (UAV) use for the monitoring of rice and other crops is gaining worldwide acceptance, mainly because the satellite system limitations when capturing multispectral images are reduced (García and Martínez, 2010). UAV equipped with specialized cameras permits to obtain a higher image resolution and to conduct flights based on the climate changes of the study area (González-Betancourt and Mayorga-Ruíz, 2018), Barraza et al., (2019) presented a precision system to apply a herbicide on rice crop to reduce the negative ecological impact in Chiriquí, Panama. In Asia and Africa, these systems are employed in pest prevention, diseases and weed detection in crops (Goel et al., 2002; Berrío et al., 2015; Hernández, 2017). In Colombia, Fedearroz started promoting both systems (UAV and satellite image technology) for crop yield assessment (Lago et al., 2011; Berger et al., 2019) and irrigation planning to increase water use more efficient (Acosta and Mendoza, 2017; Norasma et al., 2018).
Crop health monitoring can be done through remote sensing and analysis of reflection coefficient or reflectance, which is the ratio between sunlight absorbed and the amount of solar energy reflected by the plants (Berger et al., 2019; Brenes-González, 2016). Reflectance varies according to plant cellular structures, physiological characteristics, and morphological phase. The parameter used to relate a crop reflectance with its health conditions is called vegetation index, which is a combination of reflectance values in different wavelengths, with high sensitivity to vegetation changes (Acosta and Mendoza, 2017). The index is used to detect healthy, harmed, or severely harmed plants (Berger et al., 2019; García and Martínez, 2010; Serrano et al., 2018; Goel et al., 2002).
The most used parameter is the Normalized Difference Vegetation Index (NDVI) (Baihua and Burgher, 2015), which measures the normalized difference between the spectral response in the nearby infrared and red of visible spectra bands. This index allows characterizing the crop through a scale of values from -1 to 1. Values closed to -1, are considered white surface as snow, ice, or clouds. Values lower than 0 are classified as water; values between 0 and 0.15 are considered as soil; values between 0.15 and 0.6 are considered mixed soil and vegetation, and between 0.6 and 1 covered vegetation. NDVI indicates if the plant has good vegetative vigor and if it is healthy (Goel et al., 2002; García and Martínez, 2010; Lago et al., 2011).
The information collected through NDVI also allows generating crop condition maps (Brenes-González, 2016), which are bidimensional and georeferenced plots, with a color scale for the visual representation of vegetation index in a region. A crop health map allows identifying problematic areas due to low plant density, water stress or leveling problems, for example. Other kinds of maps permit learning more about plant and soil conditions. Visual maps allow detecting low crop growth and weed distribution and are useful to study topographical conditions (Berrío et al., 2015). The analysis of these maps assists farmers in making better decisions (Lundström and Lindblomb, 2018).
Considering UAV remote sensing advantages in crop care and management, this research aimed to create NDVI-based health maps for Tortí and Darién regions through UAV, NIR and RGB technology in order to set improved agricultural plans for rice crops.
MATERIALS AND METHODS
Study area
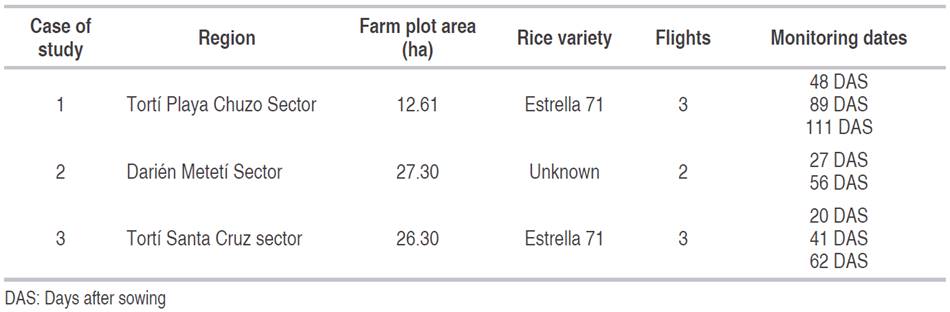
This study was conducted in 14 farms located in two regions of Panama. The Tortí Province (8°55'30" N, 78°24'19.6" W, 96 masl) has warm weather and a temperature range of 21-33 °C; the rainy season lasts 11 months with an average annual precipitation of 190 mm; and the Darién Province (8°20'30" N, 77°54'51" W, 128 masl), in which the temperature varies from 17 to 35 °C and has average annual precipitation between 1700 and 2000 mm (Weather Spark, 2020). Table 1 shows the data of the three of the 14 studied farms.
In the three cases of study, the analysis was based on four maps: crop NDVI-based health map, visual map built as RGB orthomosaic to identify affected areas by weed presence, elevation map that informs on soil surface profile, and tridimensional map which is for virtual terrain inspections.
Equipment
The RGB images for this research were collected using the DJI Phantom 4 Pro drone with a 20 Mpx RGB camera. Multispectral images were taken with a DJI Inspire 1 V.2 and a 12 Mpx resolution Zenmuse X3 multispectral camera (DJI, 2020). The image pixel size varies depending on the height, obtaining values of 2 cm per pixel for flights at 80 m over ground level. These surveys were done at 3.5 cm per pixel of resolution. The software DroneDeploy was used for flight planning, taking an average of 425 images per flight with a 75% front and side overlap. The number of flights performed over each farm plot is presented in Table 1. Flight dates were set considering the rice cultivation cycle (vegetative, reproductive, and maturation): Case study 1: (48, 89 and 111 days after sowing (DAS)), Case study 2: (27 and 56 DAS), and Case study 3: (20, 41, and 62 DAS).
NDVI-based health maps
The software DroneDePloy was used to obtain RGB and NIR orthomosaics, the elevation model, and the 3D model. Additionally, the software YttriumMapper (Version 1) developed by the authors (Montilla, 2017) was used to calibrate the NIR camera using a calibration pattern, which was validated by obtaining NDVI maps. In each farm, the NDVI histogram for health map was calculated. YttriumMapper was also used for the superposition of RGB, digital elevation model (DEM), and 3D maps with the NDVI maps through a mechanism of commutation between both maps in geographical correspondence, which mixes two maps obtained by independent flights.
Google Earth (Version 7.7.3) was used as a visualization tool because it has simple graphic user interphase. This software manages visual and NDVI-based health maps at a low resolution and allows visualizing polygons, traces limits of affected areas, and polygon measurement (areas and longitude). Moreover, a mobile App (AgriYttrium, Version 1) was used to visualize health maps and polygonal areas (Montilla, 2017). AgriYttrium allows navigating the crop and identifying low index areas and other reported issues. Maps used in AgriYttium were handled with 4K resolution and integrate along the polygons in a single KMZ format file to facilitate swift data management.
Report delivery
Results delivered to farmers included printed and digital format reports. Two access levels were provided, the most straightforward to farmer is a KMZ format file that can be directly visualized through the AgriYttrium mobile app and Google Earth. The reports provided a guide of the affected areas to perform agronomical management of these regions.
RESULTS AND DISCUSSION
Three study cases were analyzed. The analysis was based on four maps: NDVI-based health crop map, visual map built using RGB orthomosaics to identify affected areas by weed presence, elevation map to inform about the soil profile, and tridimensional map which was used for virtual terrain inspections.
Case of study 1
The processed images of the first flight showed three areas with crop health problems, which were delimited with white polygons (Figure 1A). The total problematic surface was 3.6 ha (28.2%) of the farm plot. The other part of the map shows colored shade areas with different range of NDVI values: (0.61-0.62), (0.54-0.60), and (0.49-0.53) in upper and lower zones of the farm. The most problematic areas were presented a red hue with the NDVI value ranging from 0.4 to 0.48. Areas in yellow and red hue indicate that canopy did not develop, and seedlings did not emerge, respectively. These values were measurement with the Zenmuse multispectral camera and adjusted to NDVI calibration panel (DJI, 2020). In this experience were not considered the maximum and minimum values of NDVI only mean values (Baihua and Burgher, 2018; Serrano et al., 2018; Goel et al., 2002), because in the plot the noisy data correspond to roads, others farms, and wild trees that could indicate high NDVI values based on the above range values of NDVI, 0.5 and 0.6 values were assigned to healthy plants.
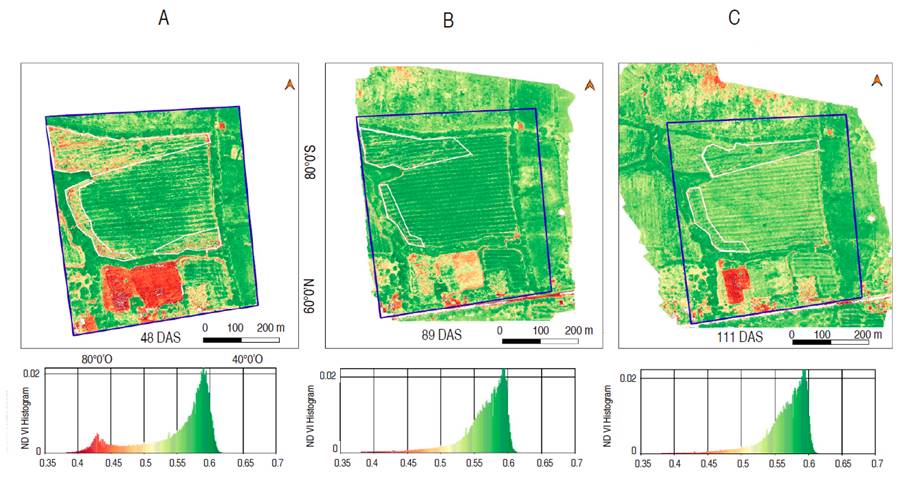
Figure 1 NDVI-based crop health maps for the Case of study 1, showing the studied area (blue polygon) and the affected areas (white polygons). A. 48 DAS; B. 89 DAS; C. 111 DAS.
Figure 1B shows a decrease of the red shades compared to those obtained from the first flight (48 DAS). The fading of the red zones is a evidence of the affected areas recovery (Figure 1A), although still shows health problems in 2.9 ha (23.23%) colored in yellow and light green ranging 0.46-0.55 NDVI values.
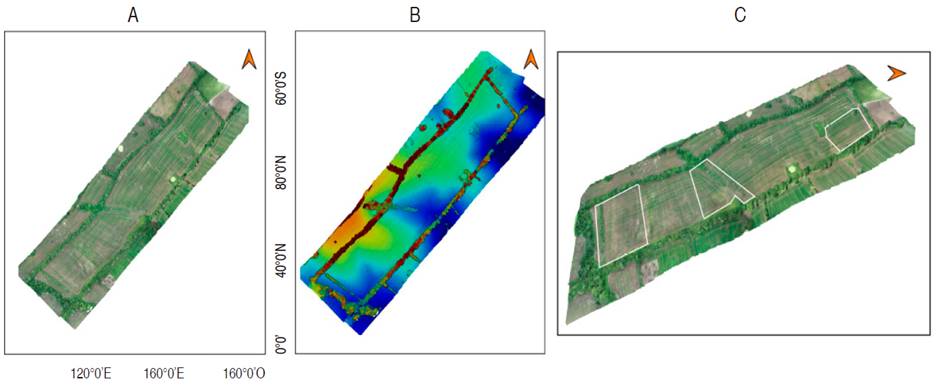
By superposing orthomosaic 2D (Figure 2A) and NDVI-based plant health maps (Figure 1A), areas with no crop coverage were identified. Similarly, when the 2D map and DEM were compared, a slope was observed in the zone with no crop coverage (Blue-colored areas, Figure 2B). The elevation profile obtained from Google Earth showed a difference in the crop height between +20 m (+5%) and -23 m (-5.6%). This unevenness generates problems of irrigation distribution, causing a rice plant loss (González-Betancourt and Mayorga-Ruíz (2018); Berrío et al. (2015). Besides, there were also pest problems (birds) that ate part of the seeds in some areas, according to farmers. In this case, the solution was reseeding with pre-germinated seeds of short cycle to level the production.
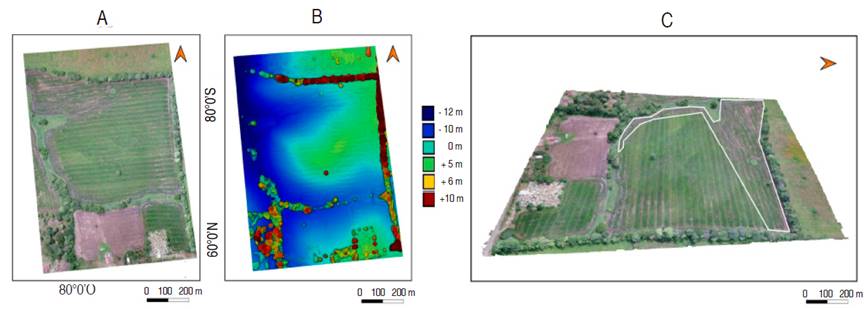
The 3D map (Figure 2C) allowed identifying areas of interest where the farmer must conduct in site inspection (due to the perspective 3D presentation, the geometric forms of Figure 2C looks different to the rectangular shape of maps shown in Figures 2A and 2B, but it corresponds to same study area). The low plant density in the 3D map agree with the signaled areas in Figure 1A. Berrío et al. (2015) indicated that remote monitoring with UAV reduces cost (time and personal) because this equipment can explore large areas with difficult access.
The low health index through the cultivation cycle is presented in Figure 3. It shows the differences between health crop maps and their change over time; this information helps farmers to take actions or modify conditions to improve the health of the affected plants. In this case, the affected area declined by about 5% from 48 to 89 DAS and 10% from 48 to 111 DAS. These data are important since a low health index is related to low yield. The high variability of colors in NDVI maps is associated health variability of crops.
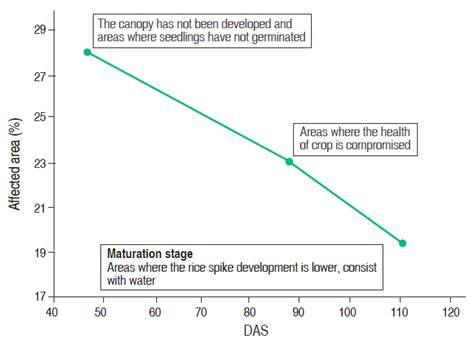
Figure 3 Percentage of the affected zone with low health index in the Case of study 1 along the evaluation period.
Figure 3 information can be considered in a cost analysis since it is related to the production losses and to the number of agrochemical applications to recover the plantation. Also, the involved areas can be used as an evolution quality measurement of the crop that is easy for farmers to understand. Two plantations mapped over the same involved area graph can be immediately compared and conclude which of the two plantations has a better possibility of high production yield. Therefore, the involved areas percentage curves can be used as an important and compact economical tool.
The cumulative NDVI was not considered because only three UAV flights were planned during the entire crop period; consequently, the temporal data is scarce to construct a cumulative NDVI (Baihua and Burgher, 2015; Serrano et al., 2018; Goel et al., 2002). Besides, the focus on the percentage of affected areas is easily understood by the rice producer.
Case of study 2
The processed image of the first flight showed low health index areas (Figure 4, 27 DAS), which were delimited by three white polygons - upper (1), middle (2), and the bottom section (3). The most problematic surface (bottom section) was 8.1 ha (41% of the farm plot) and showed colored shade areas with different range of NDVI values (0.4-0.55).
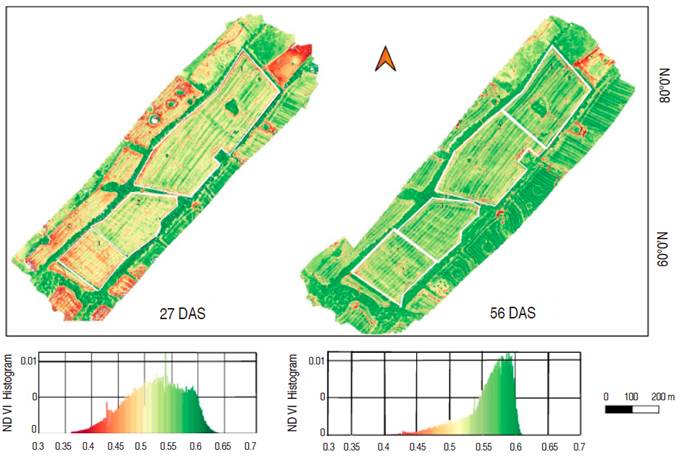
For the second flight (Figure 4, 56 DAS), the map was divided into four sections numbered from 1 to 4 (top-bottom order). Polygon 1 (4.8 ha, 24.2%) presented the greater health index and color uniformity with NDVI range of 0.55 and 0.60. Polygon 2 (6.6 ha, 33.4%) had lower NDVI values from 0.50 to 0.55. In polygon 3 (4.1 ha, 20.8%), crop recovery is evident in comparison with the first flight. However, the health index still low, and the lack of uniformity is noticeable, showing an NDVI range of (0.45-0.58). Polygon 4 (3.5 ha, 17.5%) evidenced a good crop recovery, but the health index remained low, and it also lacks uniformity with an NDVI range of 0.48-0.54.
DEM, 3D maps (Figures 5B and 5C), and the elevation profile obtained from Google Earth show a height difference of 12 m. The slope variations were over +5.4% and -5.1% in the area with no crop coverage. This elevation difference could wash away the seeds (Norasma et al., 2018). In this case, it is recommended to level the area to improve drainage or replant the area with lower crop density.
Case of study 3
The processed image of the first flight (Figure 6A) shows a health map with little vegetation development. Yellow, orange, and red are predominant colors with 0.40-0.45 NDVI values; few light yellow and light green areas with white polygons have 0.50-0.55 NDVI values. It does not necessarily correspond to a non-healthy crop zone because the flight was made in an early stage when the field did not have enough plants. Serrano et al. (2018) and Norasma et al. (2018) recommended the monitoring in this stage to detect plant phenological development and certificate if the growth level of the crop is according to reference patterns. The NDVI map shows a section of 2.5 ha (10.7%) with a health index over the normal range. In contrast, an area of 21.1 ha (89.3%) presented a low health index. These values are consistent with low vegetal development or low plant density in the vegetative stage of the crop (González-Betancourt and Mayorga-Ruíz, 2018).
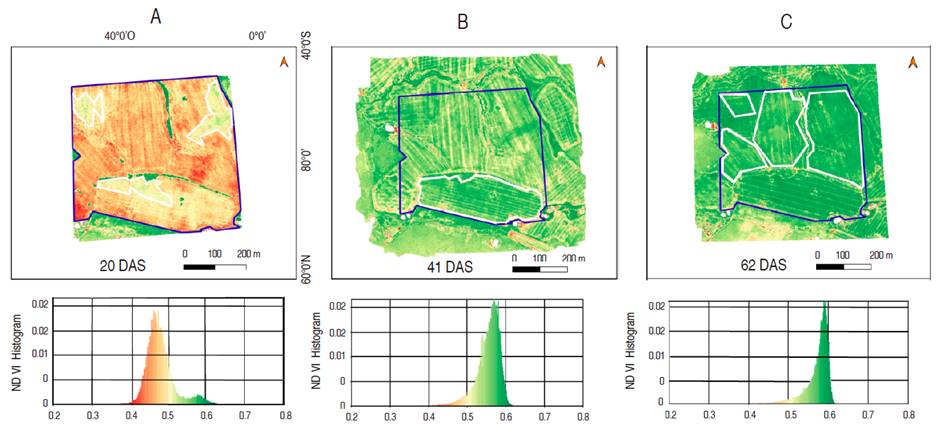
Figure 6 NDVI-based crop health maps for the case of study 3, showing the studied area (blue polygon) and the affected areas (white polygons). A. 20 DAS; B. 41 DAS; C. 62 DAS.
For flight 2 (Figure 6B), the health index was not uniform. There was an increase in crop coverage regarding the first flight, although deficiencies in the crop health were still visible. Only the area shown on the bottom of the map (white polygon) presented an intense green; this sector has an area of 5.8 ha (24.6%) and NDVI values of 0.58-0.62. An area of 17.8 ha (75.4%) with 0.50-0.56 NDVI values was found as a poor healthy plot.
At 62 DAS, the map indicates a tendency to improve the health index in the rice crop, showing an intense green area (NDVI values of 0.58-0.62), although some irregular light green zones (low health index) of 12.05 ha (51.1%) and NDVI values of 0.50-0.56, were still present as in the first two flights. These zones, delimited by white polygons, could have weed growing, whereby it is recommended to conduct on-site revision to generate a robust model map. The zone with intense green corresponds to NDVI values of 0.58-0.62. The range of reported NDVI values for affected areas of this farm could also be related to water stress occasioned by terrain leveling; this can be explain through 2D, DEM, and 3D maps (Figure 7).
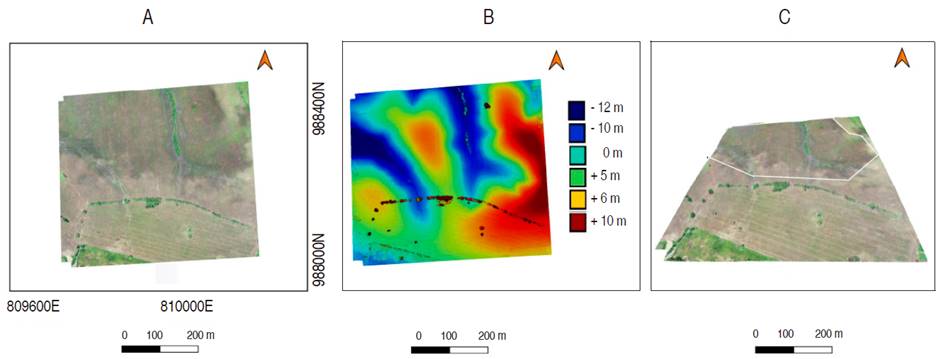
The 2D map (Figure 7A) obtained on 20 DAS allowed verifying the vegetation growth, which is scarce for its age. In DEM map (Figure 7B), the difference of level is approximately 13 m and extensive regions with abrupt slopes can be observed in the elevation profile with variations between +5.2% and -4.7%; these terrain conditions impact the rice crop development negatively because these slopes provoke strong runoffs that can wash away substrate, nutrients and seeds (González-Betancourt and Mayorga-Ruiz, 2018; Norasma et. al, 2018). In the 3D model (Figure 7C), low crop density areas were seen, as well as many hills and creeks, which indicates topographic variations.
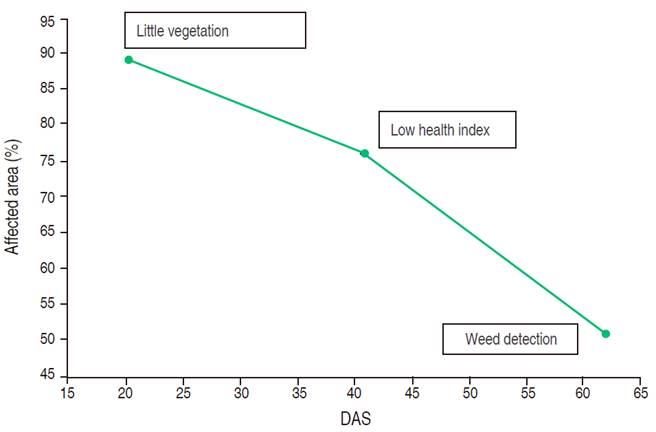
The curve of the affected areas for this farm shows a lack of uniformity at 62 DAS of cultivation (Figure 8). The recovery percentage at 41 DAS of this farm was about 40% showing a gradually recovered.
Crop health monitoring
The health maps allowed identifying and measuring areas with low health index. The most common problems were identified, such as low uniformity in crop health, areas with little crop coverage, low vegetative growth and areas with severe deficiency due to pest damages. The maps were presented to producers in digital and printed format to familiarize them with the use of PA. However, the final corrective decisions were made by the producer based on their experience.
The rice crops are a new commodity in this production areas, previously intended for livestock; therefore, at the moment of the study, they were not equipped with good access to some locations, only by horse or tractor. However, some in situ inspections allowed validating the affected areas detected by NDVI, 2D, DEM, and 3D maps. Other map indexes were not generated, only the average NDVI was estimated for study areas. Micro-leveling of terrain was recommended to farmers for future crops, based on data from the DEM.
Lundström and Lindblomb (2018) carried out a similar experience focusing on the usability of a commercial application and the degree of acceptance of PA. The aim of showing this information to the farmers was to introduce the potential of the PA in the health map interpretation. The current farmers followed an empirical and traditional methodology; they expressed the benefits of the information provided, being able to know the real sowing or production area for the efficient use of inputs such as agrochemicals.
Crop behavior
Maps generated from processed images, in the early stages of rice crop, showed areas of poor seed-germination and reduced vegetative development. The information of this study contrasts with other studies which tackling the behavior of the crops along time (Berguer et al., 2019; González-Betancourt and Mayorga-Ruíz, 2018; Berrío et al., 2015). The advantage of having several maps through the crop cycle is that it allows monitoring crop evolution to provide to the producer a decision-making tool based on the temporal variation of health indexes.
Weed detection
Weed presence in plots was associated with poor control of herbicide application and prevention practices. Weeds detection in the vegetative stage is difficult, but it is necessary to reduce operative cost according to Goel et al. (2002). In this research, agricultural experts analyzed and interpreted maps in the vegetative stage of rice crops using image processing to determined affected areas with weeds. For example, when the NDVI map showed zones with intense green color over 0.6, the superposition between the health map and RGB map through Ytmapper, allowed identifying the size of the most affected crop areas; if the conditions of clime and soil were propitious to vegetal development and the height rice plants were short, the expert inferred that this area was affected by weeds. The expert and farmers visited the affected area to validate this information.
The interpretation of the health map after the first flights allowed detecting the presence of dispersed weeds. The expert solutions are consistence with the reported by Goel et al. (2002) and Hernandez (2017), who indicated that the measurements and analysis of radiance and NDVI values were useful to discriminate weeds and soy crops because when crops mixed with weeds display higher radiance values between 6 to 11% than crops without weed due to the combined biomass. Similarly, Berrío et al. (2015) indicated that the use of remote sensing and PA allows analyzing crops with difficult access and detect affected areas by weeds or water stress.
Contribution of RGB, DEM and 3D maps
A recurring problem evidenced in the studied farm plots is the unevenness of soil surface. This fact is consistent with the regional topographic profile. Steep slopes cause seed displacement at the moment of sowing, washing of soil surface, nutrients and seeds during irrigation. Also, areas with water accumulation were found due to the soil unevenness. All the problems mentioned can be easily evidenced on the health map and corroborated with RGB, DEM and 3D maps, as is shown in similar studies (Goel et al., 2002; Lago et al., 2011; Brenes-González, 2016).
RGB and health maps were useful to do fast inspections of farm productions, to validate the best practice in herbicide control, for crop density measurement and low health index zone inspections. Knowing the affected areas, the farmers can save supplies and perform less invasive practice for crop monitoring. This method is efficient, economical and sustainable. DEM map is recommended to farmers for carrying out and verifying the leveling of land.
CONCLUSION
After evaluating three farms through NDVI-health, 2D, DEM, and 3D maps over the rice crop cycle, it was possible to identify and measure areas affected with low crop coverage, low vegetative development and areas with severe deficiency due to pest damages. The four maps combination generated relevant information that allowed a comprehensive virtual inspection of the land. The 2D and 3D models were useful to determine the real planting area of the farm. The benefits of PA maps were confirmed by the farmers of Tortí and Darien regions. In future works could be possible to make recommendations about replanting areas and application of necessary supplies in affected areas (nutrients or pesticides), and also, apply corrective methods to address problems, such as water stress or invasion by weeds or pests. PA proves to be an economical and reliable tool since a large amount of crop data can be acquired and processed in a short time compared to traditional monitoring methods.

