


 Inglés (pdf)
 Articulo en XML
 Referencias del artículo
 Enviar articulo por email
 Citado por SciELO
  Citado por Google
  Similares en
SciELO
Similares en
SciELO  Similares en Google
 Permalink
Agricultural activity is the basis of the economy in the municipality of Ovejas (Colombia). It represents approximately 60% of the use of countryside. Export-type black tobacco is noteworthy in the area, which is farmers' main source of income during the harvest as well for the municipality (Municipality of Ovejas, 2016). However, between 2002 and 2010, the production of black tobacco in the municipality of Ovejas decreased about 70%, creating economic instability in both the rural and urban sectors (Municipality of Ovejas, 2016). This can be attributed to a lack of climate and irrigation knowledge, generating low crop yields compared to other departments in the country where tobacco is grown, such as Boyacá, Huila and Norte de Santander (2.6, 2.6 and 3.2 t ha-1, respectively) (DANE, 2016).
Water requirements refer to the amount of water the crop needs. In Colombia, these are supplied mainly by rainfall, because irrigation systems are not generally implemented. Most of the agricultural lands in Colombia are rainfed areas, reaching about 68% of the cultivated area (Allen et al., 2006; IICA, 2017). Therefore, the knowledge of the water requirements of tobacco crop is important since some evidences show that water stress can affect the quality and performance of it (Parker, 2009; Biglouei et al., 2010; Diez et al., 2014, Liu et al., 2017). Water stress affects not only the yield of leaves, but also their maturity dynamics (Çakir and Cebi, 2010, Shtereva et al., 2017). Consequently, it is necessary to know the water requirements of the crop, the optimal sowing times and prevent the water stress, while increasing the tobacco yield.
Several international studies have reviewed irrigation scheduling and water stress, and their effect on crop yield and/or productivity (Assimi et al., 2004; Gao, 2006; Ju et al., 2008; Çakir and Çebi, 2010; Jerie and Ndabaningi, 2011; Akinci and Lösel , 2012; Alameda et al., 2012; Liu et al., 2017; Ragab et al., 2017; Diez and Acreche, 2019). In the province of Guizhou, China, the response of tobacco crops to water deficit was studied (McNee et al., 1978; Peng et al., 2015), also the physiological response to water stress was evaluated (Muthappa et al., 2010). Nevertheless, in Colombia, technology in agricultural areas remains deficient, as well as the knowledge about each crop which is considered unsustainable (Lecours, 2014). In the country, some authors have evaluated the crop in vast regions such as, Huila or Santander, to calculate the water demand (Barrientos et al., 2012, Torrente et al., 2008) and to organize fertilization programs (Hoyos and Plaza, 2014).
Those results show some variations due to the particular climatic and edaphic conditions of each analysis area. For that reason, the results obtained from a region cannot apply to other one with different conditions. Therefore, this research aimed to determine the water requirements of burley tobacco crops in the municipality of Ovejas, Sucre (Colombia), which would allow defining the optimal times for planting according to the current weather conditions in the studied area.
MATERIALS AND METHODS
Location of the study area
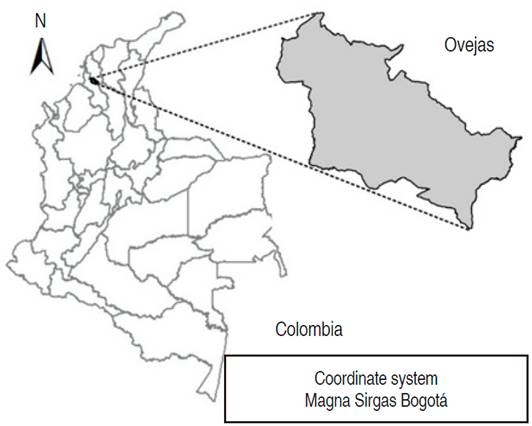
The municipality of Ovejas (Colombia) is located at the northern coast of Colombia. It is part of the Montes de María subregion, with a latitude of 09°31'48"N and longitude of 75°14 '01"W, and an average altitude of 265 masl (Figure 1).
The municipality is located on the Magdalena Cauca macro-basins (Bajo Magdalena Cauca - San Jorge and Bajo Magdalena hydrographic sub-zone) and Caribe (Caribe Litoral hydrographic sub-zone). The study area presents a unimodal rainfall regime, with a very dry season that usually lasts from December to March (approximately 80 mm per month). The rainy season begins in April about by 155 mm of precipitation, gradually increasing its rain until to reach its maximum between September and October (monthly maximum about 240 mm of precipitation). The largest rainfall and lowest evapotranspiration occur in the northern part of the study area.
Collecting and processing data
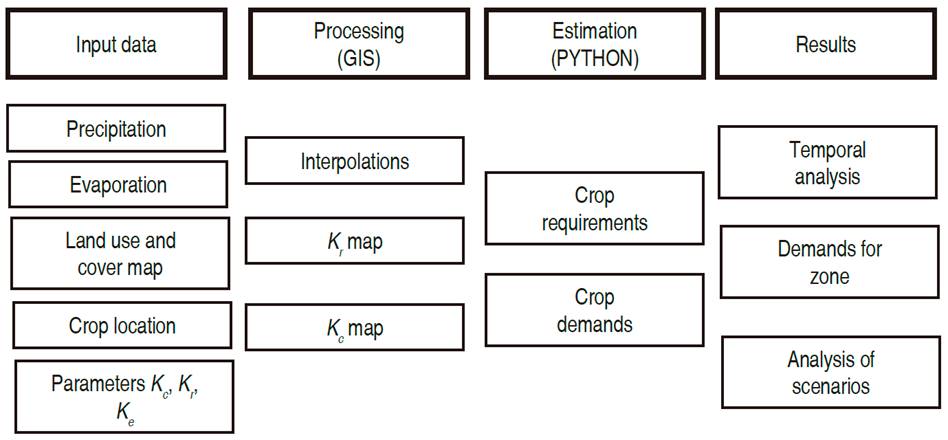
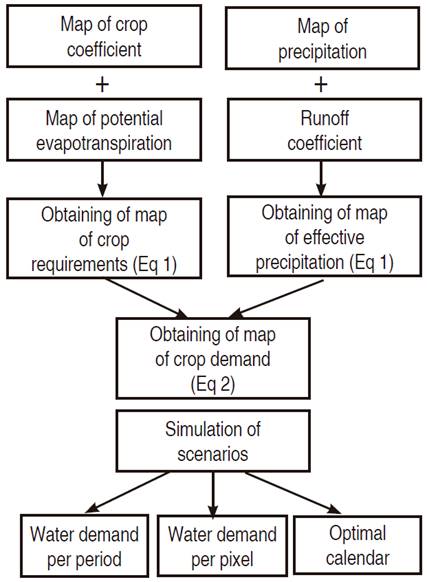
Firstly, the input information was collected as time series (hydroclimatological variables) or as maps (location of crops, irrigation system if it exists, information on growth stage of crops). The input information was validated and the raster maps of precipitation, evapotranspiration, crop coefficients, and irrigation systems were obtained by GIS (Geographic Information Systems) (Figure 2). In addition, effective precipitation had to be defined according to the information on the soils in the study area. Each of the aforementioned variables were spatialized in each stage of the analysis. For the analysis, the modeler must select in advance the most appropriate spatial and temporal resolution. Afterward, the Python tool was used to perform the calculations proposed in Equations 1 and 2, obtaining the results of crop water requirement and demand per analysis period and per area. In this case, the week was selected as the analysis period. Once the analysis for the base year is obtained (that is, one year under normal climatic conditions), future simulations such as climate change could be studied.
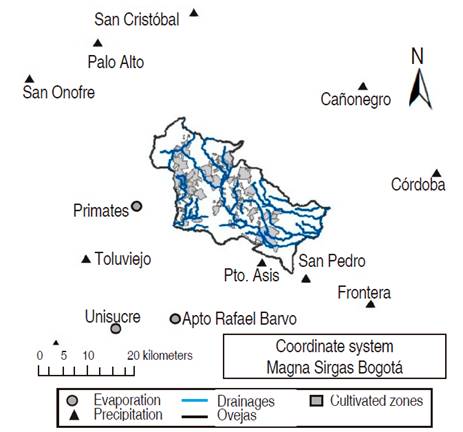
To collect the whole information, 28 hydroclimatological stations were identified, which were near the study area. Homogeneity, consistency and concurrency analysis tests were carried out in all of them (IDEAM, 2015). From these analyses, 10 precipitation stations and 3 evaporation stations were selected (Figure 3). These stations allowed to obtain precipitation and evapotranspiration series per week (52 weeks - January to December 1994). Precipitation and evapotranspiration series of the stations were interpolated to derive weekly maps (30x30 m), applying the Inverse Distance Weighting method or IDW, since it is the most commonly used interpolation method (Hernández et al., 2013), and has no restrictions on the number of sampling points (Vargas et al., 2011). Maps with the tobacco farms locations were developed by the Agustín Codazzi Geographical Institute (IGAC) and available on the entity's website (Figure 3).
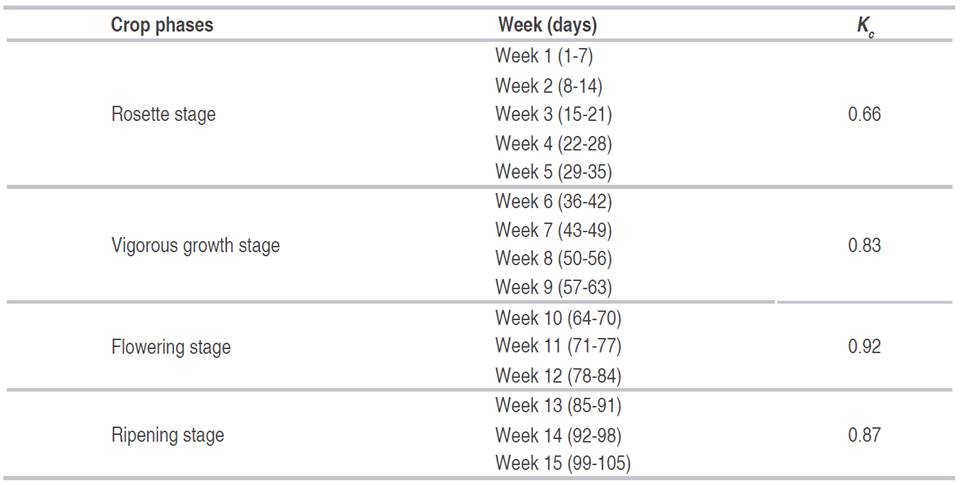
The crop coefficient was determined using the results of the study developed by the Faculty of Engineering of the Universidad Surcolombiana (Torrente et al., 2008). The tobacco-growing cycle consists of four phases (rosette stage, vigorous growth stage, flowering and ripening stage), with a total duration of 105 days. The analyses in this study were carried out weekly, so the duration of each phase of the cultivation was adjusted (Table 1).
The effective precipitation coefficient was calculated according to Villazón et al. (2019), who estimate the effective precipitation using the method of the United States Department of Agriculture (USDA), the AGLW-FAO method and the fixed percentage method for 20, 50 and 80% of the total precipitation. The results of the USDA and the AGLW-FAO methods offer effective precipitation values, similar to those values obtained by the fixed percentage method for 50 and 80% (Doorenbos and Pruitt, 1977). The areas of those studies present hydrological and soil characteristics similar to those considered in the municipality of Ovejas, allowing to select them for the study. Kr = 1 was the irrigation efficiency coefficient used, in order to analyze crop water requirement of tobacco and the optimal planting times without irrigation systems.
Determination of water requirements
Water requirements were estimated spatially and temporally by the crop water requirement equation (Allen et al., 2006) (Equation 1) and the equation of agricultural demand for the crops (IDEAM, 2010, 2015) (Equation 2).
Where ETc is the evapotranspiration of the crop (mm day-1), Kc is the dimensionless coefficient of the crop and ETo is the reference evapotranspiration (mm day-1).
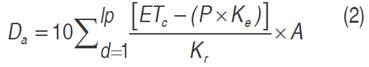
Where, Da is the additional crop water requirement or demand (m3 ha-1), 10 is the factor that applies to convert to m3 ha-1, lp is the length of the growth period, ETc is the evapotranspiration of the crop (mm), P is the precipitation (mm), Ke is the runoff coefficient, Kr is the coefficient of irrigation efficiency and A is the planted area (km2). Figure 4 show the model designed in the Python programming language implementing both equations, which was executed by ArcGis software.
Model results
For the analysis time, 38 scenarios were considered where one scenario is a complete vegetative cycle of 15 weeks. First scenario started in week 1 of the year, and then each scenario was moved one week until the 38th to complete 52 weeks of the year.
Firstly, the model was executed by calculating the water requirements of the crop (Equation 1) and then the water demand (Equation 2). The variables required in each equation were transformed into raster maps, changing the conditions according to the modeling scenario. As results, the volume of required water for each hectare was obtained, and the irrigation volume if this was required. When the crop requires irrigation, the results are positive indicating that evapotranspiration exceeds precipitation.
Future simulations
Additional simulations were developed, taking into account the projection and climate trends in Colombia due to the incidences of climate change. These were performed based on the information of the Third National Communication on Climate Change, issued by IDEAM. According to the third national communication climate change simulations for Colombia (IDEAM et al., 2016), between 2011-2100, the Caribbean region would present a decrease in precipitation of 10-40%, and the average annual temperature of the country could gradually increase by 0.9°C for the year 2040, 1.6°C for the year 2070 and 2.1°C for the year 2100. In order to analyze the incidence of climate change in the crop cycle, an increase in evaporation of 10% and a decrease in precipitation of 10% were considered (simulation CC1) as the most conservative scenario proposed by IDEAM (2016).
RESULTS AND DISCUSSION
Characterization of precipitation and evapotranspiration
The climate of the region in terms of precipitation exhibits a unimodal behavior, with values ranging between 1029 and 1999 mm. Spatial distribution of precipitation indicates that the highest annual precipitation occurs in the north, with records ranging between 1400 and 1500 mm, and the least amount of precipitation occurs in the southern center with values between 1200 and 1300 mm. Evapotranspiration presents annual mean values between 1422 and 1775 mm. Monthly records range from 103 mm (May in Primates station) to 179 mm (March in Rafael Bravo Airport station). According to the spatial distribution of annual evapotranspiration, the lowest values occur in the north ranging between 1660 and 1640 mm and the highest in the south with values ranging between 1660 and 1640 mm. The evaporation behavior shows a similar trend in the stations analyzed, registering the highest values from January to March and the lowest values in May, October, and November.
Crop water requirement
Water requirement of tobacco crop was obtained between 3059 and 2190 m3 ha-1 by the model, corresponding to scenarios 1 and 34, respectively. Water requirements were much larger at the beginning of the year (Figure 5).
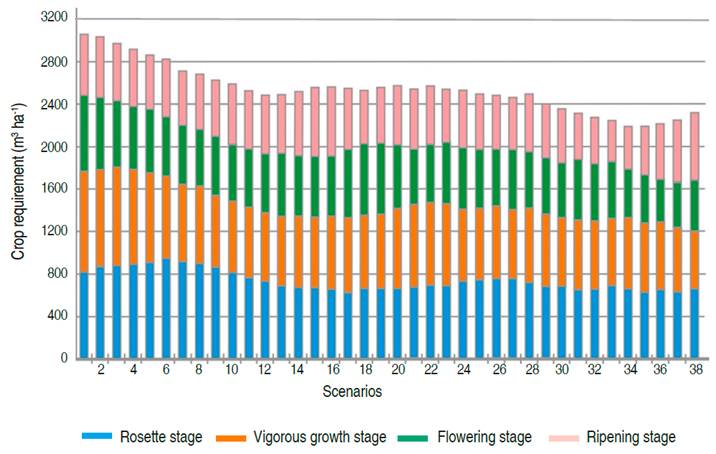
The scenario 1 began in the week 1 (January) and ended in the week 15 (April), the most significant water requirement occurred in week 6 (with values ranging between 254.60 and 277.80 m3 ha-1 per week), which corresponds to the vigorous growth phase, especially in crops located in the southern of the town. Besides, in scenario 34, started in week 34 (August) and ending in week 48 (November), the highest water requirements were observed in week 9 (with values ranging between 177.80 and 188.90 m3 ha-1 per week), also in the phase of vigorous growth. The results obtained through this analysis reflect the climatic conditions of the study area since the largest water requirements were found in the crop cycles planted in January, February and March, that correspond to the dry seasons in which the highest monthly evaporation values were reported.
Optimal planting periods
In the studied area for all the crop scenarios, irrigation was required in some weeks. Therefore, the optimal planting time was defined as those cycles that require the minimum amount of irrigation. The maximum was achieved because of the surplus of precipitation (9 weeks), 60% of the crop cycle time was covered with precipitation and 40% by irrigation. This was only achieved in scenarios 20 and 21, as shown in Figure 6, followed by scenarios 17, 18, 19, 22, 24 and 25, where excess of precipitation (surplus) occurred in 8 weeks of the crop cycle, that means, the requirements were fully covered at 53% of the time (these scenarios are highlighted in gray in Figure 6).
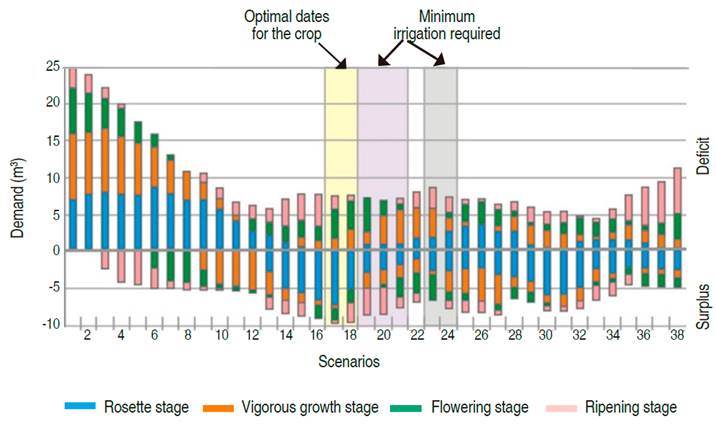
However, it is important to note that in the first phase of cultivation (rosette stage), there cannot be any water deficit, since once the crop is established, the cultivation of tobacco can adapt to land with water scarcity (Aguilera, 2013). A more detailed analysis of this phase demonstrated that in none of the scenarios, the maximum surplus values did not exceed 2.79 m3 week-1, while the maximum deficit values were presented in scenarios 2-6 with values of 2.14 m3 week-1, representing the greatest irrigation needs. Moreover, it can be observed that the scenarios with the highest number of weeks with excess precipitation (20 and 21) presented irrigation needs in one week of the rosette stage. This same situation occurred in scenario 19, which presented irrigation needs in the last week of the rosette stage. Scenarios 22, 24, and 25 presented irrigation needs in at least two weeks of the first phase of the crop, while scenarios 17 and 18 did not present irrigation needs in the phase of rosette stage.
Since the irrigation needs occurred in all the cycles analyzed, the crop would not have an optimal development in any scenario. Therefore, scenarios 17 and 18 (week 17, April to week 31, August; and week 18, May to week 32, August, respectively) were considered the times with the best conditions for planting the tobacco crop (lower irrigation needs) given that they presented a surplus of precipitation in the initial phase of cultivation, although they presented weekly water deficits, being the highest of all the scenarios in week 11 and 12 of cultivation.
The recommended scenarios correspond to the months identified with the highest rainfall in the study area, confirming the results obtained from the analysis of this variable. In the cultivation cycles of scenarios 17 and 18, the crop water requirement was not totally satisfied by rainfall for 7 weeks, presenting irrigation needs that would cause low productivity of the cultivation.
The tobacco crop in the municipality of Ovejas would have a vegetative cycle between May and August with the best defined planting conditions. A second harvest can be planned, between 38 and 52 week. This scenario is proposed only as an alternative to optimize the production of land in the municipality of Ovejas through the implementation of a second harvest per year, and it was chosen because it is the cycle that presented the most rainfall surplus weeks (7 weeks) after completing the first recommended cycle of the crop. Nonetheless, at the slow growth phase there was a week with irrigation requirements. It is necessary to implement a system to supply the requirements of water at least during the rosette stage, if required. For the second harvest, other weeks were identified where the crop is not completely satisfied by rainfall, presented irrigation needs and possibly low productivity.
Effect of climate change on the crop - Simulation
The CC1 simulation showed that tobacco water requirements will increase by 14.3% regarding the base year of analysis (Figure 7). Additionally, the weeks with a surplus of precipitation were decreased from 9 to 7 weeks. It could be the scenarios that presented lower irrigation needs in the base year (17, 18, 19, 20, 21, 22, 24, and 25), according to the climate change scenario, two weeks of irrigation at least are demanded. Besides, the scenarios with the largest number of weeks with surpluses were18 in May, 31, 32, and 33 in August.
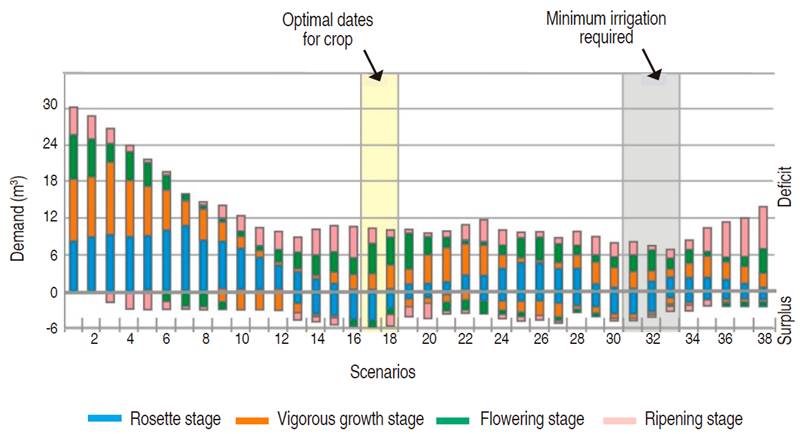
To determine the optimal planting times, it is suitable to start the crop cycle at week 17 or week 18, since the precipitation always exceeds evapotranspiration, presenting a surplus of water. These cycles would allow two harvests per year, starting the second harvest in week 32 or 33 (no optimal conditions), which correspond to scenarios 32 and 33, respectively. Therefore, the most significant weekly deficits were again presented in scenarios 2-6 with 2.45 m3 week-1.
The volumes of excess precipitation would be lower than those presented in the conditions of the base year (January to December 1994), evidencing decreases between 19.5 and 96.9%. Therefore, even considering storage for irrigation systems, the volume of available water is expected to be lower compared to what was estimated in the base year.
On the other hand, weekly volumes of unsatisfied requirements would be higher than those presented under the conditions of the base period, showing increases in weekly requirements between 14 and 1043%; this latter value was observed in week 5 of the scenario 38. The weekly demands are expected to be between 14-975%, with weekly averages per scenario ranging between 22-143% where the largest weekly increases would be observed in scenarios 12, 13, 16, 17, 18, 19 and 38 corresponding to March, April, May, and September (Figure 8).
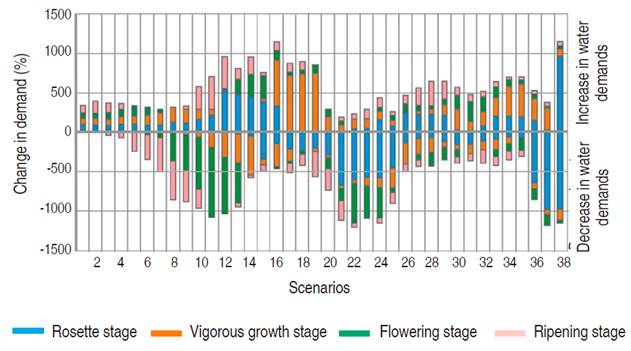
For the same scenarios, the highest weekly maximums would be presented, indicating that these scenarios are very vulnerable to climate change. In general, deficits would increase remarkably from April to May and to a lesser extent from July to August. However, the surpluses that occurred in late February, March, May, and June could increase.
In each growth phase, it was observed that the greatest changes would occur in the rosette and flowering phases, towards the surplus. In the rosette phase, the main increases in surpluses appeared from the end of April to the beginning of July, that is scenarios 15-25 and then considerable increases in surplus (up to 567%) were presented in scenarios 36-38 for the crops that started in September. In the flowering phase, the most significant changes were also presented in the surplus in May and June for scenarios 20-24, with increases of up to 325%. Moreover, in the rapid growth phase, the main changes appeared in the deficit increasing them, highlighting scenarios 16-19, which begin in April and May, with increases of up to 563%. All this information indicates the dates to start optimal crops are still scenarios 17 and 18. The irrigation requirements for these weeks would significantly increase, making the irrigation system less efficient.
CONCLUSIONS
It is not possible to meet the requirements of the crops in any cycle, applying the tool developed based only on the precipitation of the area. The implementation of irrigation is required for the sector to be fully productive. Therefore, the optimal planting times for tobacco cultivation that would require the least amounts of irrigation would be scenarios 17 and 18 (week 17, April to week 31, August and week 18, May to week 32, August, respectively), since they present a surplus of precipitation in the initial phase of cultivation, which is a critical phase for its development.
The results of the analysis of climate change show that there would be significant changes in the irrigation demand of crops, increasing water requirements and decreasing the volumes of excess rainfall. Regarding the amounts of unsatisfied needs, there is an increase concerning to the base year, between 14 and 1043%. It was observed that the previously recommended optimal scenarios would be severely affected by decreases in rainfall and increases in evapotranspiration, presenting greater increases in deficit levels from April to May and to a lesser extent from July to August. Likewise, there is a high potential for water storage, since surplus levels increase very widely in late February, March, May to June. In addition to irrigation, it is important for farmers to adapt to new climatic conditions by modifying crop calendars so that they would be more efficient both in crop yields and in the operating costs of the irrigation districts.

