


 Inglés (pdf)
 Articulo en XML
 Referencias del artículo
 Enviar articulo por email
 Citado por SciELO
  Citado por Google
  Similares en
SciELO
Similares en
SciELO  Similares en Google
 Permalink
Quinoa (Chenopodium quinoa Wild) is a crop originated in the South American Andean mountain chain (Tapia et al., 1979), with a diversity of ecotypes adapted to different environments (De Santis et al., 2018). The grains of quinoa contain protein of outstanding quality. They are better balanced in terms of amino acid composition than most other cereals (Tapia, 2000). Also, it has great agronomic potential for tropical and temperate conditions. Currently, the interest in this crop has been growing around the world (Asher et al., 2020). Quinoa crop has received a great attention in continents such as Europe, North America, Asia and Africa, because of its ability to be productive under various environmental stresses (Bazile et al., 2016; Gesinski, 2008; Gomez-Pando, 2015).
Quinoa is used as a traditional cereal but without being part of the grass family. It belongs to the dicotyledonous family Amarantaceae. It is an herbaceous plant, 3 m high in some varieties, with high phenotypic plasticity (Becker et al., 2017). Morphology, coloration and phenology depend on ecotype in agroecological zones where they are cultivated (Apaza et al., 2013). The Nariño cv is originated from selections that have been adapted to the conditions of the department of Nariño in southern Colombia. It is a quinoa with an amaranthiform panicle, which is characteristic of Real Quinua, a name given by the large light-colored grain size, that presents good protein content (Veloza et al., 2016). Temperature and photoperiod have been widely studied in terms of their impact on growth and development. In contrast, hydric status and solar radiation have scarce researches (Razzaghi et al., 2012; Ruiz and Bertero, 2008). On the other hand, other studies have found that temperature and salinity could influence development and yield. Nonetheless, the plant could diminish these effects due to its great phenotypic plasticity (Becker et al., 2017).
Increasing sowing density is one of the main practices used to improve solar radiation capture by crops (Idinoba et al., 2002). The accumulation of biomass only depends on the incident photosynthetically active radiation (PAR) in absence of stress conditions. The incident PAR varies according to latitude, season, date of sowing and phenology of plants. The relation between incident PAR and the biomass increases is denominated as radiation use efficiency (RUE) (Monteith and Moss, 1977). This expresses the relative mass accumulation of the crop to the amount of light intercepted by the leaves. The arrangement of the crop rows can alter the light distribution, leading changes in the intercepted PAR. Also, changes in sunlight distribution cause variations in crop yield (Liu et al., 2017).
Ruiz and Bertero (2008) in a study conducted in Quinoa with stable conditions of nutrient and availability of southern Chile found that the RUE is directly affected by the leaf area index (LAI) through modifying the distribution of radiation inside the plant. Besides, improvements in the period where PAR interception was below 50% is key to increasing the biomass gain. Alternatives to modify LAI are the uses of varieties with a different leaf arrangement or a modification of the sowing density (Liu et al., 2012). Different studies of sowing density of quinoa have been carried out. These have indicated that plot arrangements of 80 to 327 plants per m2 (near 1 million plants ha -1) with a space between rows (50 cm) are optimum in order to obtain the best yield in temperate conditions in Denmark (Jacobsen et al., 1994). In contrast to the results found, in temperate conditions in Brazil, 100,000 plants ha-1 is one of the best sowing densities for quinoa (Spehar and Rocha, 2009).
The aim of this study was to evaluate the response of the quinoa crop Nariño cv to the radiation interception, growth, development and yield, taking into account three different planting densities in high tropical conditions in Colombia.
MATERIALS AND METHODS
Experimental design and growing conditions
The research was developed at the Universidad de Ciencias Aplicadas y Ambientales U.D.C.A, at the countryside area 'El Remanso' located in the north of Bogota, Colombia (4°47'57.98"N74°2'47.17"W, 2,560 masl). The experiment was performed in the second semester of 2016. Plant material was Quinoa Nariño cv (Veloza et al., 2016). A completely randomized experimental design was applied with three treatments (sowing densities), three repetitions, and the experimental unit was three plants. Sowing densities were D1 65,500 plants ha-1 (0.2x0.8 m); D2 83,333 plants ha-1 (0.15x0.8 m); D3 156,250 plants ha-1 (0.08x0.8 m). Planting was developed in loamy soil with pH 6.9 and 14% of organic matter. The seed was disposed at 3 cm soil depth, drip irrigation was provided in the germination and vegetative phase.
Response variables
Canopy transmission of PAR radiation (percentage) was measured in four phenological stages: vegetative, panicle development, flowering, and milky grain. Measurements were made using a lineal ceptometer model AccuPAR LP-80. Transmission percentage was determined by using this equation: TR(%)=(TRx100)/IR, Incident Radiation (IR) as 100% of total energy and Transmitted Radiation (TR) as the transmitted energy through canopy. This Equation is related to energy balance in leaf and plant canopy (Lambers et al., 2008). Three plants were sampled by each repetition, 3 repetition by each sowing density. Rows were north to south, and quantum bar were placed east to west.
IR was determined by the ceptometer in total solar exposition, with an external PAR sensor included in the ceptometer and TR between lower canopy position and soil with the quantum bar of the ceptometer. Data were obtained every day between 12:00 and 13:00 hours.
Leaf area was determined by destructive measurements in four phenological stages: vegetative (46 days after sowing, DAS), branch development (76 DAS), panicle development (106 DAS), and flowering (134 DAS). For each plant, data were measured with CL-202 portable laser area meter from CID Bio Science Inc.
Dry weight (DW) measurements were made for root, stem, leaf, and panicle according to Hunt (1978) protocol. The samples were put in an oven with temperatures up to 80 °C and measured every 24 h, until they obtained a constant weight.
Three plants per repetition were sampled to determine yield, total grain weight per plant, total plant weight, the weight of 1,000 grains, and harvest index (HI). HI was determined by the equation: HI=Grain Yield per plant/total fresh plant weight Yield (t ha-1) was determined by a thresher, harvesting four lineal meters of the central area per repetition.
Statistical analysis
Data were subjected to analysis of variance (ANOVA). Mean comparison was performed using the Tukey honestly significant difference (HSD). Grains and plant weight data showed heteroscedasticity, and the data was transformed with a natural logarithm. Analyses and calculations were developed using IBM SPSS version 23.
RESULTS AND DISCUSSION
The values of plant density (D1, D2, D3) did not have a significant effect on the transmission percentage of solar radiation in any of the phenological stages (Figure 1).
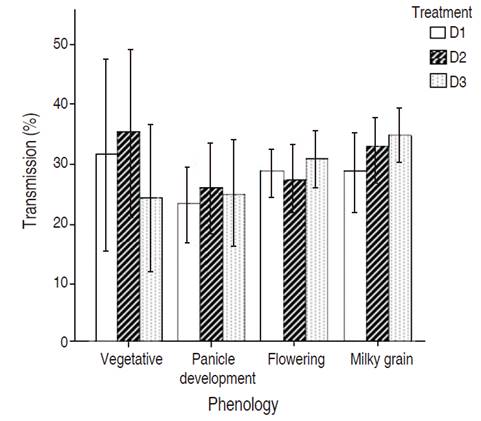
Figure 1 Transmission percentage of photosynthetically active radiation (PAR) of Quinoa canopy. Phenology stages vegetative (65 DAS), panicle development (108 DAS), flowering (124 DAS), milky grain (137 DAS). No statistically significant differences were obtained in all measurements (P>0.05), according to Tukey test. Vertical lines correspond to standard deviation.
PAR percentage transmission in all phenological stages was below 40% of transmission. The highest value was obtained in shoot growth by D2 with 34.49%, with a theoretical interception of 65.06% of PAR values upper 80% Ruiz et al., (2008).
Increasing sowing density did not show effects; this is the reason why PAR transmission was not statistically significant in all treatments and phenology stages. Leaf area index is related to this result, since the values were similar in all densities, and leaf area is related with interceptibity of radiation, affecting also transmissivity as another component of energy balance as Bosco et al. (2020) showed in their study using apple orchards.
In root DW, samples showed a significant difference only at 76 DAS (Figure 2A). Treatment D1 obtained the higher root DW values, followed by D3, with no statistical differences between them. In the case of stem dry weight (Figure 2B), measurements were taken at 76, 106, and 137 showing no significant differences. After that, at 46 DAS plants sowed at D1 density, showed the best stem DW. For leaf DW (Figure 2C), statistical differences were found at 106 DAS.
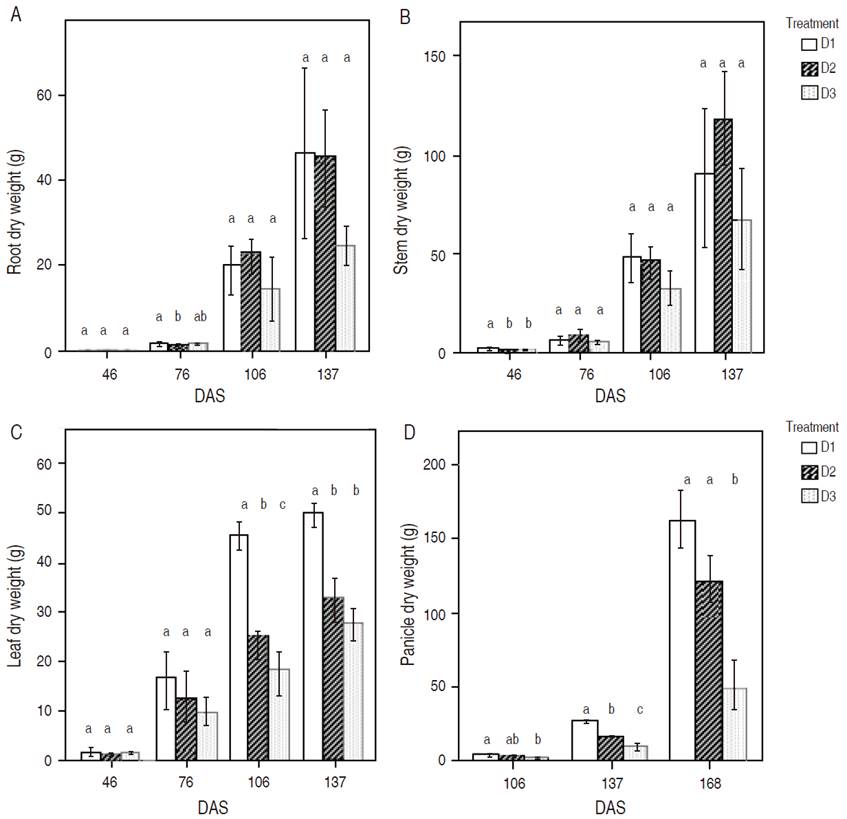
Figure 2 Mean values of dry weight per plant section. A, B, C: measurements were taken at 46, 76, 106, and 137 DAS; D: panicle DW measurements were taken at 106, 137, and 168 DAS. The results with the different letters in each phenological phase were statistically significant (p<0.05) and probed the Tukey test. Vertical lines correspond to standard deviation.
The plant density D1 obtained the highest DW, followed by D2 and D3, with significant differences between them. Besides, D1 showed the highest leaf DW at 137 DAS, followed by D2 and D3, with statistical differences between D2 and D3.
According to Figure 2D, plants sowed at D1 density showed a higher significant panicle DW gain in all measurements (106, 137, and 168 DAS). In contrast, D3 registered the lowest values of DW in all measurements. In quinoa root DW, Tarek et al. (2017) found in samples taken at 75 DAS that plants growing under stress conditions generate more DW because they need to grow larger to reach the water. At 75, D1 was the treatment with less plant density, and the shoot (stem and leaf) was not thoroughly developed. This allowed a treatment more susceptible to water loss due to higher crop evapotranspiration (Moradi et al., 2011). However, once the plants were under a complete leaf area, the differences vanished. Researchers have identified that above-ground DW could get a unique response to an increase of salinity in the soil; otherwise, factors like temperature did not affect DW (Becker et al., 2017).
Significant leaf area between sowing densities were obtained after 137 DAS, where D2 obtained the highest one (Figure 3A). For the LAI at 46 and 76 DAS, significant results were obtained: in both measurements, the highest values according to plant density were D3, D2, and D1. Nonetheless, there were no significant differences among them (Figure 3B). The present study showed that the effect of sowing density on leaf area is only observed at the end of the production cycle. This behavior is because of the adaptability of quinoa to all kinds of environments (Jacobsen et al., 2003); therefore, the decrease of leaf area is possible under drought conditions. Fghire et al. (2015) found LAI values higher than 4 in well-irrigation conditions in Morocco.
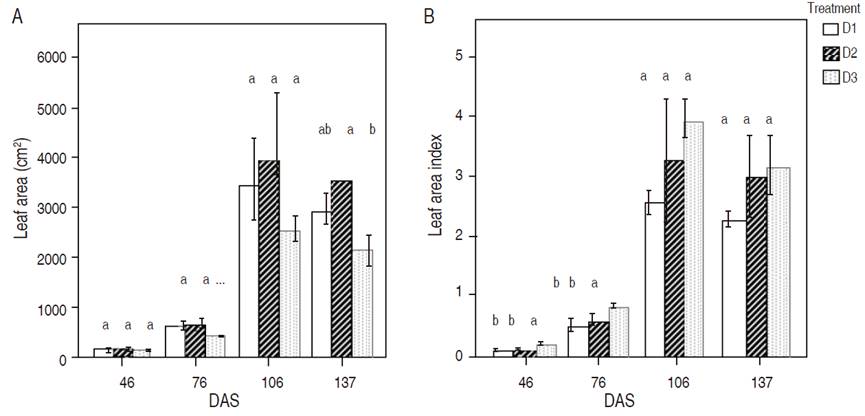
Figure 3 Mean values per plant of leaf area (A) and leaf area index (B). Measurements were taken at 46, 76, 106, and 137 (DAS). Values with different letters were statistically significant according to the Tukey HSD test (P<0.05). Verticals lines correspond to standard deviation.
Concerning plant densities, the D1 arrangement was the best density in terms of yield (Table 1), followed by D2. The lowest grain production was obtained by plants sowed at D3 density. Significant differences in the weight of 1,000 grains were obtained by D1 treatment. D3 had the lowest values for this variable. Moreover, for the harvest index, significant differences among densities were not found.
Table 1 Yield weight of 1,000 grains, and plant weight and harvest index (HI) for different planting densities of Quinoa.
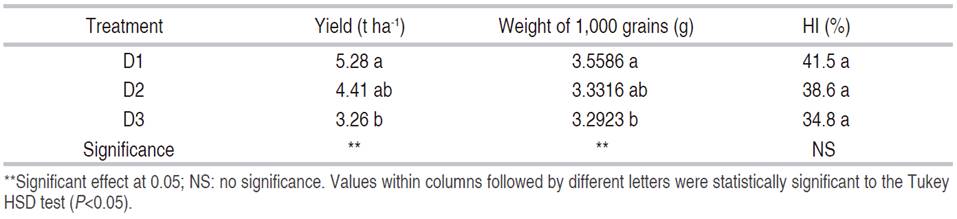
The optimum density of plants in the present experiment was D1 with 5.28 t ha-1, compared to the reports of Blanca Nariño (Colombia) Hualhuas and Mantaro cultivars with yields around 3.5-4.5 t ha-1 (Zurita-Silva et al., 2014). A Peruvian genotype (4B-216) was reported with a yield of 4.168 t ha-1 (Garrido et al., 2013).
Similar HI values (36.5%) were found by Hussain et al. (2018) in Dubai with control samples of Chilean and USA varieties. For this study, HI values were similar in yield while they were higher in control conditions. Spehar and Rocha (2009) identified that the increase in planting density is not correlated with an increase in yield. An evaluation of nine varieties of quinoa showed that yield and harvest have a high correlation with environment and genotype (Garrido et al., 2013).
The present study identified that sowing density (5 plants m-1) could affect yield while HI does not. Regarding the weight of 1,000 grains, similar responses were found in a mutant quinoa plant (3.5 g) in a study performed in Peru (Pando et al., 2017). In a study carried out in Nariño, Colombia, the best response over this variable was obtained by Piartal cultivar with 3.45 g (Delgado et al., 2009). Weight of grains and the number of plants per ha were the components responsible for increasing the yield. Plants with less sow density allowed developing grains with the best weight as well as more grains per plant, allowing to increase yield and HI (Jia et al., 2018 Similar results were obtained by Eisa et al. (2018), who reported that increasing plant led a significant decrease in the weight of 1,000-grains, using similar densities to this research (4 and 15 plants per LM). Whereas Erazzú et al. (2016) found that the increase plant sowing density (27 plants per LM), led to a decrease grain yield.
CONCLUSION
No differences were found in the percentage of radiation transmission for different planting densities through the development of quinoa phenological stages. However, there was a significant accumulation of dry matter in leaf and panicle at the final phenological phases related to the differences in leaf area in the milky grain phase. This probably means that more leaves are translocating photoassimilates to a higher number of grains, reflected in larger panicles, since a higher content of dry matter was evidenced in the D1 treatment. Successively, the lower density presented a higher yield for the variety evaluated, which was characterized by presenting a panicle of amarantiform shape, with larger panicles and grains similar to Real quinoa varieties, compared to varieties of glomerulates panicles not evaluated in this research.
For future studies, it is convenient to extend the evaluation to varieties of quinoa of different panicle shapes in order to evaluate the best planting densities obtained in this research.

