


 Inglés (pdf)
 Articulo en XML
 Referencias del artículo
 Enviar articulo por email
 Citado por SciELO
  Citado por Google
  Similares en
SciELO
Similares en
SciELO  Similares en Google
 Permalink
The cashew (Anacardium occidentale L.) is a product with a high content of flavors, colors, and the presence of fructose as the predominant sugar. It is cultivated in different parts of the world (Makanjuola et al., 2013; Dedehou et al., 2016) and in some Latin American countries, including Venezuela where it grows wild and without a protocol of cultivation (Guerrero and Velazquez-Moreira 2014; Guerrero et al., 2019). These fruits represent an important part of the production of cashew nuts (fruit) but cashew apple is non-used in the food industry after the extraction of juice (Da Costa et al., 2009). This characteristic is important in the commercialization of the pseudo-fruit due to the chemical characteristics of the cashew apple for a wide field of applications such as enriched powders (Da Costa et al., 2009), nutritional juice (Das and Arora, 2017) and ethanol production (Oliveira et al., 2019).
Recent studies in the chemical composition of cashew apple revealed an important amount of antioxidant among other compounds (Guerrero et al., 2019; Oliveira et al., 2019). Since the ripening index can only be calculated by employing a destructive technique using the calculation for soluble solids and titratable acidity (De Figueiredo et al., 2002), image analysis emerges as a novel, easy, and low-cost technique that allows maturity calculations utilizing only a picture. This can be obtained using a single camera but the image analysis is the main part of the experiment, with several advantages over chromameters; such as a lower cost, the possibility of being used for in-line inspection, the capability of analyzing larger areas to provide spatial data, thus eliminating the subjectivity of human criteria (Orrillo et al., 2019). Image analysis using a high-quality image and a region of interest (ROI) is a powerful tool for evaluating the quality of food by color (Tarlak et al., 2016). It also allows developing a vast analysis of sample features such as size, shape, and image texture (Arzate-Vázquez et al., 2011; Sa'ad et al., 2015). It is well known that color is one of the most important appearance attributes in fruit and it has a high influence on consumer acceptability (Fernandes et al., 2011). Some studies of cashew apples have not been established color as a quality criterion to determine the optimal maturity for harvesting and marketing (Vélez-Rivera et al., 2014). These analyses have been related to the presence and concentration of pigments such as carotenoids, anthocyanins, flavonoids, and chlorophylls in other fruits (Corzo and Álvarez 2014).
The main objective of this contribution was to evaluate color and physico-chemical changes induced by different days of storage of cashew apples at room temperature through image analysis and established experiments, respectively. Results can prove a dependency between chemical parameters and color analysis, using only an image and a non-invasive experiment. These results can be reproduced in several pomaces, fruits, and other food in the market.
MATERIALS AND METHODS
Materials
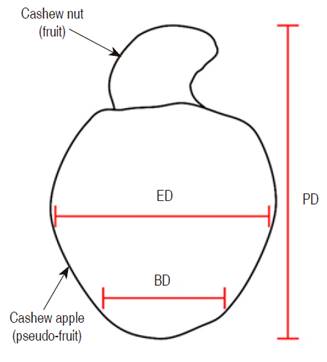
Cashew (Anacardium occidentale L.) has two edible parts known as cashew nut (fruit) and cashew apple (pseudo-fruit), this part was used as a sample (Figure 1). 116 cashews were taken from a crop located on the outskirts of the Maracaibo city, Zulia, Venezuela. Samples were randomly and systematically taken from the crop in their respective ripening index according to Sindoni et al. (2009) and Gadani et al. (2017). Samples were transported and analyzed in the Centro de Investigaciones en Química de los Productos Naturales "Gladys León de Pinto", of Universidad del Zulia (L.U.Z.).
Fruit processing
Since cashews are perishable fruits, a physico-chemical analysis must be performed once the fruit is harvested, which means between 2 or 3 h after removed from the plant. To prevent any change in the physico-chemical evaluation, samples were selected and washed carefully with a sodium hypochlorite (NaOCl) solution (100 ppm) for 5 min (Gadani et al., 2017). After that, a citric acid solution (C6H8O7) (1% w/v) was used for 5 min to finish the cleaning in the samples, as Oliveira et al. (2020) reported. Samples were separated into three groups for the different treatments that would be applied and kept in storage around 23 °C for 0, 3, 6, 9, and 12 days of analysis. For physico-chemical analysis, pseudo-fruits were homogenized in a grinder machine (OSTER®, Model BRLY07-Z00, USA) and analyzed by triplicate in each day of storage. All analyses were performed on 0 day once the samples were ready to proceed. After that, samples were processed at 3, 6, 9, 12 days in the morning, and analyses were performed immediately.
Color analysis
Images of the samples in each day of storage were used to evaluate color parameters. RGB images were captured with a size of 1800x2000 pixels and stored in the computer in TIFF format. ImageJ software version 1.51s (National Institutes of Health, Bethesda, MD, USA) was used to evaluate color changes in a selected region of interest (ROI) of each sample. CIELab color space was selected for color evaluation in the food industry due to its widespread use. It represents more closely the colors perceived by the human eye (Pathare et al., 2013). Thus, CIELab coordinates, L* (luminosity), a* (green to red), and b* (blue to yellow) were estimated. Previously, the digital camera was calibrated using the values of CIELab coordinates (L*, a*, b*) evaluated by image analysis and a chromameter (CR400, Minolta, Japan) (images of 35 color patches) (Arzate-Vázquez et al., 2011). For each color parameter, the values of 35 color patches obtained by image analysis and chromameter were correlated with a linear fit. For the three plots of color coordinates (L*, a*, b*), R2>0.95 were obtained.
For the calibration procedure and image analysis of cashews, the conversions were performed using the "Color Space Converter" plugin of ImageJ 1.51s to convert RGB images into L*, a*, b* separate channels. Illuminant D65 was used in the image analysis as well as in the evaluations with the chromameter. The values from each CIELab coordinate were obtained using the histogram tool of ImageJ software.
Additionally, chroma values (C*) and Hue angle (H*) were calculated with Equations 1 and 2 using values for CIELab color space.
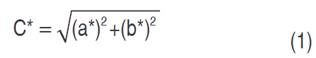

Also, color differences (ΔE) were calculated from equation 3 (Arzate-Vázquez et al., 2011):

where ΔL*= L*- L0*; Δa*= a*- a0*; Δb*= b*- b0*, being L0*, a0*, b0* the color parameter values of the samples at day 0 and L*, a*, b* the color parameter values of the fruits at different days of storage.
Physico-chemical analysis
Mass content. Samples were weighed in an electronic balance (Mettler Pc. 4400, USA) on 0, 3, 6, 9, and 12 days. Mass content (MC) was calculated for each sample group in an average calculation and the results were expressed in g fruit-1 (Guerrero et al., 2008).
Diameter calculations. Samples for each group were measured using a digital Vernier (Fisher Scientific, USA) in three different points of the fruits (Figure 1). Polar diameter (PD), equatorial diameter (ED), and apical diameter (AD) were measured on the first day (0 days) and the different days of storage (3, 6, 9, 12 days). Values were reported on average for three samples and results were expressed in mm (Guerrero et al., 2008).
Chemical analysis. The total soluble solids (TSS), titratable acidity (TA), moisture content percent M (%), and pH of the cashew apples were evaluated in the fresh pulp (pseudo-fruit). Homogenized samples were prepared for each day of storage and pH was evaluated in each sample using the 1315-79 standard COVENIN (1979). TSS was measured using a digital refractometer (Carls Zeiss, 130486, USA) using the AOAC (2019) with the procedures 22.024/31.011. TA was determined by titration with 1 N NaOH, the values were expressed as malic acid g 100 g-1 of the sample as 1151-77 standard COVENIN (1977) reported. In samples of 0, 3, 6, 9, and 12 days, M (%) was measured using the weight of the samples before and after the drying process at 80 °C in triplicate using AOAC (2019) in the procedures 22.008, 22.013.
Ascorbic acid and phenolic content determination. The ascorbic acid content (AAC) was measured using the Tilsman method AOAC (2019) (43.060) and reported in mg of ascorbic acid 100 g-1 of the sample. Phenolic compounds (PC) were extracted using methanol as Hernández-Varela et al. (2013) previously reported. The supernatant was kept in storage in an amber flask at -15 °C and analyzed 48 h before the extraction. A calibration curve from 0 to 500 µg L-1 was made using gallic acid as standard and the results were expressed in mg L-1 of gallic acid equivalents (GAE).
RESULTS AND DISCUSSION
Color analysis
Color analysis in food samples is a quality control parameter that must be evaluated to know the visual appearance and organoleptic acceptance of the samples (Medina et al., 2010; Vélez-Rivera et al., 2014). Figure 2 shows a color gallery of cashew fruits at different days of storage (0, 3, 6, 9, 12 days). A stable comparison of maturity for the samples was observed. Lopes et al. (2012) explained that pigments present in the samples (carotenoids and anthocyanins) found during the ripening reflect the changes in the color of the cashew apple.
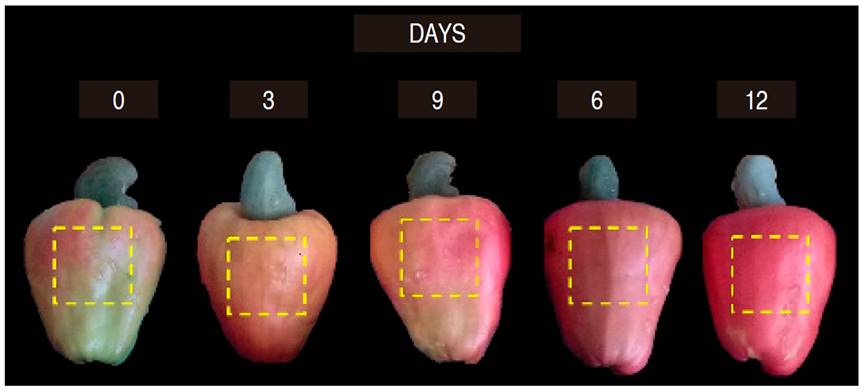
Figure 2 Color images of cashew fruits and pseudo-fruits at different days of storage. ROI: region of interest in a yellow dashed square.
Image analysis was performed using the above-mentioned Figure 2. Changes in the color space coordinates (L*, a*, b*) for each day of storage and their differential of color (ΔE), Chroma values (*C) and Hue angle (H*) were evaluated. Figure 3 shows the L*, a*, b* values obtained with the CIELab color space plug in for the ROI pictured in the image, and later on, the ΔE values, hue angle, and chroma values of the images for each day of storage were calculated. Figure 3a-c shows values of L*, a*, b* parameters in cashew apples, these data revealed the same tendency from a lower to a higher maturity as other authors have referred (Lopes et al., 2012). Changes in the value of L* (Figure 3a) are related to the brightening of the samples (Hernández-Hernández et al., 2016) and it can be appreciated that L* values in all the samples remain similar, although changes in the a* and b* values are observed. Values of b* fluctuates from day 0 to day 12, starting with an increase until day 6 and later on a reduction in day 9, which concludes with an increase in day 12. These values are related to changes from blue tones (-b*) to yellow tones (+b*) in the samples. On the other hand, a* values are related with yellowish tones (-a*) to reddish tones (+a*) (Pathare et al., 2013). It can be observed that in maturity, the most important compounds responsible for color changes are carotenoids and anthocyanins, being carotenoids the responsible for changes in yellow-red tones, and anthocyanins responsible for changes in blue-yellow and blue-red tones, depending on pH (Khoo et al., 2017; Ranganath et al., 2018). Figure 3b corroborates an increase of red tones from 0 to 12 days, reflecting a major presence of carotenoids in the sample due to the ripening of the samples. Besides, Figure 3c shows a slight increase of yellow tones from 0 to 12 days, related to a major presence of anthocyanins. Khoo et al. (2017) explained that in acidic conditions, anthocyanin appears as red pigment while blue pigment anthocyanin exists in alkaline conditions. Lopes et al. (2012) described that carotenoid content in their samples increased during ripening without any significant difference. The color changes in this study are similar to those reported before.
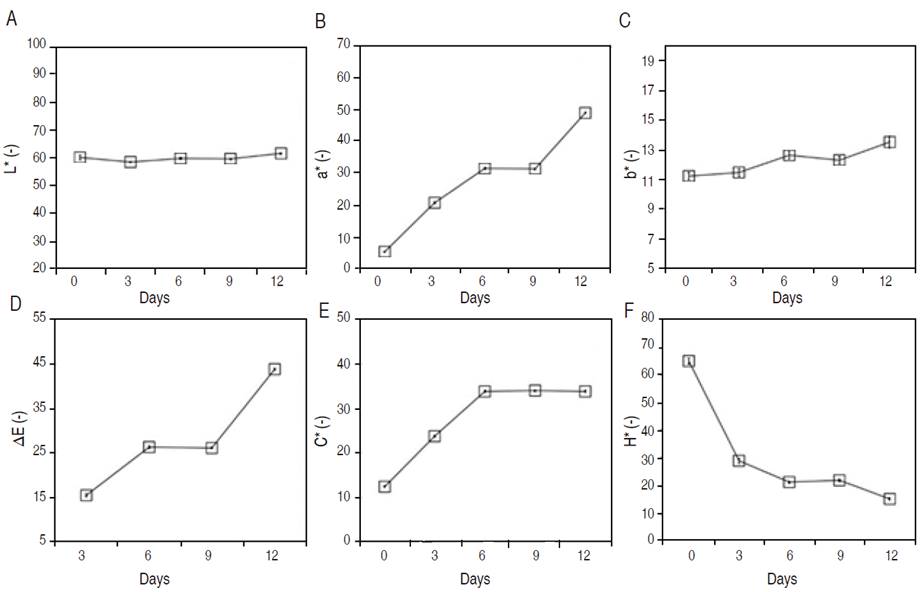
Figure 3 Image analysis of cashew apple. L* (A), a* (B), and b* (C) coordinates of CIELab color space; (D) ΔE values, (E) C*: chroma values, (F) H*: hue angle values in degrees.
Figure 3D shows a comparative result of the differential of color (ΔE) for the initial time of storage (day 0) concerning the color of the samples at a different time of storage (3, 6, 9 12, days). For 6 and 9 days, a clear stationary result is presented due to the reach of a proper maturity of the samples. ΔE<15 is associated with yellowish color in the samples and a more reddish tone is found when ΔE>30 (Oliveira et al., 2019). Results of ΔE=26 in this study demonstrated an accurate stage of maturity in the samples.
A remarkable opinion-based on image analysis of fruit samples could be discussed since color changes are used as a quality parameter, this non-destructive technique provides a huge amount of information of the sample and could be extended to other fruits with nutritional and commercial importance.
Chroma value (C*) increased from day 0 to day 6, and after that time it remained stable until the last day of storage (Figure 3e). As usual, the color became more intense due to the reactions of the ripeness that generate representative color changes but after a specific time, those changes are less observable (Fernandes et al., 2011). Besides, the hue angle (H*) traditionally defines colors as rosy, yellowish, and greenish (Pathare et al., 2013). The cashew apples had a percentage reduction of 76% from day 0 to the last day of storage (day 12) (Figure 3F). Day 0 is more related to a yellow pseudo-fruit (90°) and at the end of maturity, it is more related to a red value (0°) (Oliveira et al., 2019). Comparing H* with C* values, it is possible to infer that after day 6, more stable changes are shown and these values can be used as a good parameter to select a sample ready for consumption following the results obtained in ΔE and a* parameters.
Physical analysis
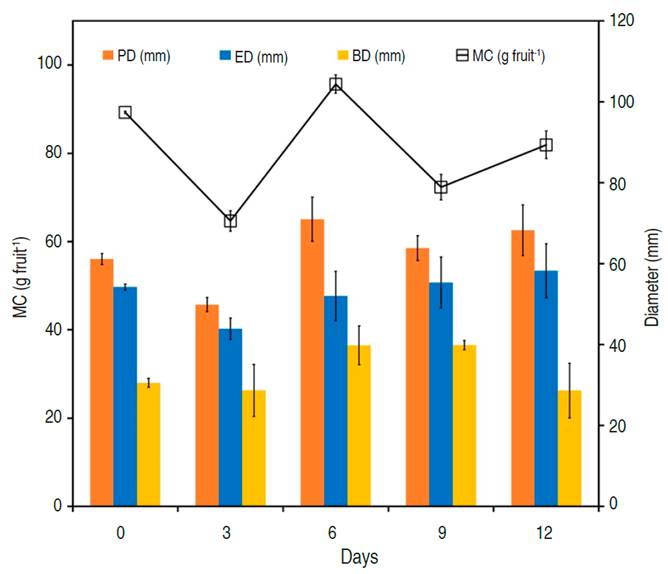
Figure 4 shows the average results obtained from the physical analysis of the pseudo-fruits. Taking into account that between days 6 and 9 is the best stage of maturity for the samples, these values are discussed below. The average of ED in the samples was 54.20 mm on day 0, followed by a reduction on day 3 and an increase on day 6. This behavior is typical in samples with a higher amount of water in the cells (Meyers et al., 2008). Expansions of the samples are common when samples are at a controlled temperature, and other reactions are present inside the fruit (Adjou et al., 2017). The values of PD are more heterogeneous due to the proper size of the samples, but specimens showed that after day 6, compression due to dehydration of the sample is found (Fernandes et al., 2011). Changes in the BD follow a similar tendency between day 0 and day 6; and after that day, samples tend to be compressed and become smaller. Finally, the mass content (MC) from day 0 (89.25 g fruit-1) had a similar tendency until day 6 in which a higher value is found (95.67 g fruit-1). Later, day 12 revealed that MC decreases until 81.90 g fruit-1 and these values are explained as a common reaction on the size changes of the fruit when a maturity process is occurring (Singhal et al., 1997). All values showed significant differences (P<0.05) between each day of storage. A comparison with matured Anacardium occidentale from India proposed by Das and Arora (2017) reported that mass (50-140 g fruit-1), width (35-50 mm), length (40-75 mm) are similar to those values obtained in this study.
Chemical analysis
Table 1 shows the pH, TSS, TA, M, AAC, and PC of pseudo-fruits of A. occidentale used in this study. The pH of cashew apples ranged from 3.74 to 4.10. These values are reported to be considered in the acidic range for food (Oliveira et al., 2019). Due to particularities in the pH of the samples discussed above, it is possible to find a redder tone in the last stage of maturity when samples tend to be more acidic. These results proved there is a higher concentration of anthocyanins at the end of the ripening taking into account the color of the pseudo-fruits (Khoo et al., 2017). TSS in cashew apple were in a higher range of 10.69 to 18.82 ºBrix, comparable with those obtained in A. Othonianum accessions between 9.60 - 13.47 ºBrix (Oliveira et al., 2019). TA for the samples was established in a range of 0.21 to 0.37 mg 100 g-1 of malic acid. Makanjuola et al. (2013) reported a range of 0.22 to 0.29% after 28 days of preservation in cashew apple juice at room temperature.
Table 1 Chemical parameters for cashew apple (Anacardium occidentale L.) at different days of storage.
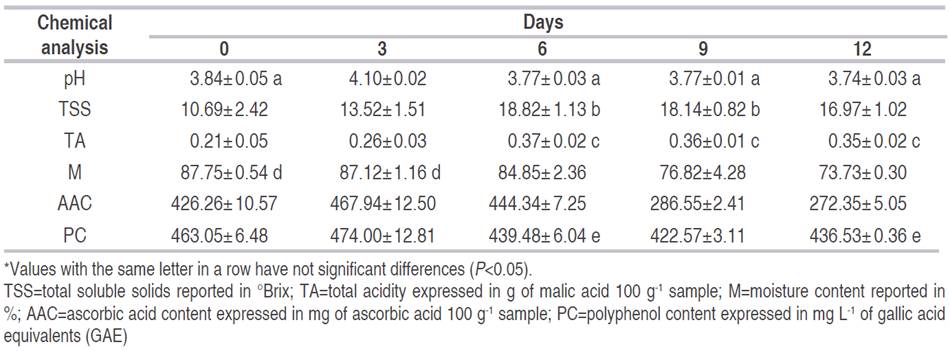
Moisture content M(%) follows the typical decrease tendency for fruits in which a loss of water is observed during the storage time (Hosseinpour et al., 2011). For AAC, a high level of vitamin C was observed in the first 6 days of storage since ascorbic acid remains more stable in an acidic medium (Makanjuola et al., 2013) but after this time other reactions inside of cashew juices can produce a loss of vitamin C in the storage time (Oliveira et al., 2019). The same behavior is observed for PC, where higher values are observable in the first days of storage (0-6 days) but after that time, a small decrease in the content was observed similar to Lopes et al. (2012) report for cashew apples in a ripening value of 7.
Color and chemical correlation
On the other hand, fruits with low acid and high soluble solid contents are desirable for raw consumption (Malevski et al., 1977). However, the pseudo-fruits are richer in the antioxidant compounds only at the initial stage of maturity (Table 1, AAC, and PC values). The authors reported that the anthocyanins, total carotenoids, TSS, TSS/TA, polymeric tannins, vitamin C, and reducing sugars increase continuously during the maturation of the cashew apples (Makanjuola et al., 2013; Dedehou et al., 2016; Das and Arora 2017). These results are proof of the behavior of the samples in this study, since values increased from day 0 to day 6 and later on, decreased on days 9 to 12. With this explanation is easy to achieve a well-matured and perfect consumable fruit before day 6 of storage, based on the physical and chemical results previously presented.
The color values and the AAC and PC values in Table 1, can be directly related to Lopes et al. (2012) results, carotenoid pigments display a considerable level of antioxidant activity as well as the total anthocyanins content that also increases with ripening. Finally, physico-chemical characteristics of cashew apple in pulp and juice form, have differences based on the locations of harvest. These differences are associated with changes in soil conditions, cultural practices, and other climatic conditions such as temperature and humidity (Makanjuola et al., 2013; Oliveira et al., 2019).
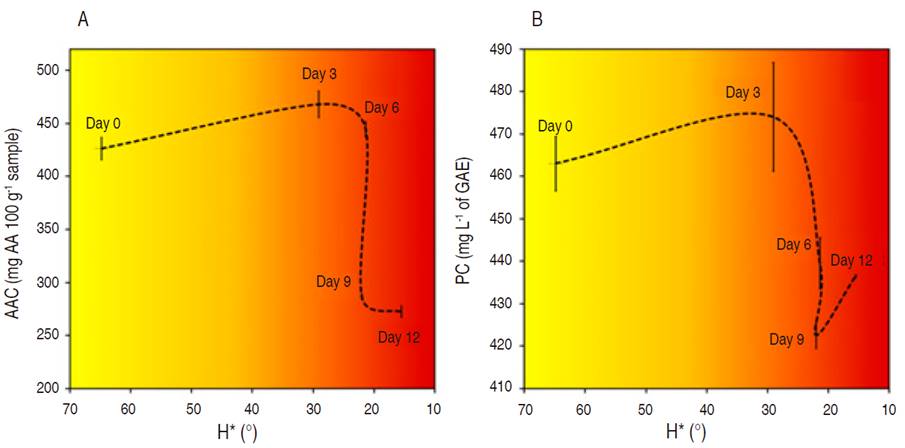
Figure 5 shows the correlation between the total antioxidant activity (AAC and PC values) with the image analysis (hue angle values) that are related to the changes in the tonality of the samples at different days of storage. The correlation reveals an interesting behavior for AAC vs H* (Figure 5a) and PC vs H* (Figure 5b). The changes in color for cashew pseudo-fruits was explained as a decrease of yellowish tones in the early stages of ripening until an increase in red tonalities was observed due to the intensification of anthocyanins, anthocyanidins, and other compounds that appears as part of the maturity (Khoo et al., 2017). But, authors report that antioxidant activity (AAC and PC) should gradually increase with the rise of polyphenols and other antioxidant compounds that are present in the sample (Queiroz et al., 2011; Makanjuola et al., 2013). For ACC, the rise of these levels from day 0 to day 3 is attributed to an ascorbate oxidase reduction, which is an enzyme responsible for its degradation, or to a decrease in the levels of Cu2+, which is a cofactor for the enzyme (Lopes et al., 2012). Nevertheless, AAC and PC revealed that after day 6 of maturity, the values started to decrease and showed a stable value for AAC at the end of the maturity stage (Figure 5a) but for PC a fluctuation was observed at the end of the maturity stage (Figure 5b). Since, the hue angle (H*) in the images analysis confirms the appearance of reddish tones in the sample, it could be explained that antioxidant capacity is reduced due to the internal reaction of the pseudo-fruits and inner senescence of the tissues. According to Scheer (2013) when the chlorophyll is lost and other pigments are synthesized, color changes during maturation are produced.
CONCLUSION
Since cashews are a perishable fruit with a lower facility of consumption than other fruits, an important market could be developed when the physical and chemical characteristics of the samples are evaluated. Image analysis reveals that cashew apples are good material to develop the analysis with high accuracy, also this technique emerges as an easy and non-invasive technique to select a sample with a consumption maturity without resorting to a destructive technique. Then, using only an image is possible to correlate the hue angle values (<30°) associated with the tonality of color changes in the fruit and follow the antioxidant capacity of the sample. Finally, this fruit represents a new alternative to extract more stable and rich antioxidant compounds after 6 days of storage (444.3±7.25 mg AA 100 g-1 sample AAC and 439.48±6.04 mg L-1 of GAE PC), that could be employed in the development of new food products with an enrichment in the crop cost, due to the lower consumable and practicality of this sample.

