


 English (pdf)
 Article in xml format
 Article references
 Send this article by e-mail
 Cited by SciELO
  Cited by Google
  Similars in
SciELO
Similars in
SciELO  Similars in Google
 Permalink
Global water use has increased by a factor of six over the past 100 years and continues to grow at a rate of about 1% per year as a result of increasing population, economic development, and shifting consumption patterns. Combined with a more erratic and uncertain supply, climate change worsens the current water-stressed situation of regions and generates water stress in regions where water resources are still abundant today. Physical water scarcity (WS) is often a seasonal phenomenon, rather than a chronic one, and climate change is likely to cause shifts in seasonal water availability throughout the year in several places (UNESCO, 2020). Around 1.6 billion people, or nearly a quarter of the world's population, face economic water shortage, which means they lack the necessary infrastructure to access water (UN-Water, 2014; UNESCO, 2020). The number of people tackling low, moderate, significant, and severe WS during a given number of months per year at the global level is about 71% of the global population (4.3 billion people), who live under conditions of moderate to severe water scarcity (WS>1.0) at least 1 month of the year, and about 66 % (4.0 billion people) live under severe water scarcity (WS>2.0) at least 1 month of the year. The number of people facing severe WS for at least 4 to 6 months per year is 1.8 to 2.9 billion. Half a billion people live severe WS all year round. Of those half-billion people, 180 million live in India, 73 million in Pakistan, 27 million in Egypt, 20 million in Mexico, 20 million in Saudi Arabia, and 18 million in Yemen (Mekonnen and Hoekstra, 2016).
From the different sectors of the worldwide economy, agriculture is the most sensitive to WS (FAO, 2013). This sector is occasionally considered as a "wasteful" water user after the domestic and industrial sectors accounting for 70% of global freshwater use and more than 90% of consumptive use. However, it is also the sector with the most possibilities for adjustment options (FAO, 2013). The extraction of water for different agricultural processes has a direct relationship with greater consumptive use as after the agricultural use, it is not available for other uses because it is contaminated or evaporated (Perry, 2007).
Cultivation and production of coffee are stages that have a significant environmental impact, which is especially attributed to the consumption and contamination of water (water footprint). Moreover, coffee is one of the crops with the greatest water footprint compared to others, such as wheat, corn, soybeans, sugar cane, and cotton, in terms of the volume of water consumed and polluted per quantity produced but also it has an especially high green water footprint (WFgreen) due to its water consumption and a high gray water footprint as a result of the wet-processing method required by this crop (Arévalo and Sabogal, 2012; Arévalo and Campuzano, 2013; IDEAM, 2015; Martins et al., 2018).
The water footprint is a measure of the appropriation of freshwater by humans in volumes of water consumed or polluted. This indicator is used to evaluate the amount of direct and indirect water used and contaminated to generate a product or service (Hoekstra et al., 2011).
On the other hand, coffee is historically and culturally Colombia’s primary product and the main national crop in terms of growing area, with approximately 24% of the total area of the country under coffee cultivation in 20 of the 33 Colombian departments. It represents approximately 2% of the national Gross Domestic Product (GDP) and 22 % of agricultural GDP (Federación Nacional de Cafeteros de Colombia, 2015). This is one of the main export products and contributes 8% to the total exported value of the country, generating more than 500,000 direct jobs that correspond to 36% of total agricultural employment (Ciro et al., 2011). Moreover, Colombia is the third-largest coffee exporter country in the world, according to the International Coffee Organization (2021).
In this context, this paper aimed to determine the water footprint of coffee production in Colombia and conduct a sustainability analysis of this water footprint, including the entire production process, from cultivation through the production of dry parchment coffee, which is the final export product. This information can help to identify, at the national level, the impacts associated with the water footprint of coffee production, its sustainability, and ways to address the associated impacts.
MATERIALS AND METHODS
Study site
For this study, four Colombian departments with a long coffee tradition (Antioquia, Cauca, Caldas, and Quindío) were selected. These departments were chosen based on the fact that they are representative of the entire country in terms of coffee production and with a wide range of environmental conditions of the coffee zone in Colombia (Table 1).
Table 1 Basic information related to the departments, meteorological stations used in the calculations of coffee cultivation and their environmental conditions.
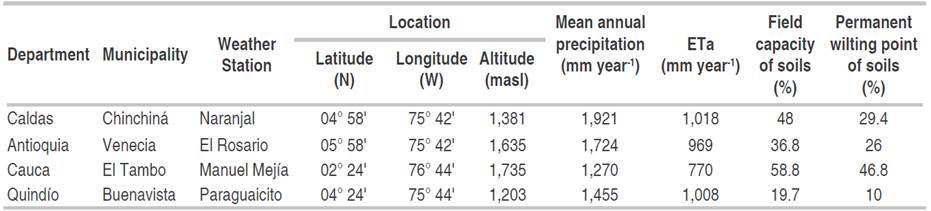
Source: Cenicafé (2011-2020) and Ramírez et al. (2010).
Calculation and analysis of the water footprint
The methodology of the Manual for Water Footprint Assessment of the Water Footprint Network (WFN) (Hoekstra et al., 2011) was used to calculate the water footprint of coffee production in Colombia. The total water footprint (WF) is the sum of the green, blue, and gray components, as shown in Equation 1:

The WFgreen corresponds to the volume of rainwater that does not become runoff, is stored in the soils satisfying the demands of the vegetation. This shallow groundwater allows the existence of natural vegetation, and it returns to the atmosphere through the processes of evapotranspiration. The WFgreen for an agricultural crop corresponds to the actual evapotranspiration of the respective crop in a defined study area and evaluation period. Therefore, to calculate the WFgreen component in this study was necessary to determine the actual evapotranspiration of the coffee crops in Colombia.
To estimate the actual evapotranspiration (ETa) of the coffee crops in the different producing areas of the country, the methodology developed by Cenicafé was applied, which is based on the study of moisture balance in the soils of Colombian coffee growers, especially those under shaded systems and those with an open exposure (Jaramillo, 2006). The reference evapotranspiration (ET0) was estimated from the expression of García and López (1970) that was modified by Jaramillo (1982) (Equation 2),
where RH=relative humidity (%), T=temperature (°C), both are given in daily means and n=(7.45T)x(234.7+T)-1.

The potential evapotranspiration (ETp) of the crop is mandatory to calculate ET0, which was estimated by Equation 3 and 4 (Ramírez et al., 2010), where EV=evaporation (mm), PP=precipitation (mm) and Kc=crop coefficient. As this Kc has not been measured for Colombia, therefore, the value reported by (Ramírez et al., 2010) were used in this case, given the planting density and age of the plants.


The crop coefficient Kc was estimated based on the age and planting density, as proposed by Ramírez et al. (2010). ρ is the adjustment to the evapotranspiration by soil moisture (Equation 5).

Where θi is the soil moisture of the previous day, and θs the saturation moisture. When the estimation of ρ<0.35, the crop evapotranspiration is lower than the atmospheric demand due to a lack of water in the soil, and its value is that given by the estimate; on the contrary case, the estimation uses ρ=1.
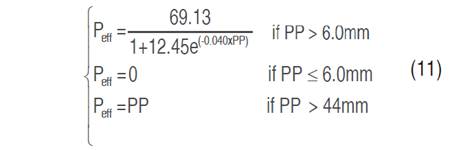
The actual crop evapotranspiration (ETa) was estimated using the water balance model of Thornthwaite-Mather and modified by Jaramillo (2006) (Equation 4). This equation was applied in conjunction with the expressions of Equation 6 to Equation 11, where Peff=effective precipitation (mm), Erun=runoff (mm), θv.cc=volumetric soil moisture at field capacity or water retained at -33 kPa (%), θv.pmp=volumetric soil moisture at the permanent wilting point or water retained at 1.500 kPa (%), C.W.=water storage capacity, RDe=effective root depth, S.M=stored moisture, and C.N.=cumulative negative function. Under the condition that when the water retained in the soil in the effective range of the roots equals the retention capacity, the crop transpires at maximum capacity (ETa=ETp), and the above equations, which are given in terms of effective precipitation (Peff), correspond to the condition of open crop exposure. This condition was assumed because it is the most unfavorable scenario concerning crop evapotranspiration (compared to a shaded condition). The details of the expressions described above can be found in Jaramillo (2006); Ramírez et al. (2010).


The effective root depth was considered to be 0.50 m, given that this part of the soil profile represents 96% of the absorbing roots and more than 89.9% of the total roots, although the roots of a coffee plant can be as deep as 1.0 to 1.5 m (Pulgarín, 2007).
The temperature and rainfall information were extracted from the Coffee Meteorological Calendar from 2010 to 2019 from four stations located in the Colombian coffee zone (Cenicafé, 2011-2020). Based on this information, the actual daily evapotranspiration of the crop was estimated using the previously referenced expressions developed for the Colombian coffee zone.
The field capacity and permanent wilting point values used in this study are presented in Table 1 (Ramírez et al., 2010). A crop coefficient value of Kc=1.1 was taken from the above calculation period, corresponding to a mature and dense coffee plantation, (Ramírez et al., 2010).
In the case of coffee, ETgreen (the actual green total evapotranspiration) was assumed as the value of ETa because for the period in which the water balances were carried out (at daily scale), ETgreen corresponds to the relationship between the effective precipitation, the crop evapotranspiration, and the soil moisture content, which has great importance to how the crop transpires, and ETa considers these three mechanisms.
To evaluate the sustainability of coffee production in Colombia, in terms of its WFgreen, the green WS was calculated as the ratio of WFgreen to green water availability, here considered as annual rainfall.
The minimum coffee productivity reported for the study period was 0.76 t ha-1 in the department of Cauca in 2013. The maximum was 1.56 t ha-1 in the department of Antioquia in 2019, while the total average productivity was 1.10 t ha-1.
The blue water footprint is the volume of water extracted from a surface water or groundwater source and consumed to produce goods and services to cover an unsatisfied water demand due to a deficit in the availability of rainwater.
The gray water footprint of agricultural production, which is an indicator of the volume of water pollution, was calculated by quantifying the volume of water necessary to assimilate the nutrients that reach the ground or surface waters due to the leaching of nutrients from crops is the main pollutant from non-point sources of surface water and groundwater bodies. To calculate the gray water footprint in coffee cultivation, the contamination of the water resource due to the application of fertilizers was taken as a reference. Pesticides and other agrochemicals were not considered because, in Colombia, there is no information about them. The calculation of the gray water footprint for coffee cultivation was performed only by nitrogen (N) contamination because phosphorous, which is applied as a fertilizer that is not absorbed by the plant, generally accumulates in the soil, and only a very small fraction is transported to subsurface water and groundwater sources (Ercin et al., 2011).
For the calculation of the gray water footprint of the coffee crop from nitrogen fertilization, the following information was considered:
Nitrogen application range in coffee crops from 28 to 154 kg ha-1 year-1, although the recommended amount is 300 kg ha-1 year-1 (Cenicafé et al., 2015). In this study, the maximum value applied by farmers (154 kg ha-1 year-1) was used.
Nitrogen leaching rate: 10% of the total nitrogen applied (Ercin et al., 2011).
The maximum allowable concentration of nitrogen, Cmax (kg m-3)= 2 mg L-1 (Área Metropolitana del Valle de Aburrá, 2011).
The natural concentration of nitrogen, Cnat= 0 mg L-1. When natural concentrations are not known, but it is estimated that they are low, it can be assumed that Cnat = 0 for simplicity (Hoekstra et al., 2011).
Productivity of coffee cultivation in Colombia: 1.10 t ha-1 (Agronet, 2021).
For the calculation of the gray water footprint (WFgray) in m3 ha-1, the amount of applied fertilizer or load (L) (in kg ha-1 of nitrogen) is divided into the difference between the maximum allowable concentration and the natural concentration (Cnat of N, kg m-3) according to the following expression:

The value obtained from Equation 12 is divided by the crop yield (t ha-1). In this way, the amount of water required (m3 t-1) to dilute the pollutant load of nitrogen is obtained.
Wet coffee processing is a sequence of operations performed to transform the coffee cherry (from the crop) into dry parchment coffee (the export product). Thus, to obtain 1 kg of parchment coffee, approximately 5 kg of coffee are required. The present study analyzed three existing technologies in Colombia for wet coffee processing: conventional, ecological (Becolsub® and Ecomill®), and natural (dry process) methods. The conventional coffee mill uses approximately 40 L of water per kg of coffee produced (between transport and washing), the Belcosub® mill consumes 5 L kg-1 in the transportation of the grain and between 0.50 and 1.00 L kg-1 in the wash (in this study 1.00 L kg-1 were used), the Ecomill® mill consumes 5 L kg-1 in transport and between 0.30 and 0.50 L kg-1 (0.50 L kg-1 were used for the calculation) and the natural mill is done completely dry and does not use water (Cenicafé, 2015). The present work included the calculation of the WF blue and gray for coffee processing by the following Equation 13 and 14 respectively:

For the calculation of the blue water footprint of the coffee mill, around 10% of its demand was considered, according to Ariza and Arevalo (2018), for a study of the water footprint in coffee farms in Colombia.

Where:
Ceff is the effluent concentration.
Cact is the current concentration of the water source.
Cmax is the maximum acceptable concentration in the water source.
Cnat is the natural concentration of contaminants in water, without intervention by humans.
Effl is the effluent of the process.
The natural concentrations of each parameter in the surface water sources of the coffee zone are low, specifically in those sites where this study was carried out. Therefore, the Cmax, or maximum acceptable concentration, was determined as the value defined by the regional environmental authority (Área Metropolitana del Valle de Aburrá, 2011) in the water quality targets for the Aburrá River; these targets propose a BOD5 (Biological Oxygen Demand) value between 5 to 100 mg L-1 according to the section of the river where the discharge takes place (Área Metropolitana del Valle de Aburrá, 2011). For this study, the Cmax value was taken as a BOD5=5 mg L-1, and Cnat was taken as a BOD5=0 mg L-1, considering this latter when the natural concentrations of a given water quality variable are not known with precision but are estimated to be low, it can be assumed that Cnat=0 for simplicity. However, this will result in an underestimated WFgray when Cnat is not truly equal to zero (Hoekstra et al., 2011). For Ceffl, the permissible limits of the applicable discharge standard (Ministerio de Medio Ambiente, 2015) were taken for the respective activity, for the traditional processing BOD5=400 mg L-1 and ecological one BOD5=1,449 mg L-1 (based on the calculation of the limit permissible for COD and a biodegradability ratio of the process discharges of 2.07 (Cenicafé, 2015).
From the results of the water requirements of the coffee crop in Colombia for the study sites during the period between 2010 and 2019, the water footprint of the crop was calculated for the respective departments, by using data on coffee crop productivity or yield reported from each department.
RESULTS AND DISCUSSION
Tables 1 and 2 show the results of the actual evapotranspiration calculation and the water requirements for the cultivation or production of coffee in the four Colombian departments with a wide-ranging coffee tradition between 2010-2019. According to this information, there are marked differences between the locations, with actual total evapotranspiration values between 770 and 1,018 mm year-1 (Table 1) and crop water requirement values between 6,848 and 10,944 m3 ha-1 (Table 2).
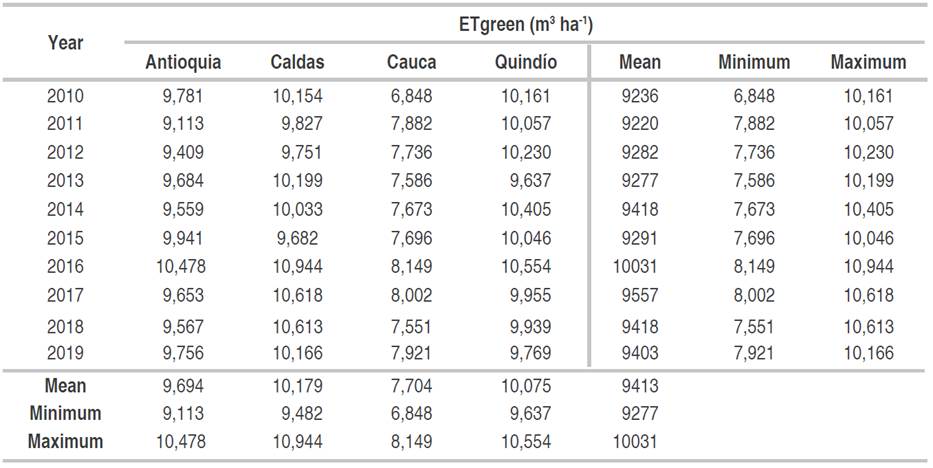
Considering the results of the water requirements of the coffee crop in Colombia for the departments of Antioquia, Caldas, Cauca, and Quindío for the period between 2010 and 2019, as shown in Table 2, and the productivity or yield of the coffee crop for each department and the same period, as shown in Table 3, the results of WFgreen of coffee cultivation in Colombia for the four departments between 2010 and 2019 are shown in Table 4.
Table 3 Production and productivity of coffee cultivation in the selected departments.
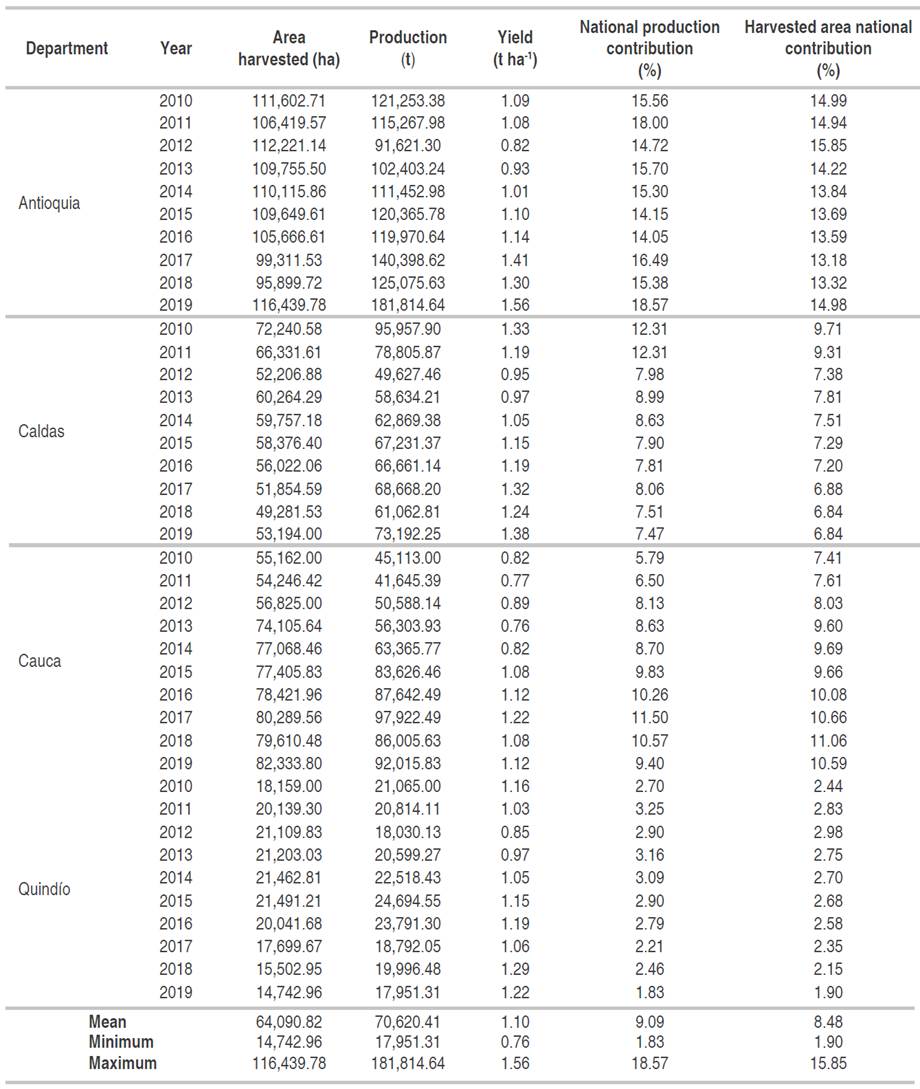
Source: Agronet (2021)
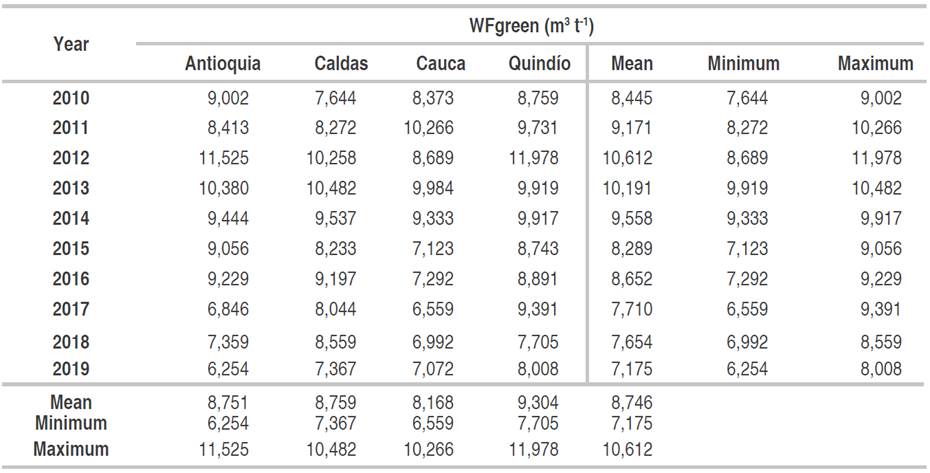
According to the results shown in Table 4, the WFgreen of the coffee crop for the sites and the study period varied between 6,254 m3 t-1 (in Antioquia - 2019) and 11,978 m3 t-1 (in Quindío - 2012). The department with the lowest mean water footprint was Cauca, with 8,168 m3 t-1, and the department with the highest mean WFgreen was Quindío, with 9,304 m3 t-1. There is a marked correlation between WFgreen and actual evapotranspiration, considering that the places with the lowest and highest green water footprint are also those with the lowest and highest average evapotranspiration for the study period (Table 4). Cauca showed the lowest values of evapotranspiration (Table 2) but also observed the lowest annual values of WFgreen, while Quindío showed the highest values for these two variables during the study period and departments.
The mean WFgreen of the coffee crop in Colombia for the study period indicated that the lowest WFgreen was 7,175 m3 t-1 in 2019, the highest was 10,612 m3 t-1 in 2012 and the mean green was 9,274 m3 t-1. These results coincide with the occurrence of La Niña phenomenon in 2011 and 2012, when WFgreen was considerably higher for all departments studied (Table 4), except for Cauca where this phenomenon was very week, while during El Niño event (2018 and 2019), the WFgreen was the lowest observed during the studied period for most departments, region where was observed a less reduction on precipitation during these years (NOAA, 2021) through the quarterly average of the Oceanic Niño Index (ONI, 2021). When analyzing the results of the WFgreen of the coffee cultivation in Colombia with the reports of the climatic phenomena La Niña as a highlighted event, there is a tendency to reduce the water footprint and when a marked incidence of El Niño is presented, a tendency to increase the water footprint is noted. This could be explained because of the increase in rainfall and decrease in temperature, and therefore, in the evapotranspiration of the crop, while during El Niño rainfall decreases and increases in temperature and evapotranspiration; conditions that affect the use and contamination of water by coffee production.
Results from the green WS calculations for the studied departments in Colombia indicated that although WS varies within regions and among years, values were always over 4, with an average of 6.4±1.6. This implies that for the rainfall conditions in the coffee production region in Colombia, the WFgreen is relatively low, and coffee production under these rainfall conditions is environmentally sustainable.
The behavior of the WFgreen of the coffee crop in the four departments over time is very similar, except for Cauca, where WFgreen is the lowest. This seems to be related to the noticeably low evapotranspiration and the not markedly low crop productivity compared to the average.
Due to the high rainfall in the coffee-growing areas of Colombia, which is generally sufficient for the development of this crop, additional irrigation is not required or applied to coffee crops, thus, the supply of water to coffee crops in Colombia is an exclusive function of rainfall. Nevertheless, as it can be seen in Figure 1 (A, B, C, and D), in some periods, and almost in the four weather seasons, the crop water needs were not met, and the difference between precipitation and evapotranspiration has been increasing, which implies that in the future irrigation must be considered.
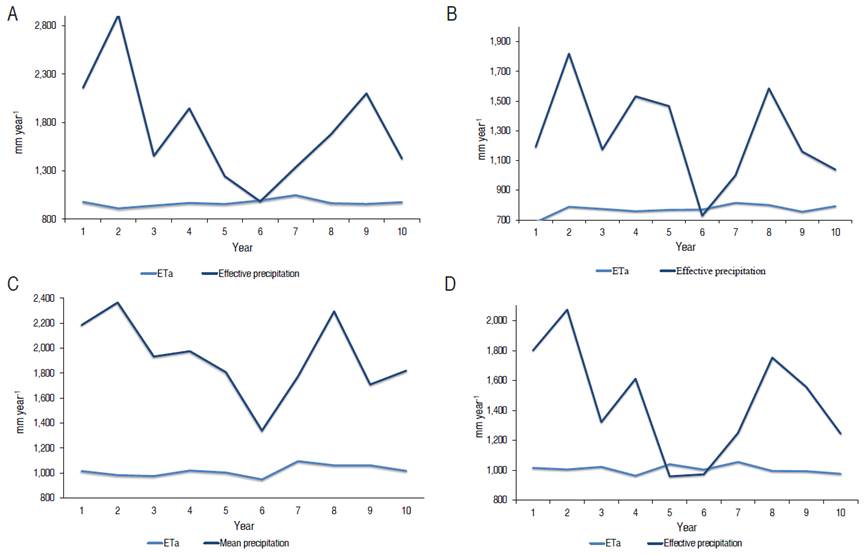
Figure 1 Mean precipitation vs. actual evapotranspiration of the crop in: A. Antioquia, B. Cauca, C. Caldas, D. Quindío.
According to Herrón (2013), a coffee plant requires for its normal growth an annual rainfall between 1,500 to 3,000 mm, depending on its geographical location (latitude and altitude) and the type of soil (texture and structure). Moreover, the water requirement from the coffee plant is approximately 125 mm month-1; likewise, daily evaporation fluctuates (Andean zone) between 90 and 120 mm day-1. When analyzing a potential coffee zone, without irrigation possibilities, it can be concluded that if the annual water balance, expressed in terms of the difference between the total annual rainfall and the annual evaporation is 150 mm year-1 or more, the region is considered suitable for coffee cultivation; otherwise, the region is not. Therefore, irrigation options in certain months of the year should be studied in non-traditional coffee growing areas, where the amount of rainfall does not satisfy the water demand.
Therefore, WFblue for coffee cultivation in Colombia can be considered to be zero or negligible concerning the other two components of the water footprint (green and gray), according to the applied methodology (Hoekstra et al., 2011).
The WFgray per unit of cultivated area (Equation 13) was around 7,700 m3 ha-1, assuming mean productivity of coffee in Colombia of 1.10 t ha-1 for the area and study period, which leads to a gray water footprint of coffee cultivation in Colombia of approximately 7,000 m3 t-1. Table 5 presents the results of the water footprint for the wet processing of coffee in Colombia.
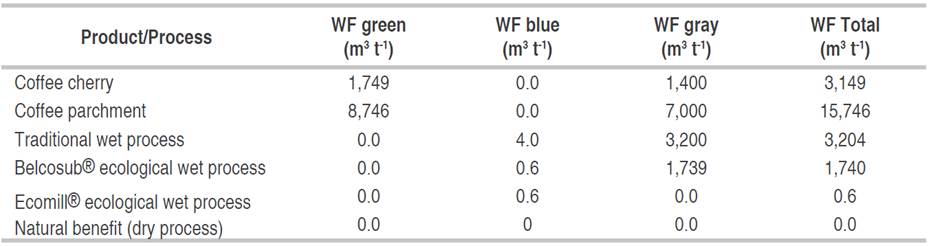
The WFgreen of the crop was 8,746 m3 t-1. The crop has no WFblue, as it does not require irrigation, and the WFgray was 7,000 m3 t-1. If the traditional wet-processing method is used, the WFblue is 4 m3 t-1 and the WFgray is 3,200 m3 t-1, while if the ecological Becolsub® technology is used, the WFblue is 0.60 m3 t-1 and the WFgray is 1,739 m3 t-1.
For the Ecomill® technology, the WFblue is 0.55 m3 t-1 and does not have WFgray because it does not generate any polluted water, according to the local environment water quality standards, and the little leachate, which is produced and reincorporated into the process. This implies that the Becolsub® ecological processing method reduces the water footprint by 45.7% and 99.9% with the ecological Ecomill® process (no wastewater discharge) compared to traditional wet processing technology. The natural processing of coffee is a totally dry process, it does not use water to transport and wash the coffee and it does not generate spillage; therefore, it does not have a water footprint. Nonetheless, it is no longer a widely used practice.
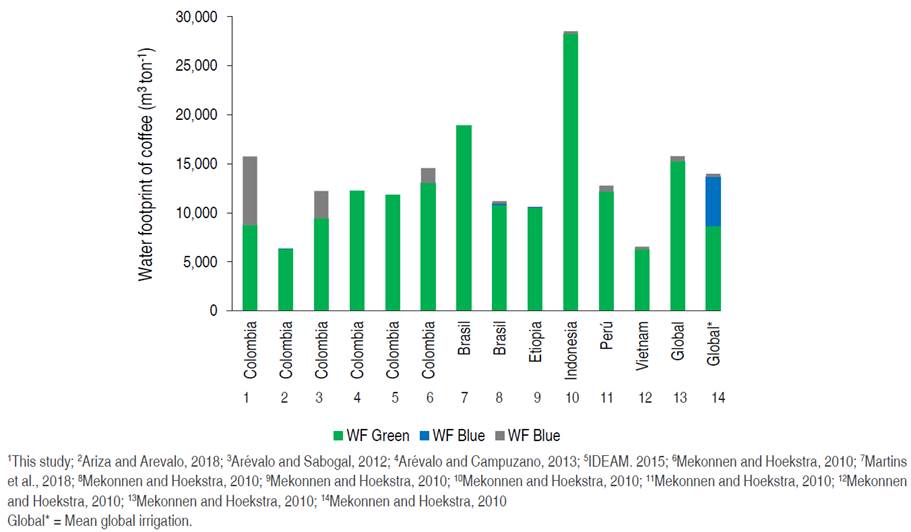
A comparison of the estimates obtained in this study with those from other coffee producer countries (Figure 2), shows that the order of magnitude is similar in all studies. According to the studies reviewed for the green and blue water footprint of coffee cultivation in Colombia, were estimated range between 6,328 and 13,033 m3 t-1, and the results of this study are at the lower range (8,746 m3 t-1).
Source: Mekonnen and Hoekstra (2010)
Figure 2 Comparison of values for water footprint of coffee production found in this study with those from other studies in Colombia and other coffee-producing countries around the world.
Only 3 of the 6 studies of the water footprint of coffee in Colombia analyzed in this study published results of the gray water footprint, with data of 1,533 m3 t-1 (Mekonnen and Hoekstra, 2010), 2,778 m3 t-1 (Arévalo and Sabogal, 2012) and the present study with the highest value reported (7,000 m3 t-1).
When comparing the water footprint obtained in the present study with those obtained by Mekonnen and Hoekstra (2010) for the main coffee-producing countries (Figure 2), Colombia has the second-lowest water footprint for coffee cultivation in the five main producing countries. There is a strong inversely proportional relationship between the coffee crop productivity at each study site and the water footprint, where the lowest water footprint was reported in Vietnam, which reported the highest crop productivity (1.85 t ha-1) for 1996-2005. The largest water footprint was in Indonesia (28,520 m3 t-1), with the lowest crop productivity (0.51 t ha-1) for the years 1996-2005. When comparing the results of the water footprint of the coffee crop obtained in this study with the global average, differences were found since the global average with irrigation is 0.20% lower and without irrigation, it is 11% higher than in this research. This difference between the global mean coffee cultivation with and without irrigation indicates a greater efficiency in water use and contamination in the technology with irrigation; however, the real impact on the resource will depend on the situation of each location in terms of the availability of green and blue water.
According to the above results, the coffee productivity in Vietnam (1.85 t ha-1) is 3.6 times higher than in Indonesia (0.51 t ha-1) and almost 2 times higher than in Colombia (1.10 t ha-1), and its direct effect on the water footprint in the cultivation of this product is evidenced, given that the mean precipitation of the main coffee producers is similar, except for Ethiopia, which is considerably lower than that of the other countries included in the analysis.
Although there are differences in the results of these studies, they all agree with the dominant role of the WFgreen in the global production of coffee. The differences in the results of the reviewed studies may be due to a variety of causes, including the type of model, the spatial resolution, the period considered and the data related to cultivated and irrigated surfaces, growth periods, crop parameters, soil, climate and the season for which the water footprint was calculated. Some studies use a calculation for a specific base year, and other studies (e.g. this study) use a mean calculation for a given time range, making a comparison of the results complex.
The WFgreen of the coffee crop, at the national scale, corresponds approximately to 0.55% of the total available green water in the country (IDEAM, 2015), indicating that the WFgreen of the coffee in Colombia is sustainable.
Additionally, the traditional wet-processing of coffee (the process after cultivation), reported a WFgray of 3,200 m3 t-1and the blue water footprint is about 4.0 m3 t-1 and it does not have a WFgreen because rainwater is not used in this process. The Ecological wet-processing with the Belcosub® technology has a WFgray of 1,739 m3 t-1 and a WFblue of 0.60 m3 t-1 and with the Ecomill® technology, the WFgray is 0.55 m3 t-1 and does not have WFblue because it has no sewage discharge. Out of the six largest coffee producer countries in the world, Colombia ranks second in terms of coffee’s WFgreen.
To sum up, the water footprint of coffee depends on the climate and yields per hectare at the specific site of production. The latter is due to the climatic conditions of each site but also the soil conditions and management practices; therefore, the water footprint of the coffee crop can vary markedly depending on the location and the evaluation period.
CONCLUSIONS
The water footprint of coffee cultivation in Colombia is about 8,746 m3 t-1 for the WFgreen, 7,000 m3 t-1 for the WFgray (due to leaching of fertilizers to water sources), and does not have a blue water footprint, given that the coffee-growing sites of Colombia do not require irrigation because the water requirements are supplied with annual rainfall
The conventional coffee mill has a WFblue of 4 m3 t-1, a WFgray of 3,200 m3 t-1, and does not have WFgreen because generally the mill does not incorporate atmospheric water in the process or is insignificant. The ecological Belcosub® coffee mill has a WFblue of 0.60 m3 t-1 and a WFgray 1,739 m3 t-1, while the ecological mill Ecomill® has a WFblue of 0.55 m3 t-1 and does not have WFgray because it has no discharges (few leachates are generally used as fertilizer for cultivation). The natural benefit of coffee is a totally dry process, it does not use water to transport and wash the coffee and it does not generate spillage; therefore, it does not have a water footprint, however, it is no longer a widely used practice.
Finally, the WFgreen of the coffee crop in Colombia, at the national scale, corresponds approximately to 0.55% of the total available green water in the country, indicating that the WFgreen of the coffee in this country is sustainable.

