


 English (pdf)
 Article in xml format
 Article references
 Send this article by e-mail
 Cited by SciELO
  Cited by Google
  Similars in
SciELO
Similars in
SciELO  Similars in Google
 Permalink
In Colombia, coffee is mainly processed wet, through sub-processes that include pulping, fermentation, washing, and drying of the beans. The bioclimatic conditions of the facilities where these processes take place can be decisive for both the comfort of the workers (Guerra-García et al., 2019) and the quality preservation of dry parchment coffee. The coffee is often stored there for a long time (sometimes exceeding two weeks), where a large amount of heat and steam is generated by the machines during mechanical drying (Osorio et al., 2018; Osorio et al., 2020).
On the one hand, according to Todd and Valleron (2015), the heat generated by humans increases with increasing physical activity. Roscani et al. (2017) and Gutiérrez et al. (2018) stated that the combination of this situation with a stressful thermal environment can result in considerable occupational hazards. Workers in the wet coffee process develop physically demanding activities, in a hot and humid environment, which can generate heat stress, weakness in the general state of health, alterations in psychosensory reactions, and decreased productivity (Roscani et al. 2017; ISTAS-C, 2017; Gutiérrez et al. 2018).
For the evaluation of workers' hygrothermal environment, the Ministry of Labor and Social Security of Colombia proposes that the appropriate temperature range should be between 14 and 25°C, and the relative humidity between 30 and 70%. For a more complete comfort analysis, the use of comfort indices is required.
To evaluate human performance in work under conditions of exposure to heat, different standards have defined the use of the Wet Bulb Index and Globe Thermometer (WBGT). Among them, Resolution 2400 of 1979 establishes some provisions on housing, hygiene, and safety in the workplace in Colombia (MTSS, 1979), the international standard ISO 7243, (1982) estimates the heat stress of workers, as well as the Brazilian regulatory standard - NR 15, attachment n. 3 (ABNT-NBR, 2011). These last two standards also establish the lines for calculating the WBGT index, in addition to proposing its limits.
The WBGT index is an indicator of thermal comfort that considers air temperature, metabolism, radiant heat, air velocity, and relative humidity as the main drivers of thermal overload (MTSS, 1979; ISO 7243, 1982; ABNT-NBR, 2011; Roscani et al. 2017). Guerra-García et al. (2019) used this index for comfort analysis in coffee post-harvest facilities in Colombia, obtaining satisfactory results.
On the other hand, the quality of dry parchment coffee can be compromised during storage due to the hygrothermal conditions of the environment. According to Puerta (2016), The quality of dry parchment coffee stored in Colombia, with humidity between 10 and 12% in the bean, can be preserved for a maximum of six months, with an air temperature below 20 °C and relative humidity between 60 and 70%. Different environmental conditions ultimately affect the taste and quality of the coffee drink.
Studies on the bioclimatic performance of facilities for wet coffee processing are few. The available literature suggests that these buildings present unsuitable storage environments that can affect the quality of the coffee (Osorio et al., 2020). Additionally, there is very little research that evaluates the thermal comfort of workers within post-harvest facilities (Guerra-García et al., 2019). According to Herrera et al. (2015), this is a widespread problem in the food industry, mainly in Latin America and the Caribbean.
Computational simulation has become a useful tool for the design and bioclimatic evaluation of buildings since it allows the analysis of mass and energy transfer phenomena, internal loads, occupancy patterns, transitory analysis, among others (Al-Saadi and Al-Jabri, 2020). However, in the evaluation of the built environment, the computational simulation models must be validated with experimental data to obtain reliable results.
One of the most internationally recognized bioclimatic and energy simulation software for buildings is EnergyPlusTM. This open-source software, developed by the US Department of Energy (DoE), is capable of simulating long periods of time with the help of local weather files. The EnergyPlusTM program is a collection of many program modules that work together to calculate the energy required for air conditioning of buildings using 3D geometries, climate files, internal loads (machines and metabolism), usage patterns, thermal properties of materials, among others (DoE, 2019).
The EnergyPlusTM software allows generating computational models to evaluate the bioclimatic performance of coffee post-harvest facilities (Osorio et al., 2018), seeking solutions that benefit both the conservation of parchment coffee and the thermal comfort of the worker (Guerra-Gracía et al., 2019). This study aimed to evaluate the bioclimatic performance of three wet coffee processing plants in Colombia, focused on the comfort conditions of the workers and the environmental conditions for the conservation of parchment coffee.
MATERIALS AND METHODS
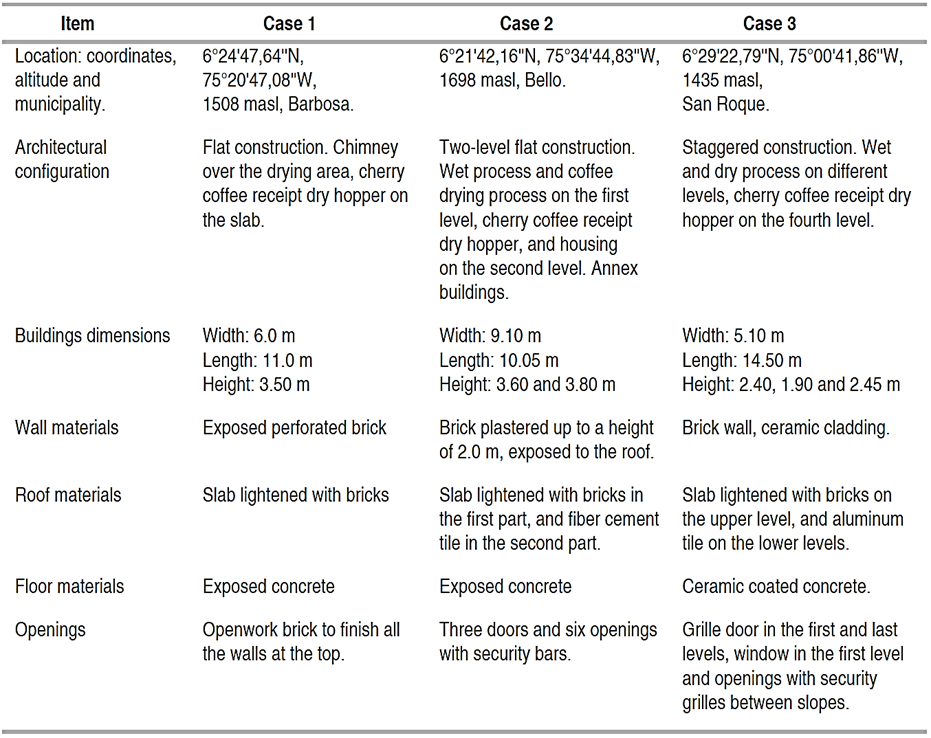
Three case studies corresponding to three wet coffee processing facilities were compared, which from now on will be called case 1, 2, and 3. Except for their architecture, the three cases have similar geographic location conditions (municipalities of the north region of Antioquia - Colombia), mechanical drying, annual production of 30 t of dry parchment coffee, and peak production in November. Table 1 summarizes the description of the location and architectural details of the three case studies.
Data of air temperature and relative humidity inside the three study cases were collected employing an Extech Instruments datalogger of the RHT20 brand, using a temperature measurement interval between -40 and 70 °C with a resolution of 0.1 °C, as well as a range between 0 and 100% relative humidity, with a resolution of 0.1. The collections were carried out every 5 min during three continuous days in each case, in November 2016, by fixing the equipment in the geometric center of each installation.
The computational simulation analysis was carried out in the EnergyPlusTM program, based on the weather file of the city of Medellín, due to its availability, proximity (linear distance from Medellín to Bello 12 km, Barbosa 34 km, and San Roque 65km), and a similar climate to the location zones of the facilities under study (DesignBuilder, 2017).
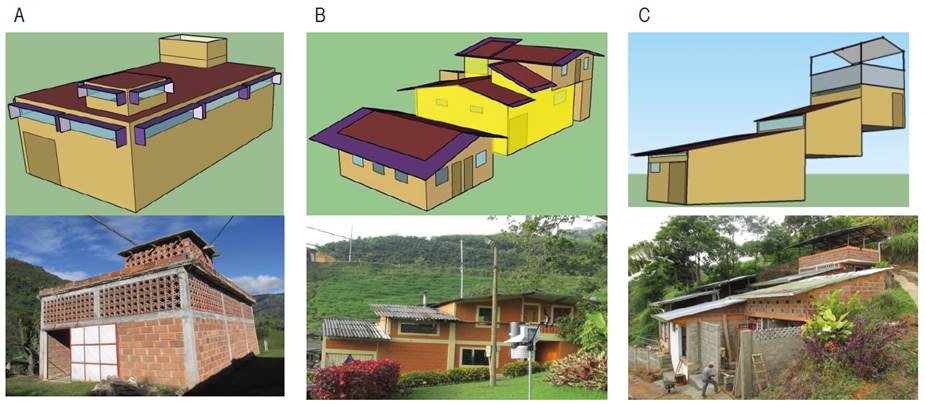
For the simulation model, a 3D geometry of each case study was elaborated in the Sketchup® software. With the help of the OpenStudio plugin, thermal zones were created. Finally, files with an idf extension were generated for each case (Figure 1).
The thermal properties of construction materials such as density, thermal conductivity, and specific heat were obtained from the ABNT-NBR 15220-2 (2005). To simplify the 3D model in case 1, the areas with openwork brick were assumed as windows, adding sun protection to simulate interference with light (Osorio et al., 2016). The mass of the material composed of brick and concrete, constituted by stairs, hydraulic classifier, and fermentation tanks was quantified and added to the immediate wall, to consider the effect of thermal inertia in the three cases.
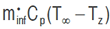
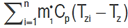
For the calculation of the energy balances (Equation 1), the internal loads were considered: powers of the coffee processing equipment (pulping machines and mechanical drying), and the luminaires (Table 2). Likewise, the heat generated from the human metabolism was considered as 440 kcal h-1 (512 W), corresponding to an intermittent work of lifting, pushing, or dragging weights (ABNT-NBR, 2011).

where,
 : Sum of internal convective loads (w);
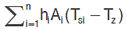 : Convective heat transfers from area surfaces (w);
 : Heat transferred through the grooves (w);
 : Heat transfer due to interzone air mixing (w);
 : Air systems outlet (w);
 : Stored energy (w);
 :
: 
 : Zone air density (kg m-3);
: Specific heat of the air (J kg-1 °K-1);
: Sensible heat capacity multiplier (J kg-1 °K-1).
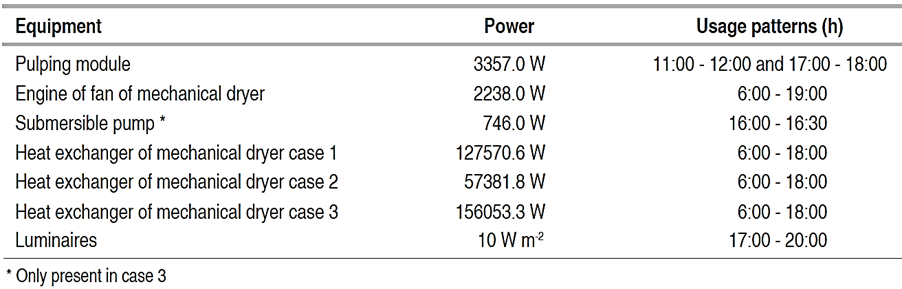
The simulation was carried out for the entire month of November in each case, from hour to hour, to determine the bioclimatic performance of the facilities during the peak period of coffee production, specifically for analyzing the conditions for the workers and parchment coffee. Table 3 shows the schedules used for the computational simulation in EnergyPlusTM.
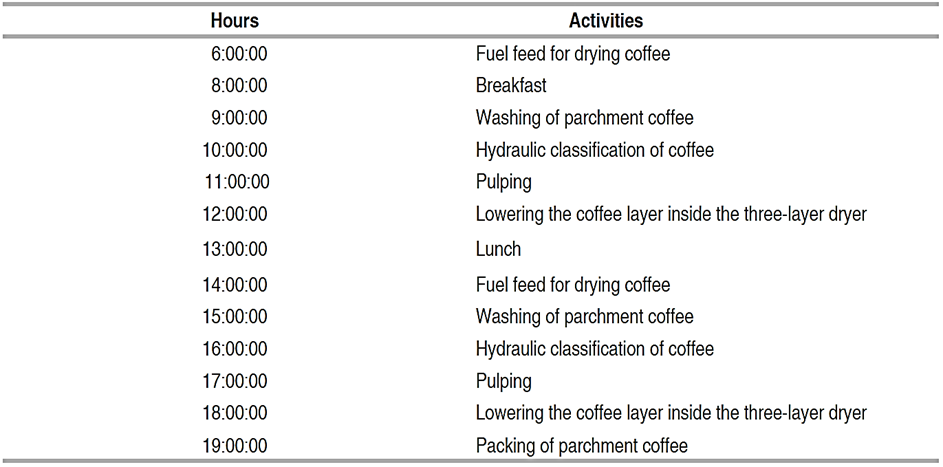
For the validation of the computational model, the experimental data (720 data) of temperature and relative humidity of the air was used to calculate the Normal Mean Square Error (NMSE) (ASTM, 2002) (Equation 2). NMSE values less than 0.25 are considered acceptable and good indicators of concordance. The agreement between the experimental values and the simulated values increases as the value is closer to zero.
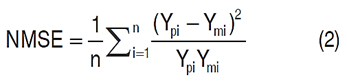
where Ypi is the predicted value, Ymi is the measured value, and n is the number of data.
Equation 3 was used to analyze the WBGT index in the three case studies from the simulations. It is suitable for the evaluation of internal environments (without solar load), according to NR 15, annex n. 3 (ABNT-NBR, 2011).
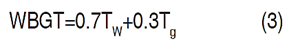
Where:
TW: Natural wet bulb temperature, °C; and
Tg: Black globe temperature, °C.
Since EnergyPlusTM provides no output data for the WBGT index, it was calculated from other output data that can be obtained through the software: the black globe temperature (Tg) was cleared from the Radiant Mean Temperature (TRM) equation, proposed by Fanger (1972). In Equation 4, TRM, Tdb and Va are data provided by the software.
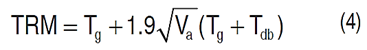
Where:
Tg: Black globe temperature, (°C);
Tdb: Dry bulb temperature, (°C); and
Va: Air speed, (m s-1).
The Wet Bulb Temperature was obtained by Equation 5 (Stull, 2011), using data of Tdb and relative humidity of the air, supplied by EnergyPlusTM.
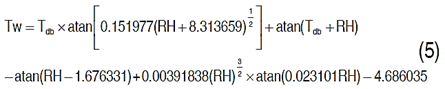
Where TW: wet bulb temperature, (°C); Tdb: dry bulb temperature and RH: relative air humidity (%).
The tolerance limits of workers to heat exposure based on the WBGT index (°C) were determined by considering the most repetitive work in the three study cases, that is, lifting, pushing, or dragging heavy loads, with a metabolic rate of 440 kcal h-1 (512 W), classified as heavy according to (ABNT-NBR, 2011). Based on these parameters, it was determined that the limit for the WBGT index of heavy activity, developed continuously during 1 h is 25 °C (ABNT-NBR, 2011).
The WBGT index and hygrothermal behavior of the three study cases and of these cases with the external environment according to the simulations were compared using hourly data of November 2016. For this comparison, box plots were made for the three cases.
Results were compared with the temperature of 20 °C and relative humidity of the air between 65 and 70% recommended by Puerta (2016) to preserve the quality of the stored dry parchment coffee.
RESULTS AND DISCUSSION
Table 4 shows the results of validation of the models for the dry bulb temperature and relative humidity of the air, in the three study cases. The value of the NMSE in the three cases is less than 0.25, that is, the models represent the real conditions (ASTM, 2002), as well as the agreement between the measured and simulated temperature data for the three cases is observed in Figure 2.
Table 4 Comparison of temperature and relative humidity of the air from experimental and simulation data with NMSE.
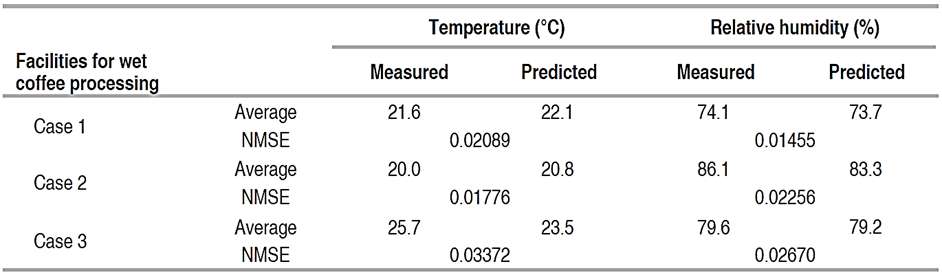
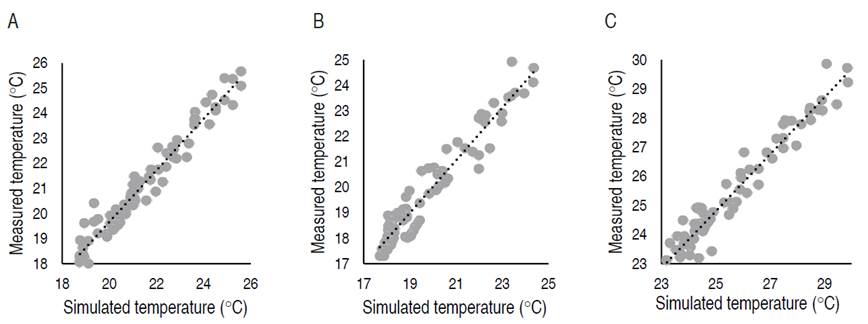
Figure 2 Comparison of measured data and simulated temperature data, A. case 1, B. case 2, C. case 3.
Therefore, it is possible to affirm that the proposed simulation models are capable of predicting the hygrothermal behavior within the three facilities. The models can facilitate decision-making to improve the behavior of environmental variables within this type of construction.
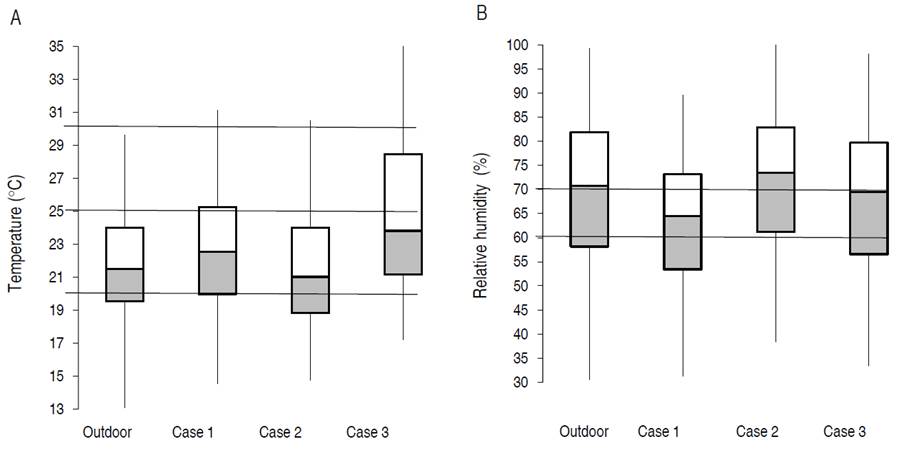
According to the simulations in EnergyPlusTM, Figures 3A and 4A show the thermal behavior of the three cases and the external environment on an average day in November, and the general behavior in a box diagram, respectively. It is observed that the warmest environment occurs in case 3, and the coolest environment in case 2. Concerning workers, the temperature range must be between 14 and 25 °C (MTSS, 1979) and it is observed that the low limit is not exceeded. However, in the warmest hours of the day when there was greater solar radiation, case 3 exceeded the value of 30 °C, thus generating an environment of thermal stress at these hours. This effect can be corrected with passive strategies of natural ventilation.
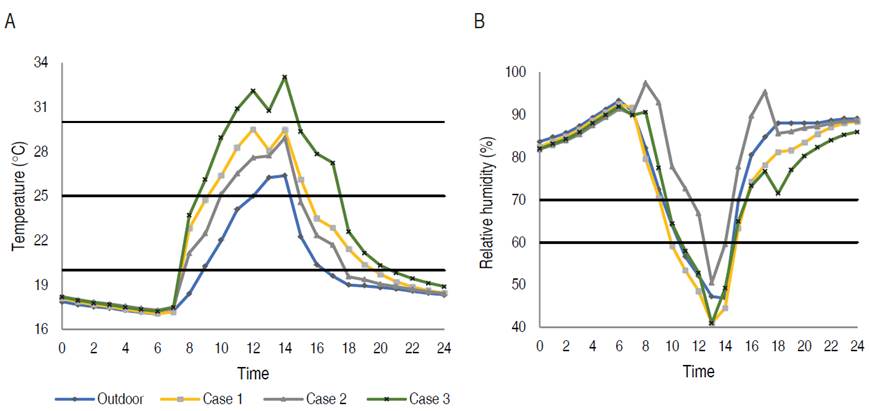
Figure 3 A. Average day temperature, B. Relative humidity of an average day of November for the three study cases.
For coffee, in the three study cases more than half of the time, the temperature was higher than the recommended limit to preserve the quality of the coffee (20 °C in storage). Similar to the behavior of the external environment, this behavior occurs during daylight hours (Figure 3A). Case 3 was the most critical, since more than 80% of the time the temperature was above 20 °C. In this case, the temperature above the desired limit can be mitigated with passive strategies that decrease heat transfer by solar radiation, for example, the use of light or reflective colors on the roof.
In case 1 and case 3, the heat exchangers of the coffee drying machines, which work with coffee husk and firewood, respectively (as the energy source for the drying process), had an impact on the increase in internal temperature, since their efficiency was 50%. The rest of the energy is emitted to the environment in the form of sensible heat. Additionally, in case 3 the aluminum cover (material with high thermal conductivity) and its low height contributed to higher temperatures during the hottest hours of the day.
In case 2, there was a lower temperature inside because the drying machine has no heat exchanger. The coffee is dried with the direct flame from propane gas, therefore, the process emits less heat to the environment (Oliveros et al., 2009). Additionally, the construction has a large volume and receives little solar radiation due to neighboring buildings. However, this is not enough to keep the values within the recommended limit to preserve the quality of dry parchment coffee.
Figures 3B and 4B show the relative humidity behavior of the three cases and the external environment on an average day in November, and the general behavior in the box plot according to the simulations, respectively. It was observed that case 2 and case 1 presented the most and least humid environments. In Figure 5, referred to workers, the relative humidity range should be between 30 and 70%. (MTSS, 1979), but it was observed that during the morning and at night this value was exceeded due to the steam emitted by the facility in the drying process and the reduction in the external temperature. Nevertheless, the relative humidity did not fall below 40%.
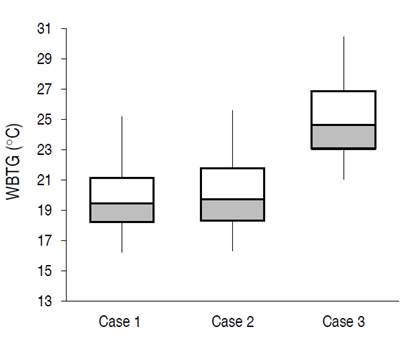
Figure 4B shows a wide range of relative humidity in the external environment, with values between 30% and close to 100%, due to the rains during the coffee harvest season in the area but also to some dry days with clear sky. Similar behavior was found in the case studies. Most of the data were outside the recommended range to preserve the quality of coffee (60 to 70%), and for the wellbeing of workers (30 to 70%). The most humid and critical environment was case 2.
Case 1 has a greater area of natural ventilation openings; thus the relative humidity was lower, followed by case 3, with 32% and 49% of data above 70% relative humidity, respectively. In case 2, the area of ventilation openings is not sufficient for its volume, making it difficult to evacuate the steam generated by the drying process. This caused that 60% of the data exceeded the value of 70% relative humidity. This case represents a great biological risk for the proliferation of fungi and bacteria in coffee.
The hygrothermal performance results indicate that none of the three facilities is suitable for the storage of dry parchment coffee all the time, since they require modifications through passive conditioning methods or the use of active conditioning systems as last resort. Regarding the comfort level of workers in coffee post-harvest facilities, the behavior of the WBGT index, calculated from the results of the simulations of the three case studies, can be observed in Figure 5.
It was found that the WBGT index exceeded 45% of the time in case 3, 3.3% in case 2 and less than 1% in case 1. Data that exceeded the limit of the index appeared due to both the high temperature and the humidity of the air, mainly because of the combination of wet coffee and drying processes within the same facilities. This hinders the loss of heat by perspiration (latent heat) and causes thermal stress (Roscani et al. 2017; ISTAS-C, 2017; Gutiérrez et al. 2018).
It is possible to state that, with the predominance of values lower than the 25 °C limits in the three cases, the WBGT index does not represent a difficult problem, since it could be solved with the application of passive conditioning methods, mainly the physical separation of the spaces of the drying processes from those that generate heat and humidity in the environment. In other words, the heat exchangers of the drying machines should ideally be located externally to the post-harvest facility, and the steam produced in the drying must be quickly evacuated from the building, either with ventilation openings close to the steam outlet and favoring the chimney effect (Osorio et al., 2020) or with designs where the construction drying machine stands out.
CONCLUSIONS
The proposed computational model is capable of predicting hygrothermal behavior, within the three case studies of facilities for wet coffee processing. Case 1 presented the best hygrothermal and comfort conditions, due to its design with the largest natural ventilation area and the largest volume of the three cases. Case 2 presented the most humid environment, and case 3 the warmest environment, which increases the biological risk for coffee storage. Regarding the WBGT index, case 3 presented the most unfavorable condition.
To improve the environmental conditions for the workers and the coffee, constructive modifications are suggested. First of all, the heat exchangers of the dryers should ideally be located outside the post-harvest facility. Secondly, the steam produced in the drying should be quickly evacuated from the building, either with ventilation openings close to the steam outlet that favor the chimney effect or with designs where the construction dryer protrudes from the roof. Additionally, passive air conditioning strategies should be implemented to reduce the gain of solar radiation, such as painting the ceiling in light colors or with reflective colors or materials.

