


 English (pdf)
 Article in xml format
 Article references
 Send this article by e-mail
 Cited by SciELO
  Cited by Google
  Similars in
SciELO
Similars in
SciELO  Similars in Google
 Permalink
Dairy industry produces whey as a result of the enzymatic or acid coagulation of milk proteins. This co-product generates environmental contamination problems, corroborated by indicators such as biochemical oxygen demand (BOD) that varies between 30000 and 50000 mg kg-1, which is mainly due to its lactose and whey protein content. This dumping without previous treatments generates phenomena such as oxygen consumption, waterproofing, eutrophication, toxicity, among others, in bodies of water (Prazeres et al., 2012; Giroux et al., 2015).
Whey is obtained after removing casein from milk. Casein can be separated from milk by acidification to pH 4.6, by using proteolytic enzymes, or by microfiltration. Acidification of milk can be brought about by microbial fermentation of lactose to lactic acid or by the addition of organic (citric acid or lactic acid) or mineral acids (sulfuric acid, phosphoric acid, or hydrochloric acid). Sweet whey is derived from the manufacture of cheese or casein by rennet coagulation of milk at a pH of about 6.0-6.5. Typically, sweet whey results from the production of hard and semi-hard cheeses. Acid whey results from fermentation during fresh acid-coagulated cheese production, and from direct acidification of milk during casein and caseinate production. The resulting whey has a pH of about 4.6-5.0 (Bansal and Bhandari, 2016).
In the dairy industry, it is estimated that on average 9 L of whey result from each kg of cheese, which is classified as a large wastewater generator with a high pollutant load (Kushwaha et al., 2010; Bansal and Bhandari, 2016). Global production of this effluent is estimated between 180 to 190 million t year-1, approximately 50% of which is processed or redirected to industrial processes; therefore, 90 million t year-1 are discharged mainly in water sources around the world (Baldasso et al., 2011; Prazeres et al., 2012; Bansal and Bhandari, 2016).
According to the Ministry of Agriculture and Rural Development of Colombia (MADR), production of "Campesino" or white cheese and double cream cheese for 2019 amounted to 1460 t and 1624 t, respectively, indicating that 24% of the milk formally collected in Colombia is used for cheese production (Gonzalez, 2021). As a result of this amount of cheese, approximately 27756 t of whey were obtained (Gómez and Sánchez, 2019). However, this value only considers what was generated by the formal industry, according to estimates by Muset and Castells (2017) the whey production in Colombia is 2.1 million t year-1 and, between 70 to 80% of this volume is being discharged without adequate treatments.
Traditional practices for the use of whey are fertilization of soils by direct irrigation, animal feed, and spray drying (Bansal and Bhandari, 2016). Currently, other technologies have been developed for whey treatment, e.g., microfiltration (MF), ultrafiltration (UF), nanofiltration (NF), reverse osmosis (RO), and diafiltration (DF), which allow the fractionation of its components and makes it possible to obtain concentrates rich in protein and lactose with high economic value in the market (Jelen, 2011). The ultrafiltration process selects macromolecules weighing between 1000 - 200000 Da from solvents and dissolved solutes, with pore sizes ranging from 1 to 100 nm. The feed flow is carried out at less than 1000 kPa, considering low pressure, compared to nanofiltration and reverse osmosis. The permeate obtained, also known as ultrafiltrate, contains water, lactose, soluble minerals, non-protein nitrogen, and water-soluble vitamins. On the other hand, protein, fat, and colloidal salts can be found in the retentate (Mistry and Maubois, 2017). Almécija et al. (2007) worked on whey proteins concentration and fractionation with ultrafiltration (UF) technology by testing the effect of feeding solution, pH between values of 4.2 and 7.3 in process efficiency. Yorgun et al. (2008) worked with Turkish white cheese whey, obtained by acid-enzymatic coagulation of milk, and UF, NF, and RO modules were tested to recover their different fractions. Baldasso et al. (2011) used mozzarella cheese whey to obtain a high purity protein concentrate using UF and DF, testing different cycles and volumes of water added in that technology. Barba et al. (2001) also demonstrated the effectiveness of UF and DF to obtain a high purity protein concentrate from whey with pH 4. Rektor and Vatai (2004) tested the efficiency of MF, UF, NF, and RO in mozzarella cheese whey fractionation in protein, lactose, and microorganism fractions. Butylina et al. (2006) obtained whey by enzymatic coagulation, prefiltered it before being treating it with UF and NF, and evaluating peptide loss when performing concentration at different pH values. Besides, whey protein concentrate (WPC) is commonly used to increase the dietary protein in many novelty foods (Ranaweera et al., 2022). They can form different gel types depending on the balance between attractive and repulsive interactions (Domian and Mańko-Jurkowska, 2022). They are also used as an effective carrier and stabilizer of bioactive molecules and for improving the stability and antioxidant capacity of anthocyanins (Ji et al., 2022). An important part of Colombian whey is obtained as a result of the fresh curds manufacture, no bacteria added, by enzymatic coagulation of milk. As far as the authors know, no works have been found aimed at concentrating whey proteins using UF technology with whey from fresh regional cheeses (white cheese). Therefore, the aim of this study was to characterize whey and to evaluate the effect of filtration conditions, volumetric concentration factor (VCF), and transmembrane pressure (TMP) on protein retention, the yield of the UF process, and the properties of WPC. In addition, the determination of the best process conditions was carried out using multiple-response optimization, maximizing the desirability function to search for the maximum value of each independent variable.
MATERIALS AND METHODS
Physicochemical and compositional characterization of raw material and whey protein concentrate
The milk used to make white cheese was obtained from dairy farms that breed Holstein cows, it had an average protein content of 3%; fat, 3.6%; total solids, 12%. The animals are fed on Kikuyu grass pastures (Pennicetum clandestinum). Milk was obtained through automatic cow milking and was stored in refrigeration until it was collected by the processing company. Sweet whey resulting from fresh cheese preparation and enzymatically coagulated milk (white cheese) was supplied by Productos Lácteos Aura SA (Rionegro, Antioquia, Colombia). White cheese is traditional from Colombia, it is fresh, made by enzymatic coagulation without the addition of bacteria. It was made using whole milk, which was pasteurized at 75 °C for 15 s, then cooled to 35 °C, when the coagulating enzyme (Chimax, CHR Hansen, Denmark) is added. The curd was cut and stirred for 10 min, completely drained, and, finally, salt (sodium chloride) at 1.2% was added. The resulting mass was molded, pressed for 10 min, portioned, and packed to be stored under refrigeration (0-6 °C). The whey was filtered, clarified by centrifugation at 7200 rpm, and thermized at 63 °C. Total protein content was determined by the Kjeldahl method (AOAC 920.123, 1997); fat content by the Babcock method (AOAC 989.04, 1997); total solids by oven drying by forced air at 98-100 °C for 3 h (AOAC 925.23, 1997); acidity by titration with 0.1N NaOH (AOAC 947.05, 1997); pH with a potentiometer (AOAC 981.12, 1997); water activity (Aw) by dew point method in a thermo-hygrometer at 25 °C (AquaLab 3TE Series, Decagon Devices, Inc., Pullman, Washington, USA) (Grummer and Schoenfuss, 2011); the zeta potential using a Zetasizer light scattering kit (Malvern Panalytical); and it was used to measure the electrophoretic mobility distribution. The whey sample was injected into the measurement cell and placed in the equipment. The temperature was set at 25 °C and a voltage of 200 mV was applied. The analysis lasted approximately 10 min (Gbassi et al., 2012). The lactose content was quantified by HPLC using a 1200 series Agilent Technologies equipment (Santa Clara, CA, USA) with an Aminex HPX-87H ion exchange column (300×7.8 mm) (Bio-Rad) (Hercules, CA, USA); an Agilent Technologies 1200 refractive index detector H2SO4 0.008 N was used as mobile phase at a flow rate of 0.6 mL min-1 (AOAC 984.22, 1997); α-lactoalbumin and β-lactoglobulin content were determined by HPLC using a Shimadzu chromatograph (Kyoto, Japan) equipped with a diode array detector (DAD); and a Jupiter® column (5 μm C18 300 Å, 250×4.6 mm) (Phenomenex) (Torrance, CA, USA) was used with trifluoroacetic acid (TFA) and acetonitrile (ACN) as mobile phases (Elgar et al., 2000). The flow rate was 1 mL min-1. The column was adjusted in 80% solvent A (0.1% v/v, TFA in Milli-Q water) and, after sample injection, a 1 min isocratic period was applied; subsequently, a linear gradient series of 100% solvent B (0.09%, v/v, TFA, 90%, v/v acetonitrile in Milli-Q water) was applied as follows: 1-6 min 20 - 40% B; 6-16 min, 40-45% B; 16-19 min, 45-50% B; 19-20 min, 50% B; 20-23 min, 50-70% B; 23-24 min, 70-100% B. The column was adjusted again after 1 min at 100% B with a 2 min linear gradient to 20% B followed by a 3 min isocratic period.
Concentration of whey proteins using UF
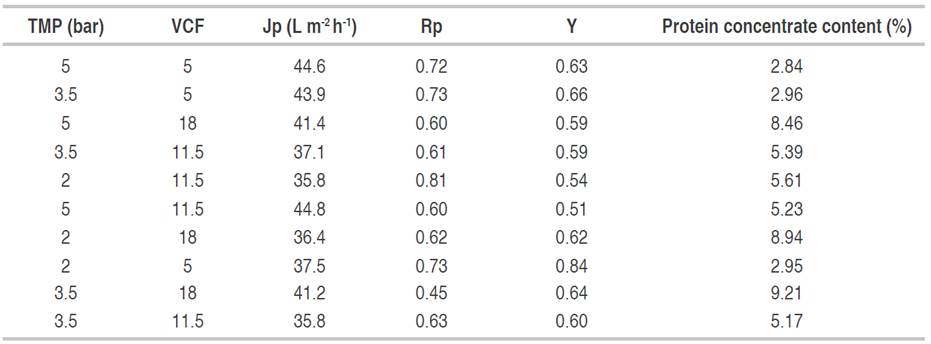
Each experiment was done with 800 L of standardized sweet whey which was ultrafiltered (UF) in a pilot plant (Perinox, Villarobledo, Spain) equipped with two polyethersulfones (PES) membranes in a spiral module (Koch Membrane System inc., Wilmington, Massachusetts, USA) with a capacity of 130 L h-1 of permeate flow and a molecular weight cut-off (MWCO) of 10 kDa. The VCF was between 5 and 18 and the TMP was between 2 and 5 bar. The VCF and TMP values used in the experimentation are shown in Table 1. The protein retention coefficient (Rp) was determined in Eq. (1) (Alkhatim et al., 1998; Vourch et al., 2005; De Souza et al., 2010); permeate flow (Jp) in Eq. (2); and yield (Y) in the protein’s recovery (Nath et al., 2014) and protein concentrate content (AOAC 920.123, 1997) in Eq. (3). These variables have great importance in concentration process efficiency. All tests were carried out at a constant temperature of 48 °C, according to literature (Barba et al., 2001; Butylina et al., 2006; Bipasha et al., 2016).

Where Rp is the protein retention coefficient, Cp is the solute in the permeate (kg), and Cr is the solute in the retentate (kg).

Where Jp is the permeate flow (L m-2 h-1), V is the volume of permeate (L), A is the effective filtration area (m2), and t is the time (h).

Where Y is yield, Vr is the retentate volume (L), Cr is the solute concentration in retentate (% w/w), Vf is the feed solution volume (L), and Cf is the solute concentration in feeding solution (% w/w).
Design and statistical analysis
A central composite orthogonal design was used to optimize the independent variables TMP and VCF in Rp, Jp, Y, and protein concentrate content in the protein concentration process by UF technology. The independent variables were selected from preliminary trials and equipment setups. An individual optimization for each independent variable was performed, and then, a multiple-response optimization maximizing the desirability function to search the maximum value of each independent variable. Data analysis was carried out using Statgraphics Centurion 16.1 (Statpint Technologies, INC).
RESULTS AND DISCUSSION
TMP had significant effects (P<0.05) on Jp as shown in Figure 1A because the Jp at a TMP of 2 bar did not exceed 37.5 L m-2 h-1, and when TMP was 5 bar it was significantly higher, exceeding 41 L m-2 h-1. Baldasso et al. (2011) reported that Jp is affected by concentration-polarization and fouling phenomena, which is based on the accumulation of a solute layer on the membrane’s surface and pores, or interactions between the solutes and the membrane surface, respectively. This process increases with whey concentration (Nath et al., 2014). Nevertheless, Jp is related to intrinsic membrane resistance (Rm) and the resistance due to fouling (Rf) (Barba et al., 2000), which increase due to protein concentration and VCF (Baldasso et al., 2011). However, TMP was effective in increasing the permeate flux for the range studied, being a phenomenon that was previously reported (Iltchenco et al., 2018; Barba et al., 2000). TMP had no effect (P>0.05) on Rp (Figure 1B), which indicates that the membrane did not let escape the protein fractions as the pressure increased. Iltchenco et al. (2018) and Barba et al. (2000) reported that the pressure and the temperature did not affect these variables when 10 kDa MWCO membranes are used to concentrate whey proteins.
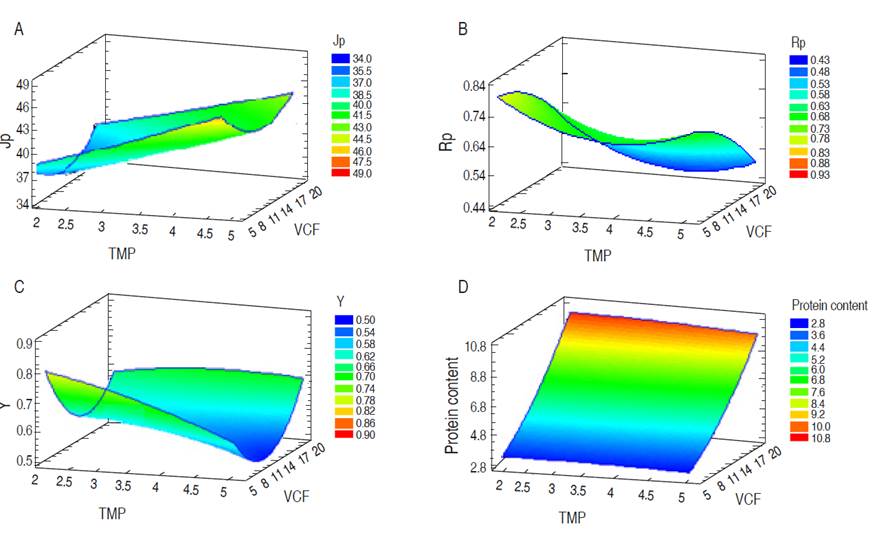
Figure 1 Effect of TMP and VCF on (A) Jp: Permeate flow (L m-2 h-1); (B) Rp: Protein retention coefficient; (C) Y: yield; and (D) protein concentrate content (%).
The VCF presented a significant effect (P<0.05) on the Rp; it had values between 0.6 and 0.73 (Figure 1B), and this was similar to the literature (Galanakis et al., 2014). Iltchenco et al. (2018) reported values between 0.68 and 0.84 using an MWCO between 100 to 1 kDa from polysulphone and polyethersulphone, and De Souza et al. (2010) reported 84%. With higher values of VCF, the protein concentrate content (%) in the permeate also increases, which is represented by peptides, free amino acids, and compounds consisting of non-protein nitrogen (Butylina et al., 2006). However, Barba et al. (2000) stated that native proteins, such as β-lactoglobulin and α-lactalbumin, might even permeate, and this phenomenon can increase due to higher protein concentration and higher osmotic pressure. The Rp indicates that size exclusion was the dominant phenomenon during the separation process (Galanakis et al., 2014) due to the molecular weight of whey proteins, which are higher than 14 kDa (Jelen, 2011), and the membrane nominal pore size, which is 10 kDa.
There is efficient solute retention in the protein concentration process by UF when using a PES membrane with MWCO of 10 kDa. However, small fractions as peptides and even native proteins such as β-lactoglobulin and α-lactalbumin (Barba et al., 2000) can go through the membrane. The yield was not affected by the TMP and VCF factors (P>0.05) and was within the range between 0.51 to 0.84 (Figure 1C). This values agree with the literature, for instance, Nath et al. (2014) reported a yield of 0.6-0.85 for separation of individual whey protein fractions and lactose from casein whey by a cascade of different molecular weight cut-off (MWCO) cross-flow ultrafiltration (UF) membranes; Kukučka and Kukučka (2013) reported a yield of 0.4-0.65 for separation of protein from sweet whey using polysulfone ultrafiltration membranes designed for commercial water treatment; and Marella et al. (2011) reported a higher yield when compared to that of production of α-lactalbumin (α-LA)-enriched whey protein concentrate (WPC) with a range of 0.35-0.45.The use of TMP higher than 2.06 bar helps in the permeation of some high-molecular-weight molecules like proteins (Nath et al., 2014).
The optimization process was carried out to maximize the desirability parameter taking into account Rp, Jp, and the protein concentrate content (%). In the optimization options, a higher impact was given to the protein concentrate content (%) (5 points) because the interest was to have a concentrate with a maximum protein content to be used in cheese making, whereas Rp and Jp had an impact of 3 points each. The desirability resulted in 0.61, and the optimized values for TMP and VCF were 2 bar and 18, respectively. The Jp, Rp, and protein concentrate content (%) were 42.97 L m-2 h-1, 0.54, and 9.08%, respectively.
There were significant differences (P<0.05) between whey and WPC in the values of lactose, protein, acidity, total solids, fat, zeta potential, β-lactoglobulin, and α-lactalbumin (Table 2). The WPC is available in various protein concentration levels such as 34% (WPC34), 45, 50, or 80%, and this denomination is given by the relationship between the protein and total solids content (Gangurde et al., 2011). The proteins content in the WPC was 8.27% (Figure 1D) and the total solids was 18.21%, then the protein represented 45% of the total solids. Therefore, the WPC was classified as a WPC 45 from sweet whey, which is an interesting additive for the food industry because it is rich in proteins, minerals, and lactose and can influence the structure, appearance, texture, viscosity, mouthfeel, or flavor retention of the dairy food products (Królczyk et al., 2016). Protein and fat were concentrated by UF, however, a less stable system was obtained according to zeta potential data. Two types of whey can be made as a result of the separation of caseins from milk, acid whey (pH<5), and sweet whey (pH = 6-7). The previous data is in agreement with the values observed in this study (Panesar et al., 2007; Parra, 2009).
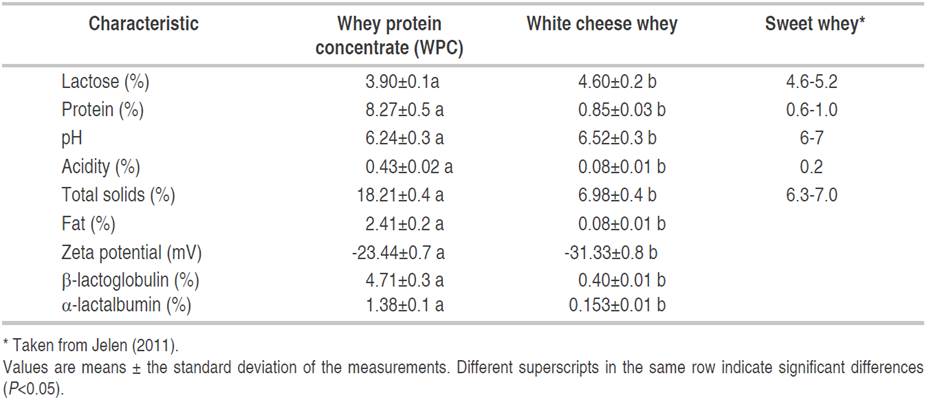
According to Jelen (2011), the whey used in this study had a lower content of calcium and acidity (percentage of lactic acid), which was a phenomenon explained by the cheese-making technology that generated sweet whey. In other countries, cheeses coagulated enzymatically involve using bacteria (Cheddar, Gouda, and Edam cheeses) and act by slightly fermenting the milk. This process differs in Colombia because cheeses are a result of enzymatic coagulation of milk without adding bacteria (fresh curds). In addition, colloidal calcium is solubilized at lower pH values and higher acidity conditions (Panesar et al., 2007), thus explaining the lower calcium content of sweet whey found with respect to the literature (Jelen, 2011) (Table 1). According to Carvalho et al. (2013), bovine whey typically contains, on a dry basis, between 70-80% lactose, 10-12% protein, and between 8-20% minerals, as well as presenting a pH of 6.6 (De Wit, 2001; Muro-Urista et al., 2010). These values are similar to the results shown in this study, being 66% lactose, 12% protein, and 7.6% minerals. β-lactoglobulin and α-lactalbumin contents are similar to those reported by other authors at 0.3 and 0.1%, respectively (Madureira et al., 2010, Almécija et al., 2007).
Concentrate showed significant differences (P<0.05) with respect to whey without concentrating, lactose content, protein, pH, total solids, fat, zeta potential, β-lactoglobulin, and α-lactalbumin. Whey contains between 10 and 12% of protein (bs) with a size between 8.6 to 150 kDa (Carvalho et al., 2013). Therefore, when using a UF membrane with a molecular cut-off size of 10 kDa, a large part of these can be retained, thus explaining the increase of total and individual protein content. This same principle applies to fatty matter, which is retained by this membrane. The WPC had an important protein concentration up to WPC45, indicating that the UF objective was achieved by removing water and other small molecules (Arunkumar and Etzel, 2015). The zeta potential was closer to zero in the concentrate indicating that it is a less stable system than whey because the higher concentration of protein in concentrate can result in more collisions between molecules, generating flocculation (Kaewkannetra et al., 2009). Furthermore, the acidity was higher in the concentrate because the concentration temperature was 43 °C and thermophile bacteria could grow and produce lactic acid, thus lowering the pH value from 6.5 to 6.2 as reported by De Wit (2001) for WPC.
CONCLUSIONS
UF is a suitable technology for sweet whey concentration obtained from the manufacture of fresh enzymatically coagulated cheeses without adding bacteria, a typical process of Colombian cheeses. From this whey, it is possible to obtain a WPC of 45% protein content, which can be used to develop ingredients for food industry. WPC must be used quickly because it tends to generate whey protein flocculation. Under the proposed process conditions, the optimal point for protein concentration, determining the maximization of protein content, was at a TMP of 2 bar and VCF of 18.

