


 Inglês (pdf)
 Artigo em XML
 Referências do artigo
 Enviar este artigo por email
 Citado por SciELO
  Citado por Google
  Similares em
SciELO
Similares em
SciELO  Similares em Google
 Permalink
Soil moisture is defined as the surrounding water content in the root zone, which can reach a depth of up to 200 cm, used for the growth and development of plants (Houser, 2010; Sonkar et al., 2019). The soil moisture content describes temporal water availability for plants and provides an integrated assessment of the relative water supply status versus demand (Deng et al., 2016; Wyatt et al., 2021). In situ soil moisture measurements are fundamental inputs for evaluating and adjusting moisture estimates derived from numerical and satellite models (Dorigo et al., 2013; Liu et al., 2021).
Automated Quality Control (QC) methods are widely used in various geophysical disciplines, especially for variables such as air temperature and precipitation (Hubbard et al., 2005). There are two QC methodologies, the first one using data from multiple sites that are compared to neighboring stations (Hubbard, 2001; Sanhudo et al., 2021) and the second one using data from the same site (Meek and Hatfield, 1994; Yu et al., 2018).
The quality of in situ soil moisture information is essential to improving the reliability of subsequent validations or adjustment studies with numerical models and satellite products (Wang et al., 2021; Dorigo et al., 2015; Albergel et al., 2012).
QC algorithms consist of procedures or rules that evaluate data to detect errors; each procedure will accept data as true or reject the data and label the data as an outlier or doubtful. If data are valid and accepted or data are invalid and rejected, the QC procedure works correctly. When valid data are rejected by QC, a type I error is confirmed; if the data are invalid but accepted by QC, a type II error is committed (Hubbard et al., 2005).
Soil moisture is influenced by atmospheric variables (precipitation, temperature, wind speed, and evapotranspiration, among others), geomorphological and physical conditions, and land cover surrounding the sensor, such as soil texture, terrain slope, and vegetation cover (Hubbard et al., 2005; Lu et al., 2021).
The most common methods for the detection of outliers are based on thresholds that can be static or variable (Journée and Bertrand, 2011; Dorigo et al., 2013; Sanhudo et al., 2021). Spectrum-based approaches study the structure of a measured time series to identify outliers with reliable, long-term climates (>30 years), which are not available for the soil moisture variable in Colombia.
In the sites of each station, the physical conditions of soil and vegetation cover are different, so the quality control of the soil moisture variable must be carried out with data from the site where the sensor is found, moreover, the sensors within the network are spaced apart, making the use of neighboring stations for the QC process unfeasible.
In this sense, this study aimed to evaluate the quality of soil moisture measurements by Instituto de Hidrología, Meteorología y Estudios Ambientales (IDEAM) network automatic stations with measurement marking methodologies developed by Dorigo et al. (2013) and expanded by Heer (2017). The evaluated soil moisture values were classified into quality flags that determined geophysical range limits and unusual behaviors (Hernández et al., 2021).
MATERIALS AND METHODS
Soil moisture data
The QC methodologies for the soil moisture data were adjusted for the stations' hourly data with the quality controls of geophysical range and spectrum consistency for the IDEAM agrometeorological station network, examining the soil moisture time series structure with first and second derivatives from the Savitzky-Golay filter (Xaver, 2015; Torres et al., 2020), the International Soil Moisture Network (ISMN) methodology review (Dorigo et al., 2013), and adjustment of the algorithms to the particular conditions of Colombia (Fischer et al., 2022).
The data were compiled by the IDEAM network of automatic agrometeorological stations, which recorded soil moisture contents at three (3) different depths, along with other atmospheric variables with data quality processes (precipitation, temperature, wind velocity, and solar radiation), with TRIME-EZ soil moisture sensors (IMKO GmbH, German) based on Time Domino Reflectometry (TDR).
Quality Control Methodology
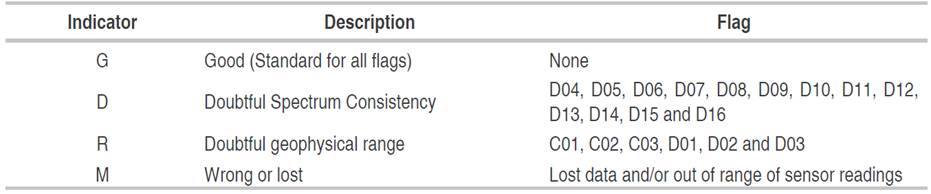
The best quality control for moisture data is visual inspection, with variable inputs such as precipitation, soil temperature, and air temperature (Xaver, 2015). However, for hourly data with large volumes of data and operational applications, this is impractical, inefficient, and time-consuming. Therefore, the ISMN Quality Control process is used to identify and mark spurious observations automatically (Dorigo et al., 2013), as adapted by Heer (2017) who included other spectrum consistency flags. Quality control does not manipulate or alter data but denotes data with quality flags. The different quality flags are encoded with letters according to the Code of Practice (CEOP). Quality control is classified into two flag groups:
Spectrum-based errors are sudden and unnatural changes in a soil moisture time series. These suspect measurements can be caused by a sensor malfunction, a lack of response from the sensor, a problem with the power supply, or a connection problem when registering the data. These errors can be detected by examining the time series structure (hourly) of the soil moisture and analyzing the first and second derivatives. These faults can generally be categorized into three types: jumps, peaks, and constant values. (Dorigo et al., 2013; Xaver, 2015; Heer, 2017).
The ISMN quality indicators are divided into three categories: 1) out-of-limit values, 2) geophysical consistency checks, and 3) spectrum-focused (Table 1), errors based on out-of-limit values were not evaluated, IDEAM performs this type of control before delivering the data.
Table 1 ISMN quality categories and flags, adjusted for this study.
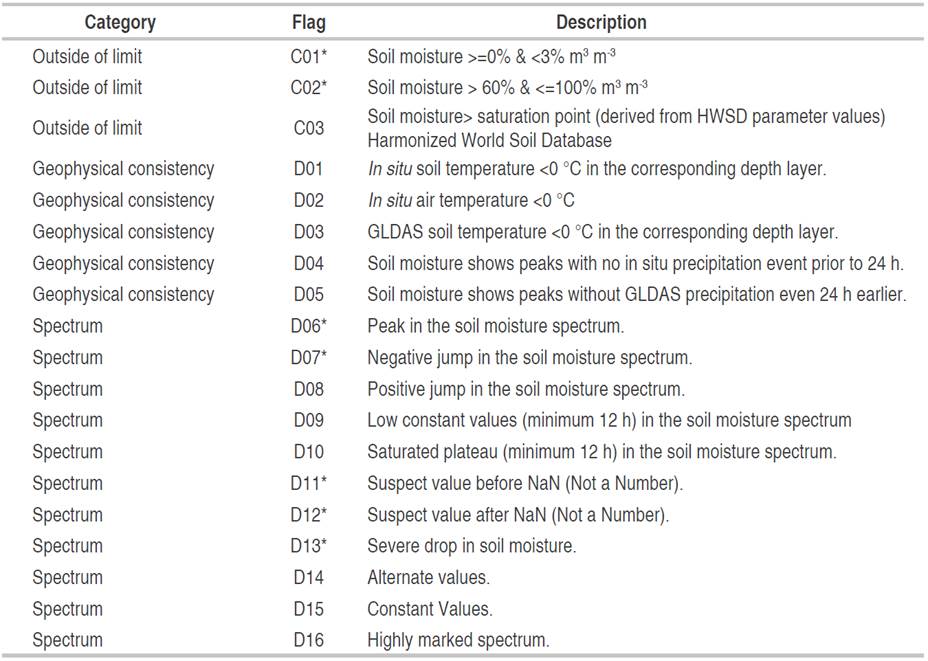
Source: Adapted from Heer (2017).
Negative values and values greater than 100% input were marked as erroneous (M) since the sensor cannot register these values. Additionally, these records are associated with a malfunction in the sensor and/or data recording system (Table 2).
Some ranges were modified, such as quality controls for out-of-range values, and flags that are activated by soil moisture values that are theoretically possible but unlikely under Colombian conditions (C01) because of the peculiarities of this variable. Also, some threshold modifications were made for the spectrum consistency flags. For this reason, the flags were grouped into a few categories, which excluded measurements such as negative soil moisture values and values higher than 100%, which physically are not possible, and which were initially marked as wrong values.
C03, D03, and D05 flags are used when information is only available from a soil moisture sensor; therefore, estimates from numerical or satellite models are needed for synthetic data on precipitation, air, and soil temperatures.
Quality control of out-of-range values
C01 and C03 flags were used if a value exceeds the established minimum or maximum limits. These limits in the ISMN are defined for moisture variables between 0% and 60% of the volumetric water content in the soil as a maximum value although, under Colombian climatic and edaphic conditions, soil moisture values of 0% are extremely unlikely. Therefore, a soil moisture value of 0% is due to a sensor failure resulting from a loss of the power supply.
The dry season or periods with less frequent rainfall (rain supply less than the potential evapotranspiration demand) do not exceed eight (8) months, an insufficient period for soils to naturally reach moisture values of 0% In addition, at depths close to 10 cm, the relative humidity in the equatorial region is high, and the Intertropical Convergence Zone (ITCZ) in Colombia contributes to an increase in cloudiness that affects the evaporation process because of the low incidence of solar radiation and the prevalence of calm winds or low wind speeds. These meteorological aspects do not actively contribute to soil moisture loss, so the minimum limit was set at 3%, which is the lower limit of the permanent wilting point for a coarse soil texture (a texture that has the least possibility of storing water) (Figure 1 A,B).
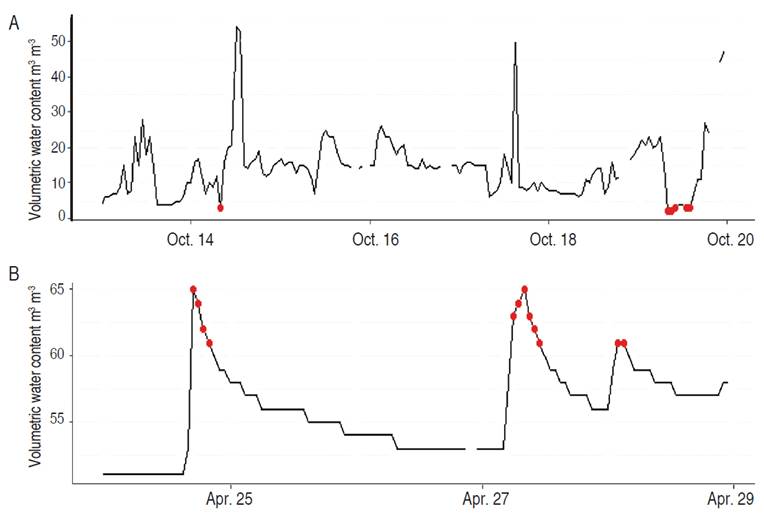
Source: author's elaboration based on IDEAM data.
Figure 1 Limits (minimum and maximum) of soil moisture. A. Moisture values <3 %., B. Moisture values >60 %.
Quality control of geophysical consistency. D01 and D05 flags were used for soil moisture values when inconsistencies or incongruities are recorded with other geophysical variables, such as soil temperature, air temperature, and precipitation. An inconsistency with temperature has to do with the process of freezing and thawing of the soil, where the sensor erroneously registers lower moisture in frozen soils because the dielectric conductivity of solid water (ice) is significantly lower than liquid water. Frozen water in the soil leads to a significantly lower soil moisture content (Dorigo et al., 2013).
Soil takes longer to freeze when it has vegetation cover and/or snow because the cover acts as thermal insulation. Freezing only begins when the average air temperature is below −10 °C for at least 2-3 consecutive days. A soil layer at approximately 20 cm takes 10-12 days to freeze under these air temperature conditions (Endla et al., 2017; Cao et al., 2021).
The purpose of the IDEAM agrometeorological network is to monitor agrometeorological conditions in the vicinity of agricultural areas (below 300) with actively growing vegetation cover. In Colombian agricultural areas, mean temperatures or daytime averages <0 °C are not possible. It is probable, that some specific points in Colombia have records <0 °C but this temperature is temporary (a few hours or days), and insufficient time for the soil to freeze and affect measurements by moisture sensors, so these flags were not used for the development of this study.
The first approach for the relationship between precipitation and responses in soil moisture to denote spurious moisture observations was proposed by You et al. (2010). However, Dorigo et at. (2013) started denoting measurements as suspicious when an increase in moisture is recorded without the occurrence of significant rainfall in the previous 24 h (equations 1 and 2.

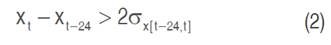
Where x
t is the value of the soil moisture at time t in h, and  is the standard deviation of x in the previous 24 h. The first equation ensures that only soil moisture rises, and the second one identifies increases that exceed daily variation. For each identified measurement, the occurrence and amount of precipitation in the 24 h before the measurement were verified.
The D04 quality flag, based on precipitation, only applies to measurement depths <10 cm, showing a direct response to precipitation (Dorigo et al., 2013).
Spectrum consistency quality control. Spectrum-based errors are sudden and unnatural changes in a soil moisture time series. These suspicious measurements can be caused by a sensor malfunction, a lack of sensor response, or a power supply or connection problem when registering the data. These errors can be detected by examining the time series, and analyzing the first and second derivatives; these faults can generally be categorized into jumps, peaks, and constant values.
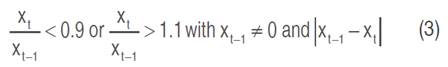
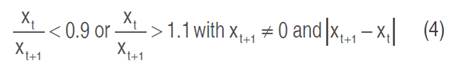
A peak is an event that lasts for a single time step (measurement) and differs markedly from the prior and subsequent values. This value can be above or below the measured soil moisture values. Taking into account the meteorological and edaphic conditions of Colombia (a Tropical region with a strong influence of the ITCZ, which causes intense rainfall and soils of medium textures with a porosity that favors the passage of water through the soil profile), the algorithm was adjusted by modifying the range from 5 to 10% for a moisture change in a time step to be considered a peak, after visual inspection where natural increases in soil moisture of less than 10% were evidenced in a single time step.
1. Single measurement that differs significantly from observations xt-1 and xt+1 of xt, xt must vary less than 10% (equations 3 and 4).
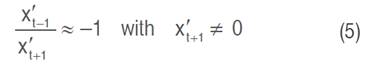
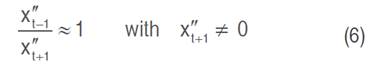
2. In the first derivative, the values before and after the peak are ideally the same. This does not occur in actual measurements and varies because of constant increases or decreases in the spectrum. Therefore, equations 5 and 6 in the second derivative should satisfy the same condition although they seem redundant; both avoid different cases of overmarking.
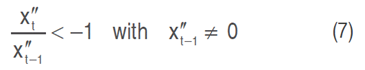
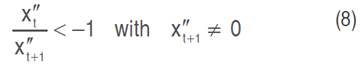
3. The third condition represents the peaks in the second derivative that are twice as large as the smallest peak in the marked measurement. Since moisture measurements vary, large peaks only have to be larger than small ones (equations 7 and 8).
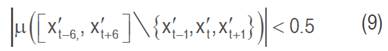
4. To take into account the noisy data of the series, the mean calculation in the first derivative applied to the time series was done at an interval of 6 h before and after (+/- 6 h) the potential peak, without the marked value (equation 9).
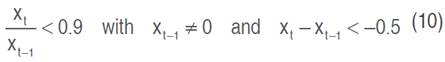
Jumps are characterized by a sudden change in soil moisture measurements from one time step to another. Unlike a peak, after the jump, the moisture does not return to the initial value but remains modified until a certain time. A Negative Jump is a measurement in time t that meets the following conditions:
1. The ratio between values xt and xt-1 must be at least 10%, and the previous soil moisture must be > 0, (equation 10).
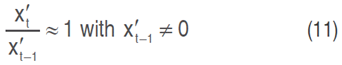
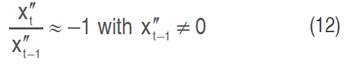
2. In the first derivative, the value before and after the jump are ideally the same but have different directions. In the second derivative, the condition is the same, but  must be negative. Both conditions complement each other because the first derivative takes into account its neighbors, and the second one does not (equations 11 and 12).
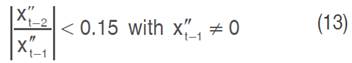
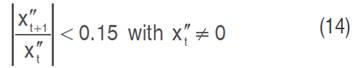
3. A negative jump is seen with a negative second derivative, with a positive value for t+1, which must be maintained after the marked change (equation 13), equation 14 was added where the division was reversed since  and
and  should not be zero; in any event,
  and
and  is often zero.
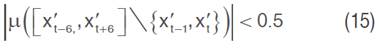
4. The spectrum before and after the jump must be fairly smooth to avoid excessive signaling, where the mean of the first derivative is used in 6 h before and after the potential jump, without the marked value or the value above (equation 15).
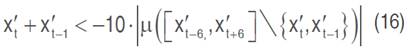
5. The equation (16) differs from the previous one by adding the derived value before xt, with the first derivative rounded.
A Positive Jump does not differ much from the negative one although there are difficulties in its detection because of the similarity in behavior with natural increases caused by precipitation.
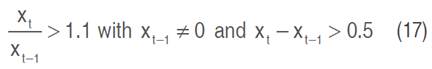
1. For a positive jump, the xt and x t-1 ratio must be greater than 10%, similar to the range for a negative jump (equation 17), and the moisture in xt-1 must be >0.
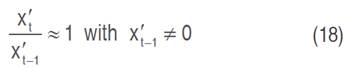
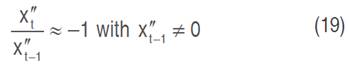
2. The second condition is exactly the same as in a negative jump (equations 18 and 19).
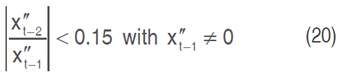
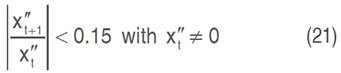
3. The third condition is also equal to the one for a negative jump (equations 20 and 21).
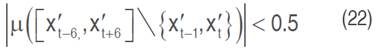
4. The spectrum around the jump must be very smooth, so the first derivative is evaluated in 6 h before and 6 h after xt (equation 22), similar to a negative jump.
5. For a positive jump, the sum of  y
y  must be 10 times greater than in the spectrum of the first derivative (equation 23).
6. Finally, an additional condition is added to avoid excessive signaling from natural precipitation events. After the jump, the soil moisture maintains a constant level because of new rainfall and may even increase or decrease because of the natural drying process; this situation is excluded with equations 24 and 25.
Plateaus are defined as relatively constant values. They can be low or high, with defined characteristics; therefore, detection algorithms are different. The ISMN defines a plateau as lasting for at least 12 h.
Low-level plateau. Low constant values are mainly the result of a poor sensor power supply, following a negative jump with inadequate readings for low soil moisture.
1. The first condition for a low-level plateau is the presence of a negative jump because a low-level plateau starts at xt with t =tpl_start
2. They are usually at values close to 0; within the plateau, the variation must be minimal and last for at least 12 h (equation 26).
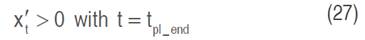
3.To ensure an increase in moisture once the plateau is finished and avoid excessive signaling from the natural drying process in soil, which can be quite slow, equation 27 is tested.
Saturated plateau. This event is easily confused with the natural drying process. On many occasions, it occurs with one or more precipitation events, which triggers a high moisture measurement at the beginning and a moisture drop at the end. For a saturated plateau to be recorded, the following conditions must be met:
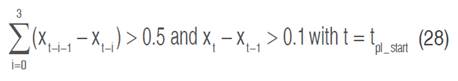
1. An increase in soil moisture must occur to achieve a saturated plateau; this increase must happen, at a maximum, in the previous 3 h and must be greater than for the flags described above (equation 28).
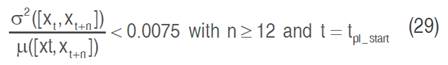
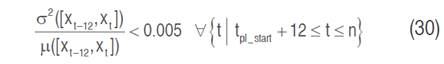
2. The variance of the entire plateau and each time step of the 12 h is calculated separately; the variation of the additional limit avoids marking the drying process, but, if the plateau lasts for a long period, the added value would not have much influence. Therefore, both limits are required (equations 29 and 30).
3. To detect large moisture differences between two neighboring values, which should not occur within a plateau, equation 31 is applied.
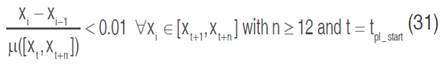
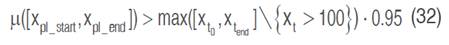
4.The last condition indicates that it will only be marked as a saturated plateau if it is in the top 5% of the soil moisture time series readings (equation 32).
Suspicious values around missing values. Values before or after a sensor failure are often atypical, especially after long periods of sensor record drops.
Suspicious values before missing values. To analyze this questionable data before missing values, the first and second derivatives are quite useful.
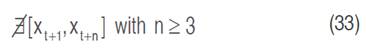
1. A sensor failure in a time step does not normally lead to suspect values before or after failure. To avoid over-marking, a minimum of 3 h of sensor downtime is required (equation 33).
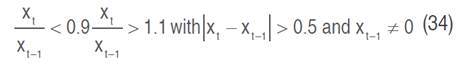
2. The difference with the value before the suspect value must be greater than a certain limit; Heer (2017) defined it as 5%. For the meteorological and edaphic conditions of Colombia, a visual inspection to avoid over-marking of this flag, this limit was determined as at least 10% (equation 34).
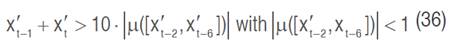
3. The spectrum before the suspect value has to be smooth to differentiate between natural moisture variations and potentially doubtful values (equation 35).
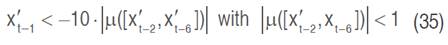
4. For a breakout, the first derivative in the suspect value must be much higher than in the last spectrum (equation 36).
Suspicious values after missing values. The algorithms are analogous to those used for suspect values before NA (Not a Number). As above, the relative change after the suspect value must be at least 10%.
Severe drop in soil moisture. Because the soil drying process is progressive and can be relatively slow, it makes sense to introduce a flag that marks a negative change in soil moisture that occurs within 1 h beyond a certain threshold. Unlike the negative jump, the fall must be much greater. Heer (2017) defined the fall as at least 25%.
Taking into account the physical conditions of the soil and variables such as texture, porosity, apparent density, and hydraulic conductivity, among others, determine the speed with which it can dry or favor the passage of water through it.
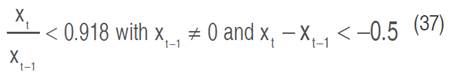
Therefore, this threshold was modified since an excessive moisture drop for a fine texture differs in terms of infiltration speed when compared to soils with a medium and coarse texture. Taking into account aspects such as porosity and soil texture, the following thresholds were established for Colombian conditions.
- Fine texture: a drop of at least 8.1% (Clay, Sandy clay, and Silty clay), equation 37.
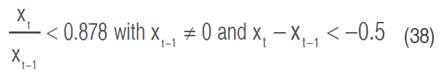
- Average texture: a drop of at least 12.2% (sandy loam, loam, silty loam, silty clay loam, and silt), equation 38.
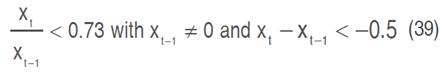
- Coarse texture: a drop of at least 27% (sand, clay sand, loamy sand, coarse sand), equation 39.
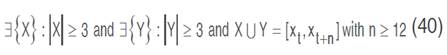
Alternate values: In some soil moisture time series, sensor malfunctions result in alternating values. The readings constantly change between fairly high and low soil moisture readings. Five conditions must be met to mark these values as alternates. The moisture readings are classified in two sets, which must include at least three (3) measurements; their union is the period of erroneous data with at least 13 values (equation 40).
5. Each group must include a value that has a predecessor and a successor in time from the other group (equations 41 and 42).


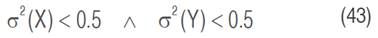
6.The variance of each group must be less than 0.5% (equation 43).
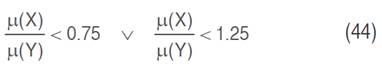
7.The relative difference between the sets must be at least 25% (equation 44).
8. Each value in each set should differ from the mean of the set by a maximum of 1% to avoid outliers that should not occur in that set and therefore avoid over-marking (equations 45 and 46).
Constant values: Normally, moisture values are variable, even in the absence of precipitation events, because they are influenced by the seasonal cycle. Daily variation is also recorded because of the effect of solar radiation and temperature. For this reason, it is unlikely that soil moisture will remain constant for a period longer than 24 h.
The condition that is set to mark a value as constant is a measured value that does not change for at least three days (72 h), where three daily cycles should be visible.
Highly marked spectrum: Many random erroneous observations that cannot be detected by specific algorithms, and data values that are within a spectrum where most of the data sets are flagged. Therefore, there is a flag that indicates when more than half of the data sets are flagged within 24 h, before and after a suspect value detection.
RESULTS AND DISCUSSION
The results show that 40.3% of the soil moisture records were good (G), 12.9% were doubtful for the spectrum (D), 14.3% were doubtful for the geophysical range (R) and the remaining 32% of the data were erroneous (M), either because they were outside the geophysical range and/or data were missing (Figure 2).
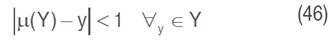
Source: author's elaboration, based on IDEAM data (2021).
Figure 2: Quality indicators for a depth less than 10 cm, measured in the IDEAM Automatic Agrometeorological Stations Network.
When performing the flag quality analysis by depth (Table 3), the one closest to the surface (10 cm) had the highest number of reported quality flags, with 134 observations marked per 1,000 records, followed by 120 records marked for the 30 cm depth and 95 records marked for the 50 cm depth.
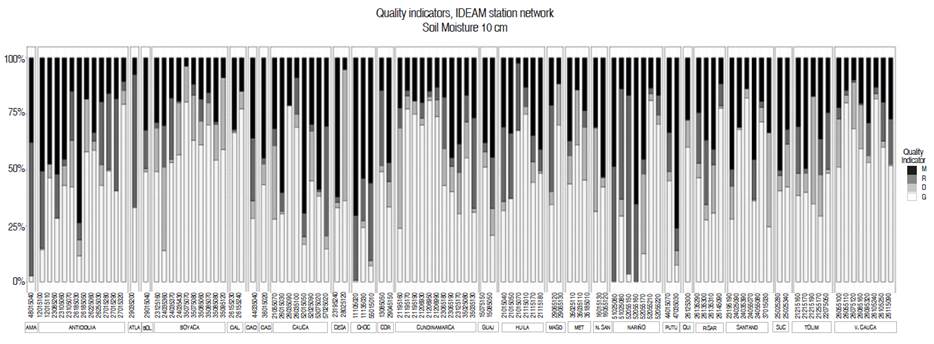
Table 3 Quality flags detected (* in thousands) by depth. Data series from the IDEAM agrometeorological network.
Of the out-of-limits and geophysical consistency flags, the quality flag with the highest number was C02 "Soil moisture >60% & <=100%", with 215 detections per 1,000 records. This flag was detected in 93% of the stations with sensors at 10 cm, and 91% and 82% of the stations with sensors at 30 cm and 50 cm deep, respectively. The second most frequent quality flag was C01 "Soil moisture >=0% & <3%", with 78 detections per 1,000 records.
When analyzing the spectrum consistency flags, the most frequent quality flag was D13 "Severe Drop in Soil Moisture", with 4.9 observations marked per 1,000 records. This flag was detected in 98% of the stations with sensors at 10 cm and 30 cm deep, and 90% of the stations with sensors at 50 cm. The second most frequent spectrum consistency flag was D09 "Low constant values (minimum 12 h) in the soil moisture spectrum", with 2.9 observations marked per 1,000 records.
The soil layer closest to the surface is the most influenced layer by the atmosphere and physical and vegetation cover conditions for the soil moisture content. The most common flag in the geophysical range check was C02 (Figure 3).
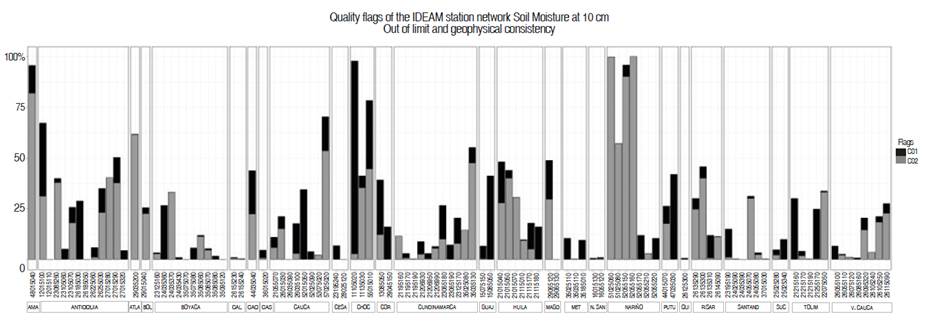
Figure 3 Percentage of out-of-limit quality flags and geophysical consistency at a depth of 10 cm in the data series from the IDEAM agrometeorological network.
The high soil moisture values were in areas with rain between 8-10 months per year, which favors moisture saturation and soil supersaturation, with values higher than 60% of the volumetric moisture content. In addition, the moisture fell to values of 0% and stayed at this value for a long time. Additionally, during the day, the values appeared to be normal, and, at night, the values rapidly dropped to 0%, indicating that, when a decrease or loss of energy was registered by a sensor, the registered soil moisture value was 0%.
This flag is highly related to the C01 Geophysical flag and the D13 spectrum flag since the former shows values lower than 3%, and the latter indicates a severe moisture drop. Therefore, when a station suffers a power loss, the moisture drops to values close to 0%; the C01 flag is activated. When this occurs in a single time step, a severe moisture drop is registered (D13). When this record is maintained for a period greater than 12 h until the power supply is restored, the third flag, D09, is triggered, corresponding to a low-level plateau.
There are a couple of complementary flags that were calculated within the spectrum analysis, the D15 "Constant Values" flag and the D16 "Highly marked spectrum" flag. These flags show complementary information at the spectrum level, providing information on particular behaviors in a time series, such as constant values, which show the number of observations where the sensor between one-time step and another does not have any response to a variation in moisture for 72 h (low-level plateaus and saturated plateaus).
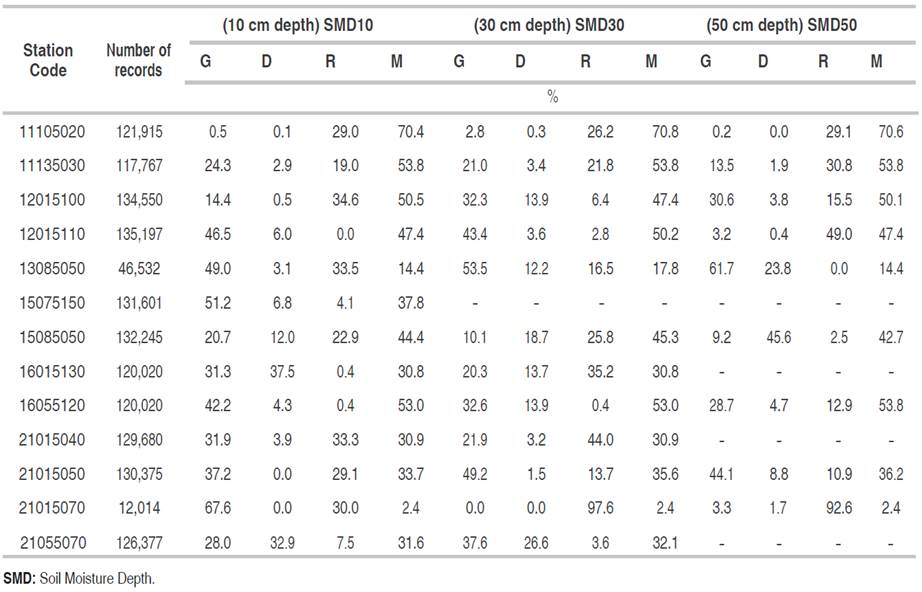
The flag for a highly marked spectrum takes into account neighboring measurements that are marked by a flag, which indicates the quality of the record concerning the quality of the 48 neighboring measurements 24 h before the measurement and 24 h after the measurement. Table 4 shows quality indicators of soil moisture records for the stations of the IDEAM network and the number of total records by sensor depth, where G (Good Data), D (Doubtful spectrum), R (Doubtful Geophysical Range) and M (Erroneous or missing data).
Table 4 Network of IDEAM agrometeorological stations. Quality indicators, soil moisture records by sensor Depth
Colombia has a variable supply of rainfall, both in volume and distribution, but is among the rainiest places on the planet. When checking the dynamics of soil moisture with values> 60%, it was observed that this condition resulted from strong, isolated rainfall events or consecutive events, as seen in most of Colombia in the rainy months, which in some areas can be up to 8-10 months of the year. This suggests that the range defined for the C02 flag may be below the registered values for soil moisture, resulting in over-marking for this quality flag and suggesting the need for specific studies to determine the soil moisture saturation limit for Colombian conditions.
Previous studies on quality controls applied to the ISMN soil moisture series (Dorigo et al., 2013; Xaver, 2015 and Heer, 2017) indicate that the C01 flag "Soil moisture <0%" works well for arid and seasonal regions, where there is a long time with limited rainfall and low relative humidity that favor the gradual drying process in soil (Brutsaert, 2014; Tugwell-Wootton et al., 2020).
It does not apply to equatorial regions such as Colombia where there is climatic seasonality, there are different rain regimes that range from the absence of a dry season to the presence of two dry seasons in the year and relative humidity that does not drop below 40%, conditions that do not favor the loss of moisture in the soil at values close to 0%; therefore, this flag was adjusted for the Colombian territory and was defined as "soil moisture> = 0% & <3%".
The series analysis for some stations marked with quality flag C01 saw a drop in moisture values to lower than 3% in less than 2-3 time steps in the late afternoon and evening, suggesting that these sudden drops in soil moisture have to do with a power supply power for the sensor.
One of the main problems of spectrum consistency quality control is the presence of missing values, causing difficulties in the detection of suspicious measurements. Spectrum consistency flags are based on the smoothing of the series by applying the Savitzky-Golay filter, which implements the first and second derivatives that require a complete series of values on an hourly scale.
Dorigo et al. (2013) and Xaver (2015) set the change in soil moisture in a time step for the detection of peaks and plateaus at 5% for quality control in the ISMN soil moisture series, which generated an excessive markup for Colombian conditions because of the frequency and intensity of rainfall. For this study, this threshold was modified to 10%, avoiding over-marking as the result of rainfall events.
Heer (2017) developed a new quality flag to detect severe drops in moisture, which set a 25% decrease in moisture in a time step (hour) and does not adjust for the equatorial conditions of Colombia. It was decided to define the drop in moisture based on the soil texture conditions, resulting in improvements in the detection of this type of quality flag, avoiding under-marking.
CONCLUSIONS
IDEAM's network of agrometeorological stations has good data in 40.3% of its records, a volume of data that can be used for subsequent validations with estimated data. In addition, when analyzing the trend of a quality flag marking throughout the operational years of the IDEAM series, there were no increasing trends for any flag, neither for geophysical range nor for spectrum consistency. This suggests that the sensors are still adequately recording the soil moisture condition, indicating that the quality of the records has not undergone significant changes that would show deterioration after about 20 years of network operation. Some peculiarities were detected in the quality control:
Problems with missing values in the application of the Savitzky-Golay filter, based on derivatives of the first and second degree, which requires a time spectrum with measurements and is interrupted when a lost value is recorded; this causes undermarking of quality flags based on spectrum consistency. The flags most affected by this condition are plateaus and jumps, which have interrupted detection with the appearance of missing values.
Abnormally low values, soil moisture <3%, where the moisture drops to values of 0% in a few hours; for some stations, this occurred in the evening hours, suggesting they are due to failures in the electrical supply.
A high percentage of high moisture records> 60% were marked because of the established geophysical limit, but, when analyzing some series, it was evidenced that they are the result of intense and/or continuous rainfall and wetting and drying processes in the soil. This suggests that the geophysical range marking was good, along with the soil moisture measurements, which, for some stations and areas of Colombia, may become normal.
The typical cloud formation of the intertropical convergence zone (ITCZ), which intercepts a high percentage of incident light and reduces the supply of solar energy for the panels on the automatic stations, means the stations must have a power system with solar panels and batteries. When a station sensor perceives a decrease in power supply, low values are recorded.
The quality control methodology, with adjustments for local Colombian conditions, provided satisfactory results in the detection of anomalous records of soil moisture, providing soil moisture data with quality flags, which can be used in subsequent validation analyses of and studies on the dynamics of this variable in Colombia. However, more in-depth studies should be carried out for the geophysical limits of Colombian regions where rainfall is usually frequent and intense.

