


 English (pdf)
 Article in xml format
 Article references
 Send this article by e-mail
 Cited by SciELO
  Cited by Google
  Similars in
SciELO
Similars in
SciELO  Similars in Google
 Permalink
Among cereal small grains that dominate the global cultivated area in Algeria, wheat (Triticum sp) is the backbone that forms the diet of the local population (Fellahi, 2017). According to the Food and Agriculture Organization (FAOSTAT, 2021), this genus is annually grown in ~2 million hectares with a total production quantity of ~3.9 million t. Even though the county has made great progress in terms of grain production during the last decades, particularly in durum wheat (Triticum durum Desf.) species, the national production of bread wheat (Triticum aestivum L.) is still far to satisfy the demands of an overgrowing population. In such circumstances, the government still resorts to importing large quantities of wheat with substantial purchases.
Bread wheat is basically grown under rainfed conditions in arid and semi-arid regions of Algeria where drought stress represents the most growth-limiting factor of field crops. This is in addition to subsidiary factors that may restrict its productivity such as the other abiotic (frost, heat, salinity) and biotic stresses (diseases and pests), and technical difficulties related to crop management (irrigation and machinery) (Fellahi, 2017). Drought is a polygenic complex trait that occurs when water loss from the plant surpasses the ability of the plant's roots to absorb water (Mwadzingeni et al., 2016). This stress ranks first when compared to other stresses referring to the damages that can occur. Drought affects almost all parts of the plant, which causes serious changes at morphological, physiological, biochemical, and molecular levels (Salehi-Lisar and Bakhshayeshan-Agdam, 2016). These modifications depend both on the severity and the duration of the stress as well as the growth stage of the plant (Araus et al., 2002). During the early growth stages, water stress limits the germinability of wheat grain and reduces seedling vigor (Boudiar et al., 2019). Likewise, during the flowering and grain filling periods, drought decreases the number of fertile tillers, spikes fertility, grain weight, above-ground biomass, and therefore, grain yield (Pour-Aboughadareh et al., 2020).
Improving wheat yield under water stress conditions is a big challenge faced by wheat breeders who are being asked to select potential varieties to satisfy the present and future demands of farmers and consumers. Various traits have been used in wheat breeding programs as indirect selection criteria to improve drought tolerance in a combination with high yield (Chowdhury et al., 2021). It was found by Awan et al. (2015) that relative water content might be an important trait in screening wheat genotypes for water stress tolerance. Under stressful conditions, water use efficiency demonstrates a negative correlation with transpiration rate and positive associations with photosynthetic rate, relative water content, and stomatal conductance (Sallam et al., 2019). An increase of proline content in the leaves may lessen water loss and protect wheat plants against water deficit (Mwadzingeni et al., 2016). According to Awan et al. (2015), the most tolerant genotypes possess the capacity to maintain membrane integrity under drought. Selection based on these traits of interest can improve genetic gains for yield and its components as well as drought tolerance enhancement. Understanding the magnitude of genetic variation for desirable secondary traits is important for a successful plant breeding program which enables a breeder to know to what extent the environment affects grain yield (Ene et al., 2016). Such good variation for wheat-assessed traits will allow a choice of suitable selection criteria and identification of promising genotypes for breeding and product development purposes (Ngwepe et al., 2021). In light of the above background, this study aimed to investigate the amount of genetic variability, heritability, genetic advance, and the association among yield and yield-related traits in advanced wheat (Triticum aestivum L.) breeding lines evaluated under semi-arid growth conditions.
MATERIALS AND METHODS
Site, plant materials, and experimental design
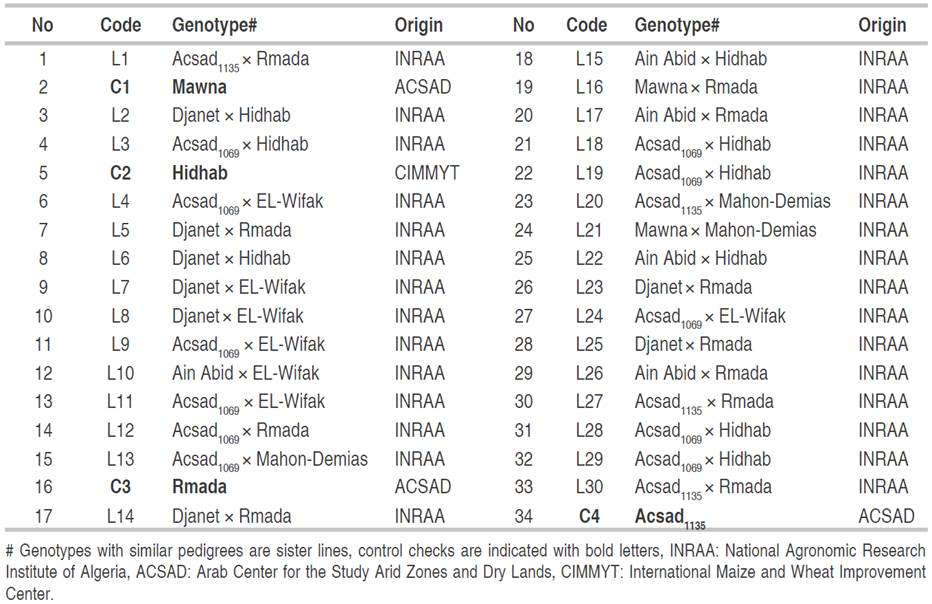
The experiment was carried out at the experimental field of the National Agronomic Research Institute of Algeria (INRAA), a research unit of Setif (36°09' N; 05°22' E; 981 masl) under rainfed conditions during the 2020-2021 crop season. The plant material consisted of 34 bread wheat genotypes including 30 biparental advanced breeding lines and four control checks named Mawna, Hidhab, Rmada, and Acsad1135 (Table 1). The first three control checks are released varieties that are widely cultivated in Algeria (Fellahi, 2017). The experiment was set up on December 22, 2020, in a randomized complete block design (RCBD) with three replications using an experimental seeder type Hege 80. The wheat crop cycle extended from December 22, 2020 to June 30, 2021. All genotypes were headed during the first third of May.
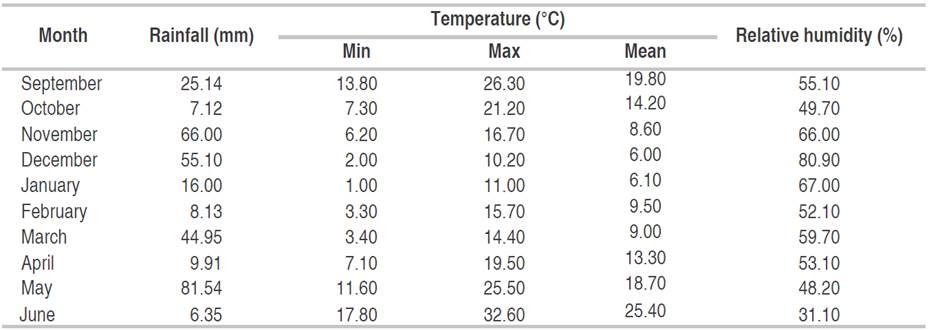
The plot dimension was 6 m2, which included 6 rows, each 5 m long, spaced 0.2 m apart. The soil is calcareous (Calcisol), with a silty clay texture (44% clay, 44% silt, 12% sand) and organic matter content of 1.05% (Internal soil analysis report). The experimental plots were fertilized with 100 kg ha-1 of mono-ammonium phosphate (52% P2O5 + 12% N) before sowing and 80 kg ha-1 Urea (46% N) at the tillering stage. Weeds were controlled chemically and manually when necessary. Recorded monthly rainfall distribution, temperature (max, min, and mean), and relative humidity during this crop season are displayed in Table 2. The amount of monthly rainfall recorded during the 2020-2021 crop season, from September 1 to June 30, reached 320.24 mm, which is below the long-term average.
Table 2 Mean monthly rainfall, temperature, and relative humidity during the 2020-2021 crop season (Tutiempo Network, 2021).
Data recorded
A total of 13 phenological, physiological, and agronomic traits were evaluated in this experiment. Days to 50% heading (DH, days) were recorded as the number of days from January 1 until 50% of the heads in a plot. The traits relative water content (RWC, %), electrolyte leakage from injured cells (Inj, %), canopy temperature (CT, °C), proline content (PC, μg g-1), leaf chlorophyll content (CC, SPAD), flag leaf area (FLA, cm2) and specific leaf weight (SLW, mg cm-2) were taken on the flag leaves. The RWC was determined at the heading according to the procedure described by Pask et al. (2012). Five flag leaves were collected and weighed to get the fresh weight (FW). The leaves were placed into test tubes containing 10 mL of distilled water and kept in dark for 24 h before being weighed to get the turgid weight (TW). The leaf samples were oven dried at 80 °C for 48 h to record the dry weight (DW). RWC was calculated as: RWC (%) = [(FW - DW)/(TW - DW)] × 100. The electrolyte leakage from injured cells (Inj) was performed on the fully expanded flag leaves according to Bajji et al. (2001). Two leaves were randomly collected for each genotype, washed with tap water then, distilled water to remove adherent dust, and cut into 1 cm length segments. Ten leaf pieces were placed in test tubes containing 10 mL of double-distilled water. The test tubes were placed at the ambient temperature of the laboratory, and periodically and manually agitated.The first reading of their electrical conductivity was recorded after 24 h (EC1) using a laboratory conductivity meter (HI 2300 EC/TDS/NaCl Meter, Hanna Instruments). The tubes were then placed in a boiling water bath at 100 °C for 1 h and their conductivity was recorded (EC2). The Inj was calculated as follows: Inj (%) = (EC1/EC2) × 100. The CT measurements were taken between 12:00 and 14:00 hours on a sunny day using a portable infrared thermometer (Fluke Corporation, Everett, WA, USA). Three measurements were taken per plot at approximately 0.5 m distance from the plot edge. The PC was determined according to the procedure described by Monneveux and Nemmar (1986). The CC was determined for three random flag leaves in each plot with a SPAD-502 chlorophyll meter (Minolta Co. Ltd., Tokyo, Japan). The FLA was determined from a 5-leaf sample. Leaf length (L) and wide (l) were measured and the area was determined according to Spagnoletti-Zeuli and Qualset (1990) using the following formulae: FLA (cm²) = 0.607 (L × l). The specific leaf weight (SLW) was obtained after drying the leaf samples as SLW (mg cm-2) = DW/FLA (Amanullah, 2015), wherein DW is the fresh weight and FLA is the flag leaf area of the sample. Plant height (PH, cm) was recorded just before harvest, from the ground to the tip of the main spike, awns excluded. Grain yield (GY, g m-2), spikes weight (SW), and the number of spikes (NS) were determined according to one linear meter for each genotype and then converted to square meter. Thousand kernel weight (TKW, g) was obtained after threshing of the spikes from the mass of 250-grains sample per plot.
Statistical analysis
Data recorded for measured traits were subjected to a one-way analysis of variance (ANOVA) to test the differences among genotypes at a 5% probability level. The phenotypic coefficient of variation (PCV), genotypic coefficient of variation (GCV), broad-sense heritability (h²bs), genetic advance (GA), and genetic advance as a percentage of the mean (GAM) were calculated for each trait based on the mean square values obtained from the ANOVA according to the equations given by Johnson et al. (1955) and Acquaah (2012) as follow:
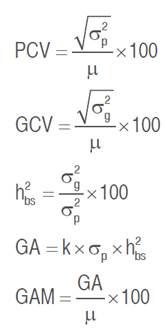
Where,  is the phenotypic variance,
  is the genotypic variance,
  is the grand mean of the trait and k is the efficacy of selection, which is 2.06 at 5% selection intensity.
Phenotypic and genotypic correlation coefficients for each pair of traits were computed as described by Mansouri et al. (2018). Path analysis based on genotypic correlation coefficients was also done to calculate the direct and indirect path coefficients according to Dewey and Lu (1959). GY was considered a response variable, while other traits as causal/independent variables. All statistical analyses were performed using OPSTAT software.
RESULTS AND DISCUSSION
Analysis of variance, means, phenotypic and genotypic variability
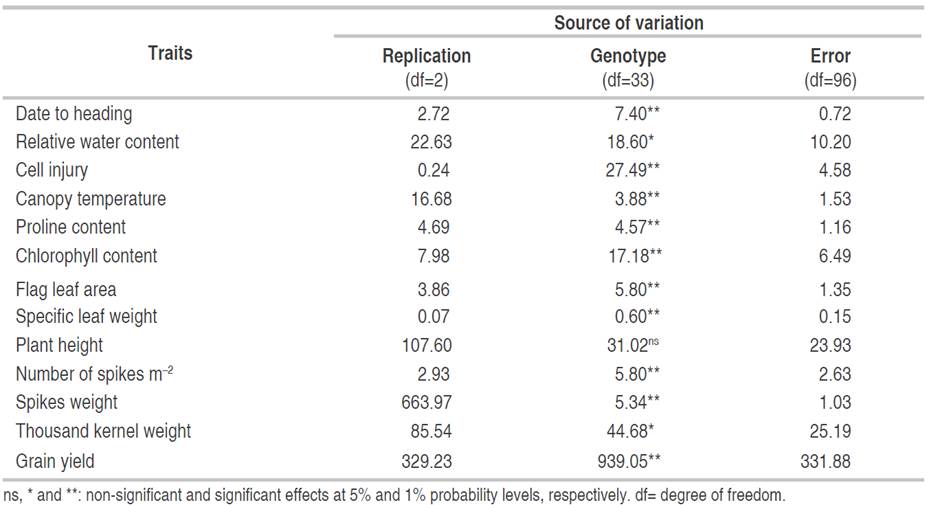
In crop breeding programs aimed at producing new varieties with improved yield potential, the efficiency of selection mainly depends upon the amount of genetic variability present in the plant population. The results of ANOVA revealed highly significant differences among the studied genotypes (except for plant height), suggesting the presence of a considerable amount of variability among the plant material investigated (Table 3). Bendjama and Ramdani (2022) reported the existence of genetic variation among wheat genotypes. The same findings were shown for other crops from the same family such as durum wheat (Triticum durum Desf.) (Mansouri et al., 2018), barley (Hordeum vulgare L.) (Dinsa et al., 2018), and rice (Oryza sativa L.) (Tiwari et al., 2019) regarding various traits including CC, PC, days to heading, days to maturity, PH, spike length, NS, number of grains per spike, GY, TKW, and harvest index.
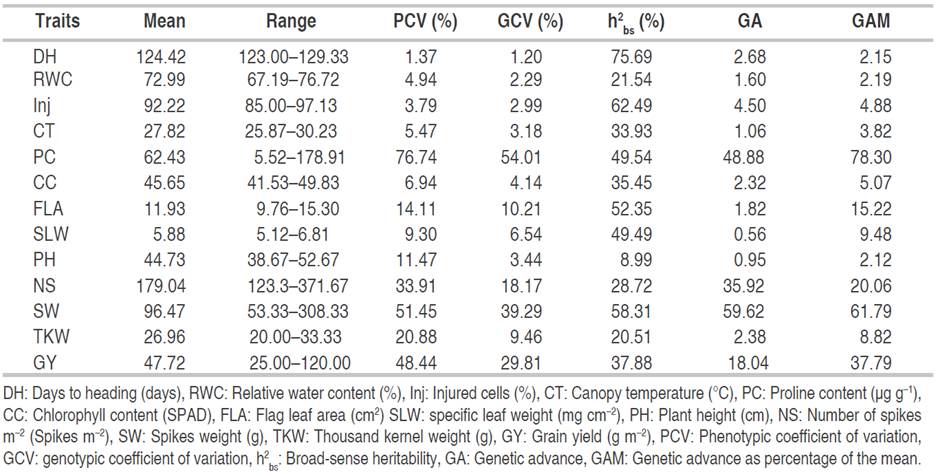
Estimates of means and ranges of average values observed for wheat traits evaluated are presented in Table 4. Mean values for days to heading varied from 123.00 (L7, L11, L24, L26, L27) to 129.16 (L16) with an overall mean of 124.42 days. For RWC, these figures were 67.19 (L27) and 76.72% (L10). The min, max, and average values of cell injury, were 85.00 (L22), 97.13 (L8), and 92.22%, respectively; of CT were 25.87 (L18), 30.23 (L1), and 27.82 °C; of PC were 5.52 (L12), 178.91 (L3), and 62.43 μg g-1; and CC varied from 41.53 (L6) to 49.83 (C4) with an overall mean of 45.65 SPAD. The mean values for FLA were 9.76 (L25) to 15.30 (L17) and 11.93 cm2. For specific leaf weight, minimum, maximum, and average values were 5.12 (L28), 6.81 (L8,) and 5.88 g cm-2, respectively. Similarly, PH mean values were 38.67 (L30), 52.67 (L10), and 44.73 cm. These values were 123.33 (C4), 371.67 (L1), and 179.04 spikes for the number of spikes m-2; 53.33 (L7), 308.33 (L1), and 96.47 g m-2 for SW; 20.00 (L5, L15, L22, C2), 33.33 (L1, L21) and 26.96 g for TKW; mean values characterizing GY values were 25.00 (L7), 120.00 (L1) and 47.72 g m-2 (Table 4).
Table 4 Estimation of means, ranges, phenotypic coefficient of variation, genotypic coefficient of variation, broad-sense heritability, genetic advance, and genetic advance as percent of mean of measured traits in bread wheat genotypes.
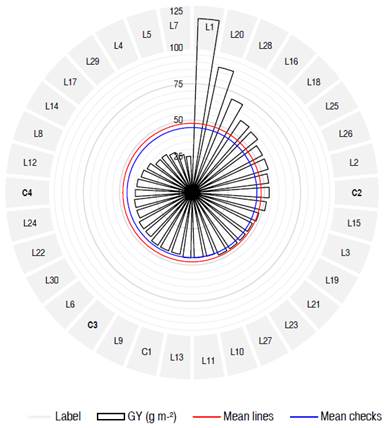
According to the presented results, it was observed that among all the material studied, line L1, showed elevated values for all the agronomic traits such as the NS, SW, TKW, and GY that give opportunities for wheat breeders to exploit its potential for breeding purposes. Lines L20 and L28, and to a lesser extent L16 and L18 also appeared as desirable entries as they exhibited better yield performances when compared to other wheat genotypes including control checks (Figure 1). These five promising lines also surpassed the rest of the lines and check varieties for other desirable traits such as NS, SW, and TKW; and proved better than control checks for stress tolerance-related traits including RWC, Inj, and CT.
Studying heritable and non-heritable factors in the total variability facilitates the breeding procedure, giving meaningful and specific details about the population under evaluation. The estimates of the phenotypic coefficient of variation (PCV), genotypic coefficient of variation (GCV), broad-sense heritability (h2 bs), genetic advance (GA), and genetic advance as percentage of mean (GAM) for 13 assessed traits are given in Table 4. The PCV ranged from 1.37 to 76.74%, whereas, the GCV ranged from 1.20 to 54.01%. PCV and GCV estimates were categorized as low (0-10%), moderate (10-20%), and high (>20%) values as indicated by Sivasubramanian and Menon (1973). The highest PCV was observed in PC (76.74%), followed by SW (51.45%), GY (48.44%), number of spikes (33.91%), and TKW (20.88%). Moderate values of PCV were obtained in FLA (14.11%) and PH (11.47%), and low PCVs were found in the remaining recorded traits. The estimates of GCV were high for PC (54.01%), SW (39.29%), and GY (29.81%); moderate for the number of spikes per unit area (18.17%) and FLA (10.21%); and low for the rest of the attributes suggesting small exploitable genetic variability and less potential for favorable advance in selection. These results agree with the conclusions of Mekaoussi et al. (2021) who reported a relatively low genotypic variability among physiological traits such as RWC, flag leaf CC, CT, and membrane stability index assessed in a set of 25 durum wheat genotypes under south Mediterranean conditions. These authors demonstrated high environmental coefficients of variation (CVe) and explained their results by the lack of precision and/or the environmental effects on the expression of recorded traits. Among the yield attributing traits, the PCV values were, in general, greater than the GCV, which reflects the influence of the environment in the expression of these evaluated characteristics. These findings were in agreement with those of Din et al. (2018) and Regmi et al. (2021).
According to Regmi et al. (2021), PCV and GCV only indicate the amount of total variability available in an assessed trait and do not split it into heritable (genotypic variance) and non-heritable (environmental variance) fractions. Thus, the heritability parameter is largely used to separate genetic and environmental components of this phenotypic variation. Under this context, breeders try to minimize the influence of the environment as much as possible to identify the genes of interest for their efficient performance on agronomic traits. Moreover, estimates of heritability have a role to play in determining the effectiveness of selection for a such trait. They were previously classified as low (0-30%), moderate (30-60%), and high (>60%) values as indicated by Robinson et al. (1949). The highest heritability (h2 bs) estimated was exhibited by days to heading (75.69%) followed by cell injury (62.49%), indicating a higher contribution of the genotype in the expression of the phenotype rather than the environment. These results are consistent with the finding reported by Farooq et al. (2011) who also revealed high heritability for days to heading and relative cell injury percentage in wheat under both normal and heat stress conditions, suggesting that selection for these traits is highly desirable. Moderate heritability estimates were observed for CT (33.93%), PC (49.54%), CC (35.45%), FLA (52.35%), SLW (49.49%), SW (58.31%) and GY (37.88%). The lowest heritability values were found in RWC, PH, NS m-2, and TKW with estimates below 30%. Low heritability can be explained by the high environmental influence over the expression of these traits and therefore, selection will not be worthwhile (Acquaah, 2012).
Genetic advance as percentage of mean (GAM) indicates the predicted genetic gain for a particular trait under selection cycles and measures the extent of its stability under selection intensity. This parameter depends upon the genetic coefficient of variation and heritability and selection differential. Johnson et al. (1955) categorized the GAM into low (0-10%), moderate (10-20%), and high (>20%). The greatest GAM of 78.30 was observed in PC followed by 61.79 in SW, 37.79 in GY, and 20.06 in NS m-2. GAM was found just intermediate in the FLA (15.22) and low in the remaining traits. The obtained results are consistent with those of Seyoum and Sisay (2021) for PH, Hossain et al. (2021) for CT, Fellahi et al. (2019) for heading date and FLA, Din et al. (2018) for TKW, and Regmi et al. (2021) for the number of fertile tillers and GY.
Heritability in conjunction with genetic advances was reported to be more useful than heritability value alone in selecting individuals with desired characteristics (Johnson et al., 1955). Accordingly, high heritability (75.69 and 62.49%) coupled with low GAM (2.15 and 4.88) were recorded in the days to heading and cell injury, respectively. As a result, it appears that these characteristics were primarily influenced by the interaction of genetic and environmental factors. Thus, it is not feasible to select wheat individuals based on the genotypic values of these two recorded traits. Similar findings have been reported in wheat by Fellahi et al. (2013) and Hossain et al. (2021). PC, SW, and GY showed moderate heritability (49.54, 58.31, and 37.88%) coupled with high GAM (78.30, 61.79, and 37.79), respectively. This reflects the additive gene action in the expression of these traits and selection could bring desirable changes over the population mean. These findings corroborate earlier results stated by Regmi et al. (2021) for yield attributing traits including grain weight per spike, thousand-grain weight, GY, and harvest index. In the FLA moderate heritability (52.35%) coupled with moderate GAM (15.22) but with low genetic advance (GA) of 1.82% were observed. This finding implies that FLA-based selection would not be successful. Fellahi et al. (2019) also found similar results for this morphological trait in F2 bread wheat progenies. Moderate heritability (33.93, 35.45, and 49.49%) accompanied by low GAM (3.82, 5.07, and 9.48) was explored by CT, CC, and SLW, respectively. A low heritability estimate (28.72%) joined with high GAM (20.06) was observed for NS m-2 and low heritability and its simultaneous GAM were recorded in RWC (21.54% and 2.19), PH (8.99% and 2.12), and TKW (20.51% and 8.82) reflect the occurrence of non-additive gene effect and high influence of the environment in the expression of these traits. Thus, selection based on these traits would not be desirable. This finding agrees with the report of Salmi et al. (2019) who found that expected responses to selection were low for RWC and just moderate for PH and TKW.
Phenotypic and genotypic correlations among assessed traits
As a result of the substantial and positive correlation between the traits, selection for one feature would have a direct impact on the expression of another trait, facilitating selection and advancement in the breeding program. The degree and direction of the relationships between assessed traits are measured by correlation coefficient analysis. Phenotypic (rp) and genotypic (rg) correlation coefficients among wheat recorded traits in this study are given in Table 5. Days to heading possessed a negative and significant correlation with SLW and TKW at phenotypic (rp=-0.272* and rp=-0.215*) and genotypic (rg=-0.382* and rg=-0.660*) levels. DH also showed significant genotypic associations, negative with GY (rg=-0.208*), and positive with CT (rg=0.310*), PC (rg=0.201*) and PH (rg=0.247*). The correlation of RWC with NS m-2 (rp=0.283* and rg=0.726*) was found positive and significant at both levels. However, RWC had highly significant genetic correlations with CT (rg=-0.259*), PC (rg=0.466*), CC (rg=-0.300*), FLA (rg=-0.687*), PH (rg=-0.658*), SW (rg=0.441*) and GY (rg=0.315*). On the contrary, it revealed a non-significant phenotypic correlation with these traits as presented in Table 5.
Table 5 Phenotypic (lower triangle) and genotypic (upper triangle) correlation coefficients among measured traits in evaluated bread wheat genotypes.
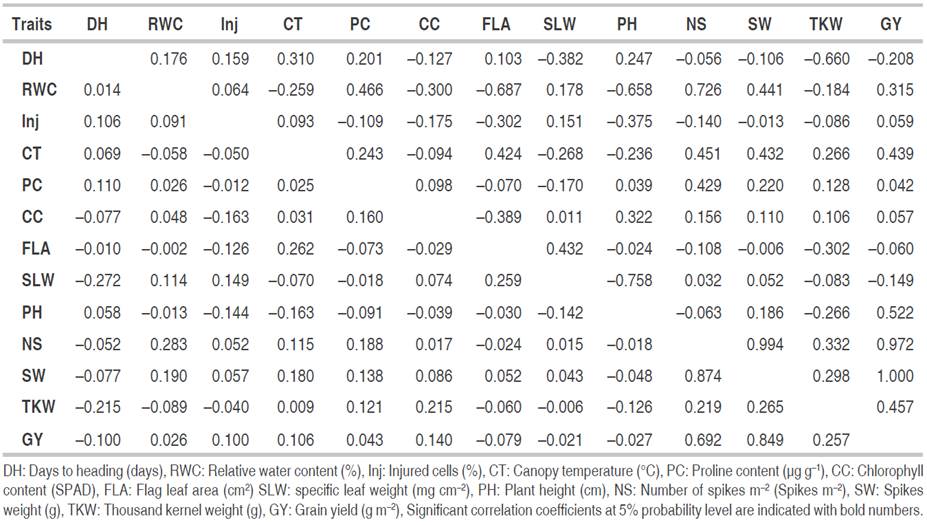
Correlation of cell injury with FLA (rg=-0.302*) and PH (rg=-0.375*) at the genotypic level was found significant and negative. However, their respective phenotypic correlations were observed negative but non-significant. Similarly, CT revealed significant and positive phenotypic (rp=0.262*) and genotypic correlation (rg=0.424*) with FLA. Besides this, relation of this trait with PC (rg=0.243*), SLW (rg=-0.268*), PH (rg=-0.236*), NS (rg=0.451*), SW (rg=432*), TKW (rg=266*) and GY (rg=0.439*) at genotypic level was found significant with different directions. PC demonstrated positive genotypic relationship with NS (rg=0.429*) and SW (rg=0.220*); whereas CC exhibited positive phenotypic association with TKW (rp=0.215*) and significant correlations at genotypic level, negative with FLA (rg=-0.389*) and positive with PH (rg=0.322*). There was a significant and positive correlation between FLA and SLW (rp=0.259* and rg=0.432*). However, only genotypic correlation was observed as significant and negative with TKW (rg=-0.302*). The genotypic correlation between SLW and PH was negative and significant (rg=-0.758*). This last trait also presented significant genotypic relations, negative with TKW (rg=-0.266*) and positive with GY (rg=0.522*). In addition to its significant negative relationship with days to heading and positive associations with RWC, CT, and PH, GY demonstrated positive and highly significant correlations with NS, SW, and TKW at phenotypic (rp=0.692*, rp=0.849* and rp=0.257*) and genotypic (rg=0.972*, rg=1.000* and rg=0.457*) levels, respectively. NS also exhibited positive and significant phenotypic and genotypic correlations with SW (rp=0.874* and rg=0.994*) and TKW (rp=0.219* and rg=0.332*). Besides, these last two traits registered a strong positive association with each other in both phenotypic (rp=0.265*) and genotypic (rg=0.298*) levels. These results are consistent with the previous findings by Fellahi et al. (2013) who reported that GY showed positive and significant correlations, positive with CC, PH, spike length NS plant-1, TKW, and harvest index, and negative with days to heading and number of grain per spike at both phenotypic and genotypic levels. Simultaneous improvement of all these yield component traits is therefore feasible. The highly significant and negative correlation observed between days to heading and GY indicated that selection of earliness would be a very crucial key for the enhancement of yield under rainfed conditions among the plant material under selection. Mansouri et al. (2018) also encouraged this selection approach since early genotypes selected showed above-average spikes in number, grain, and biological yields and greatly avoided terminal heat stress. Improvements in RWC and PH will lead to an increase in the GY. The above statement is fully supported by the findings of Al-Ashkar et al. (2021) describing the situation that selection based on RWC along with CT, green leaves area, and leaf area index might improve genetic gain for GY in stressful environments.
Path analysis
Path coefficient analysis subdivides the correlation coefficient into direct and indirect effects, which allows determining which attribute influences substantially the dependent variable. The direct and indirect effects of evaluated phenotypic traits on GY as a response variable are presented in Table 6. TKW (0.130) had the highest positive direct effects on GY. On the other hand, the strongest negative direct effect was exhibited by NS m-2 (-0.538) followed by RWC (-0.167), CC (-0.159), SLW (-0.156), CT (-0.135) and FLA (-0.135). Conversely, the causal variables days to heading, cell injury, and PH showed negligible direct effects on yield.
Table 6 Direct (diagonal) and indirect (off-diagonal) genotypic effects of yield contributing traits on grain yield of wheat genotypes evaluated.
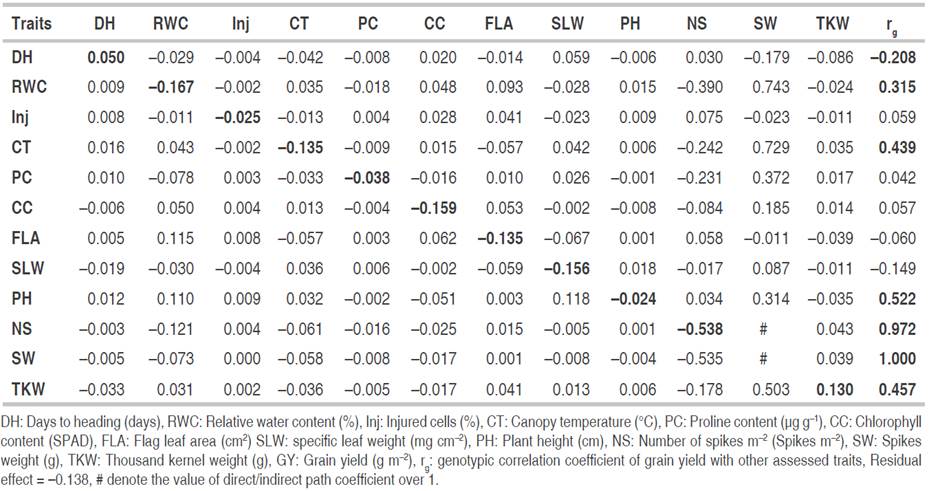
RWC (0.743) followed by CT (0.729), TKW (0.503), PC (0.372), PH (0.314) and CC (0.185) showed important and positive indirect effects on GY through SW. The indirect effect of days to heading on yield through SW was negative (-0.179). In addition, SW (-0.535), PC (-0.231), and TKW (-0.178) had consequent negative indirect effects on GY by total NS m-2. FLA and PH had high significant indirect positive effects of 0.115 and 0.110 on GY, respectively, through RWC, whereas NS m-2 acted on yield negatively (-0.121) through it. PH depicted a high indirect positive effect of 0.118 on GY through SLW. The residual effect appeared to be non-negligible (-0.138), indicating that other possible independent/causal variables (secondary traits) which were not included in the study could significantly influence the dependent variable (main trait or yield).
Path analysis procedure was largely used by researchers in wheat breeding under various growth conditions. According to Mohammadi et al. (2012), PH, days to maturity, agronomic score, and TKW exerted the highest positive direct effect on GY and could be reliable selection criteria for selection under drought tolerance conditions. Shamsi et al. (2011) revealed that TKW was the most important yield component, which agrees with the results of the present study. Breeding to enhance the potential yield of wheat genotypes through this trait has been reported as a promising approach both in dryland and irrigated conditions (Mohammadi et al., 2012). In their studies, Rabti et al. (2020) and Mekaoussi et al. (2021) showed that the GY of durum wheat depended on biomass, NS, TKW, number of kernels per spike, and harvest index under rainfed environments. Their results also pointed out that physiological traits had negligible direct effects and small indirect effects on GY by biomass, NS, and harvest index. But the morpho-agronomic traits measured did not express any notable indirect effects on GY through physiological traits which are in agreement with the findings of the present investigation.
CONCLUSIONS
Mean squares for all measured agronomic traits, PH excluded, showed significant differences among all bread wheat genotypes evaluated. The estimated PCV values were high for PC, SW, NS, TKW, and GY. The remaining traits recorded moderate to low PCV estimates. Similarly, GCV values were high for PC, SW, and GY; and moderate to low for the rest of the measured variables. The PCV values were higher than GCV estimates for all traits studied. It was found that PC, SW, and GY had moderate to high heritability along with high genetic advance as a percent of mean together with wide genetic variation and lower environmental influence indicating the involvement of additive genetic effects in the inheritance of these traits which might be effective for the selection under stressful environment. Under these growth conditions, positive and highly significant correlations were found both in phenotypic and genotypic levels between GY and NS, SW, and TKW. Moreover, a high positive direct effect at the genotypic level was exhibited by the characters SW and TKW. The highest positive indirect effects were demonstrated by RWC, CT, TKW, PC, PH, and CC through SW. The results of mean performance showed that there might be some promising breeding lines such as L1, L20, L28, L16, and L18 which were adapted to semi-arid conditions of the Eastern High plateaus of Algeria and had the ability to perform better even under water stress.

