


 English (pdf)
 Article in xml format
 Article references
 Send this article by e-mail
 Cited by SciELO
  Cited by Google
  Similars in
SciELO
Similars in
SciELO  Similars in Google
 Permalink
Papaya (Carica papaya L.) is among the most cultivated and consumed tropical fruits globally. This crop is characterized by accelerated annual increases in production, even among commercial produce (Altendorf 2017). The main papaya producers are India, Brazil, México, Nigeria, Indonesia, and the Dominican Republic; Colombia ranks thirteenth, with 146,186 t in 6,944 ha. Although papaya production in Colombia has increased by 30% since 2000 (FAO 2020), the existing cultivars are continuously exposed to various environmental stresses (biotic and abiotic), affecting the fruit yield potential and limiting the local fruit growers. Genetic breeding programs are essential to overcoming these limitations and ensuring greater competitiveness and aim to develop hybrids, insert genes of interest, molecular selection, and micropropagation (An et al. 2020). However, these approaches do not consider interactions between the environmental conditions and the plant's physiological responses (Tardieu 2012). Therefore, genetic breeding processes need to understand how plants respond to environmental stress conditions to advance understanding of causes that influence yield, responses to environmental variations, and morphological adaptations (Catarina et al. 2020). Several studies have focused on physiological breeding in papaya to obtain genotypes highly tolerant to water deficits and excess, high CO2 fixation, precocity, and adaptation to different environmental conditions (Reynolds et al. 2013). In this sense, Girón et al. (2021) pointed out that high cuticular wax contents contribute to greater tolerance to water deficit stress. Vincent et al. (2018) found a correlation between tolerance to water deficit and light stress; adapting plants to water deficits helps mitigate radiation excesses. Peçanha et al. (2017) indicated that high electrical conductivity in soil affects gas exchange rates, reducing plant growth. The plant's physiological breeding provides new approaches for investigating the selection of new papaya materials; hence, regarding the papaya species, according to Jiménez et al. (2014), the ideal plant morphological characteristics for high yield (70-90 fruits per plant) is that plant less than 2 m in height, with approximately 24 adult leaves and 5 to 10 cm stem diameters. The UN Cotové variety was obtained by crossing a local creole variety (Cuban origin) and a Cariflora variety from Florida (Reyes 1996). UN Cotové is cultivated in Antioquia, Risaralda, and north of Valle del Cauca. It stands out for its tolerance to viruses, with a yield of around 131 t ha-1, adapted to tropical dry forests (T-df) conditions, and has a savoriness (Vallejo 1999). However, the dioecious nature of the UN Cotové variety is the main reason for the loss of purity of this genetic material. Therefore, in response to achieving the genetic identity of this cultivar, this study aimed to characterize the morphology of the UN Cotové variety under topical dry forest (T-df) environmental conditions in Santa Fe de Antioquia, Colombia.
MATERIALS AND METHODS
Experiment location
This study was carried out at the Cotové Agrarian Station (AS) of the Universidad Nacional de Colombia, Medellín. The Cotové AS is located at 6° 31' 57"N and 75° 49' 40W W, and 507 masl, in the El Espinal village, Santa Fe de Antioquia, Colombia.
Characterization of the agroecosystem
In the study period (May to November 2018), the weather conditions of the site of the investigation were an average temperature of 27 °C, with a maximum of 42.5 °C and a minimum of 16.8 °C; the average relative humidity was 71%, the average rainfall was 815 mm. The agroecosystem corresponds to the tropical dry forest life zone (T-df) according to Holdridge's (1978) classification. With Inceptisol soil type, clayey texture, pH=6.7 and concentrations of N (56 mg kg-1), P (36 mg kg-1), B (1.3 mg kg-1), K (0.44 cmol kg-1 ), Ca (20.4 cmol kg-1) and Mg (9.6 cmol kg-1).
Growing conditions of plant material
The papaya variety UN Cotové was used. Planting was carried out at 2.5 m between plants and 3 m between rows, distributed in a triangle (1,333 plants ha-1). The fertilization involved applying 2 kg of organic matter (chicken manure), and 120 g of a mixture of 25 kg of CO(NH2), 25 kg of KCL, and 500 g of H3BO3 per plant.
Morphological traits
Study variables
The experimental unit consisted of 18 plants, taken randomly within the nine central rows, two plants per row. In each of the experimental plants, six morphological variables were evaluated monthly according to IBPGR (1989): plant height (PH) (cm); stem diameter - SD (mm); internode length - IL (cm); the number of leaves - LN; canopy length (North-South and East-West) (cm); and the area occupied by the plant - AOP (cm2). The height (cm) was quantified, taken from the base of the plant to the apical meristem, the diameter of the stem (mm) at 15 cm from the soil, the number of leaves according to the descriptors of the IBPGR (1989); the canopy length in the North-South (cm) and East-West (cm) directions; and the area occupied by the plant - AOP (cm2), the latter considering that the papaya canopy has a circular distribution as proposed by Wang et al. (2014).
Thermal time
The heat sum method was used to consider the temperature effect on plant growth and development as accumulated growing degree days (GDD) according to Equations (1) and (2). Riaño et al. (2005) suggested the simple sine method between the appropriate physiological temperature thresholds (lower limit Ll and upper limit Ul) because a symmetric daily temperature behavior is assumed for the maximum temperature with equal minimum temperatures typical of tropical conditions. For papaya, these limits are 15 to 32 °C, respectively (Allan 2002).


Where: U l = Upper limit, L l = Lower limit; Tmax = Maximum temperature; Tmin = minimum temperature, and α = (Tmax-Tmin) / 2. The temperatures are expressed in degree celsius (°C).
Statistical analysis
A Pearson correlation matrix carried out the degree of correlation between the different variables evaluated. A non-hierarchical cluster analysis (k-means) was carried out in a multivariate structure. The Hopkins and Gap statistic determined the clustering trend and the appropriate number of clusters.
Statistical differences between groups were evaluated through a repeated-measures analysis of variance (RM ANOVA). Shapiro-Wilk and Bartlett tests and post-hoc comparisons from the Tukey test (P<0.05%) were performed to qualify the statistical hypotheses of normality and homoscedasticity of variances. In addition, the plant growth was described as a function of the GDD by adjusting polynomial regression models up to the third degree. The models were selected with R2 - adjusted, RMSE (Root mean squared error), and Akaike information criterion. The non-linear functional models were: Logistic (L), Log-logistic (LL), Log-Normal (LN), Gompertz (G), and Weibull (W). Using the R Studio, the models were estimated with the Analysis of Dose-Response Curves "drc" library, and the "mselect" function. This facilitates selection between non-linear models based on Log-likelihood value and IC value, which summarize the Akaike criterion and Lack of Fit tests, using P<0.05 as a guideline to accept the null hypothesis. All processes were developed using the R Studio statistical software (R Development Studio Team 2020).
RESULTS AND DISCUSSION
Pearson Correlation
The Pearson correlation helped identify variables that can be used to model data according to the degree of correlation (Figure 1). After data exploration, a high correlation was observed as a function of GDD for all variables except for IL. Temperature is one of the main climatic factors that condition the development of papaya (Almeida et al. 2003), and knowledge of the thermal requirements measured in GDD is essential to predict growth and harvest (Salinas et al. 2019). The highest correlation (0.99) was presented between the NS and EW. As Wang et al. (2014) stated, these results confirm that the papaya plant shows a symmetrical position of the leaves in a spiral arrangement around the stem. All the variables had a high correlation (higher than 0.82) with plant height, except for the IL. The IL did not correlate with any variable, contrary to those exposed by Lim and Hawa (2005) in a study on early flowering, who concluded that IL has a strong correlation with PH. The differences found for this variable can be generated by high sensitivity in IL to environmental changes and competition generated by adjacent plants, which promotes the development of longer internodes (Jiménez et al. 2014).
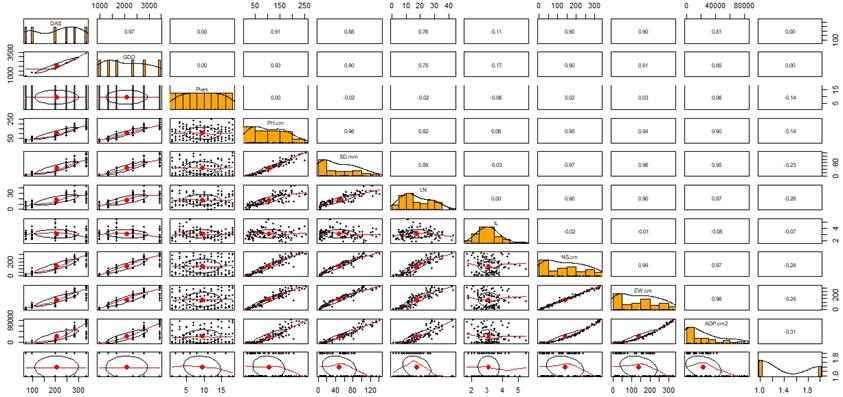
Figure 1 Pearson correlation matrix for the variables plant height (PH), stem diameter (SD), number of leaves (LN), internode length (IL), canopy length N-S and E-W, and the area occupied by the plant (AOP) in papaya plants variety UN Cotové. Cotove SA. Santa Fe de Antioquia, Colombia.
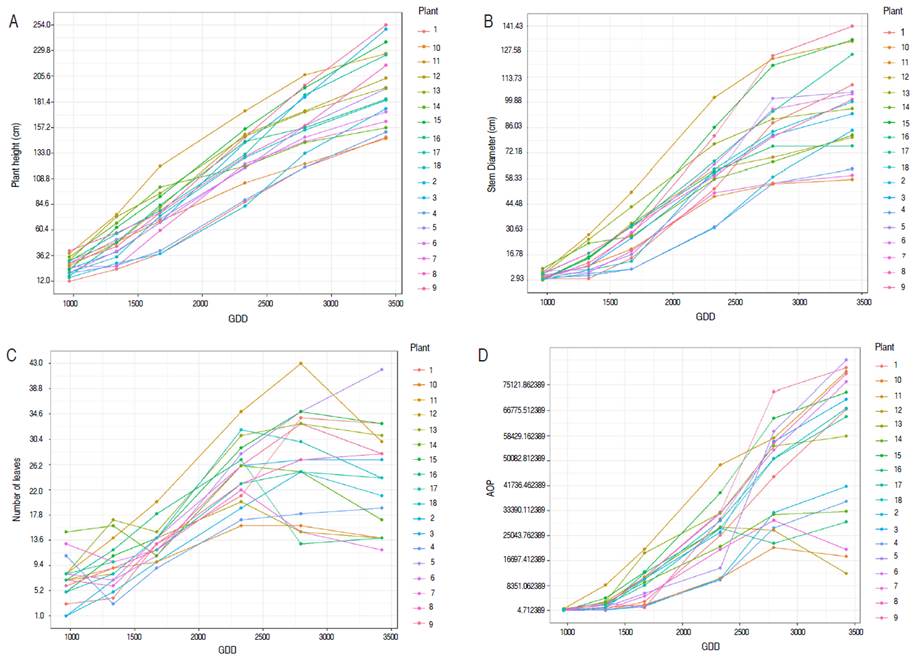
Figure 1 shows the behavior of the variables PH, SD, LN, and AOP as a function of the accumulated GDD for each measurement. In general, from the fifth measurement, two groups of plants were differentiated; for SD, the separation occurred from the fourth measurement. However, at the end of plant development, there four groups were identified (Figures 2A and 2B). In the third measurement, a stem growth reduction was observed near 2330 GDD, similar to those found by Almeida et al. (2003), which shows that changes in growth and development occur regardless of the location or sowing season. However, the behavior of the variables depends on the accumulation of GDD or thermal temperature.
An accelerated development was evidenced for LN between the second and fourth measurements (Figure 2C). Between the fourth and fifth measurements, LN decreased, coinciding with the flowering stage (90% of the plants) at 2067 GDD. Flowering is a phenological stage where photo-assimilates are used to provide the energy required for floral differentiation. The stem and leaf growth rate decreases due to the indeterminate growth habit of papaya with simultaneous vegetative growth, flowering, and fruiting (Singh et al. 2010). Thus, presenting competition between vegetative and reproductive sinks (Zhou et al. 2000). Conversely, for AOP, all individuals showed very similar values in the first stages of growth. However, some changes separated two groups between the fourth and fifth measurements (Figure 2D).
Grouping
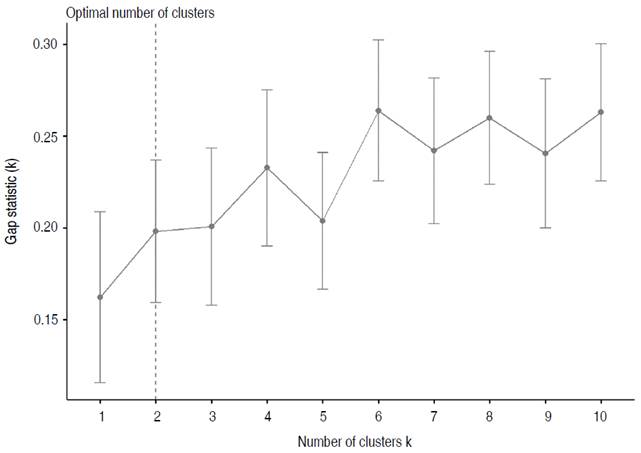
The data analysis showed that the grouping occurred between the fourth and fifth measurements depending on the variables. According to Qiu and Cao (2016), the data will be more uniform when the Hopkins statistic is close to 0.5. Therefore, once the non-uniformity of the data had been defined with the Gap statistic (Figure 3), the formation of four homogeneous groups presented differences.
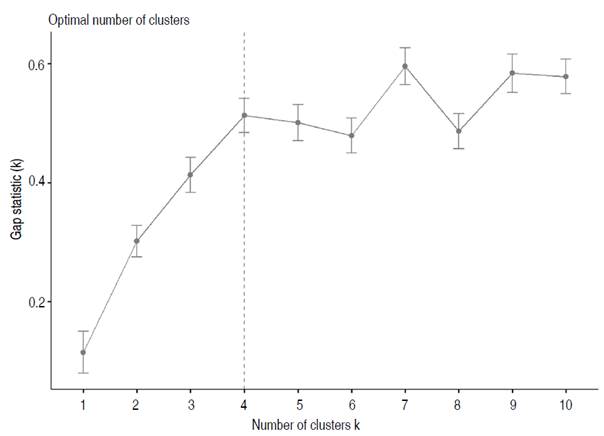
Figure 3 The optimal number of clusters with the Gap method for all data recorded during the growth of the UN Cotové papaya variety.
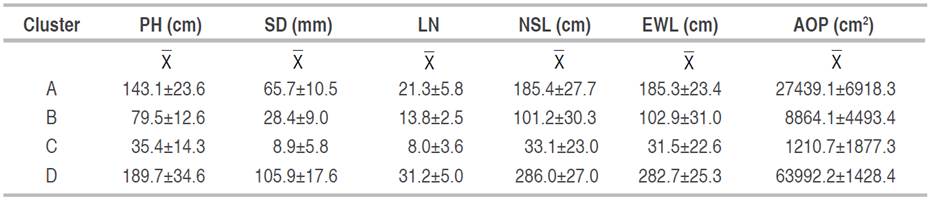
Based on the k-means procedure, all observations were divided into four groups (Figure 4), in which the internal variance between the data was the smallest (Na et al. 2010). Group D had the plants with higher average values for all variables, followed by groups A and B, and finally, group C, which grouped the plants with the lower values (Table 1).
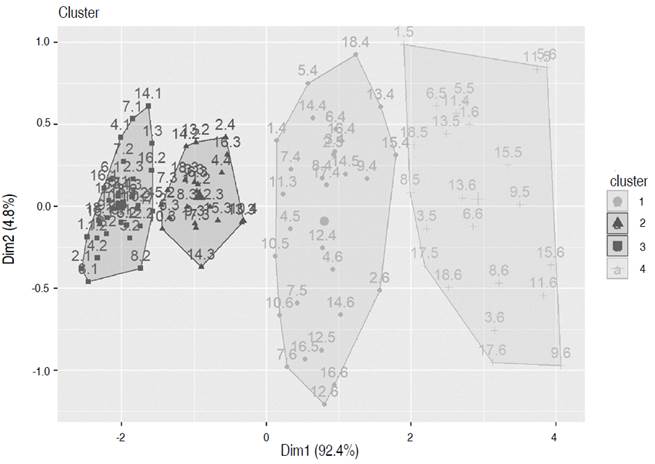
Figure 4 Clusters were determined with all data recorded during the growth of the UN Cotové papaya variety, according to the k-means methodology.
Table 1 Values of plant height (PH), stem diameter (SD), number of leaves (LN), NS length (NSL), EW length (EWL), and the area occupied by the plant (AOP) determined in four clusters of UN Cotové papaya variety plants.
One of the difficulties in this first grouping into four clusters was that separating the groups did not discriminate the individuals or the states of specific development in the experimental units (Table 2). On the contrary, the groupings were made from the magnitude of each variable vector, determined by the plant age, associated with the evaluation time (measurement). Cluster C grouped the lowest values, with 100% of the data recorded in the first, 83% in the second, and 22% in the third. The benefit of this first grouping was identifying when the plants presented differences, the essential information in a plant breeding program for recognizing outstanding quality parameters from selecting individuals with characteristics of interest.
Table 2 Clustering for the UN Cotové papaya variety plants according to the group assigned by the k-means methodology.
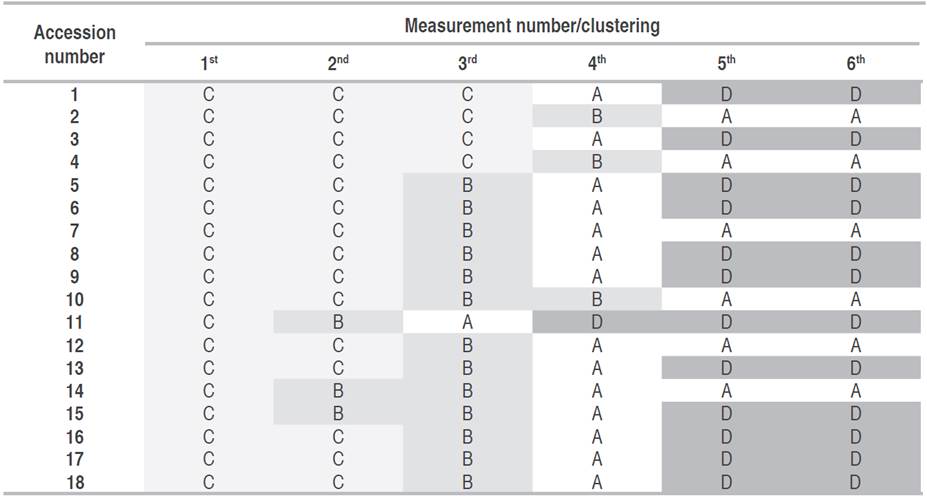
All plant were homogeneous in their characteristics, grouped in cluster C in the first measurement. In the second measurement, plants 11, 14, and 15 were differentiated based on greater development. Plant 11 had superior growth for the third measurement, but plants 1, 2, 3, and 4 were the least developed. In the fourth measurement, the groups were separated, where plant 11 continued to stand out until reaching the highest height at the end. For this plant, this greater development did not imply early flowering as expected, with the report by Kumar et al. (2015), who stated a high correlation between these two variables. In the fifth and sixth measurements, the separation of the plants into two large groups was evident: cluster A, which includes plants with lower development, and cluster D, made up of the plants with higher values. A new analysis was carried out based on the Gap statistic. Only the values obtained for each variable in measurements 3, 4, and 5 were considered, forming two groups with different characteristics (Figure 5). The first group (A) was made up of individuals 2, 4, 7, 10, 12, and 14; while the second group was made up of 1, 3, 5, 6, 8, 9, 11, 13, 15, 16, 17 and 18.
Comparison between selected groups
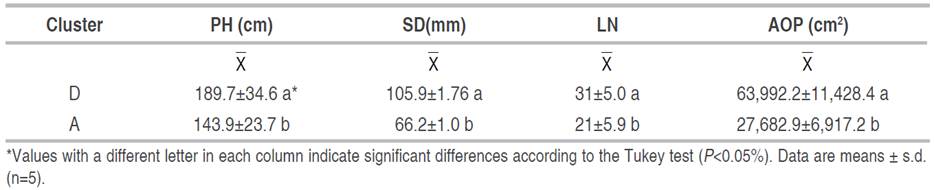
The assumptions of normality were checked inside all groups, and an analysis of variance was carried out with repeated measurements over time (measures). Statistical differences were observed between the groups for PH, SD, LN, and AOP (Table 3). All the morphological variables in group D (plants: 1, 3, 5, 6, 8, 9, 11, 13, 15, 16, 17, and 18) presented a higher mean value than in group A (plants: 2, 4, 7, 10, 12 and 14).
Table 3 Analysis of variance between groups with repeated measurements over time forplant height (PH), stem diameter (SD), number of leaves (LN), and the area occupied by the plant (AOP) determined in four clusters of UN Cotové papaya variety plants.
Ocampo et al. (2006) used cluster separation to evaluate geographical differences in papaya germplasm in Venezuela. The authors found two clusters, with a group representing the genotypes Venezuela, Trinidad, and Barbados and another for the genotypes Guadalupe, Martinique, and Granada. Similar to the four groups found in this study (Figure 3) using the Gap method, which separates data based on the lowest variance, optimizing the size of the groups, Asudi et al. (2010) compared the morphological diversity of germplasm in Kenya; they established four groups of plants, in which they identified vital traits to develop varieties adapted to different conditions.
The results obtained made it possible to identify the development stage of the papaya, where the plants show the most differences in the evaluated attributes, which supports breedings processes in the search for new progeny. Despite the plant height difference, the two groups of the UN Cotové papaya variety were short, with average heights of 189.7 cm (D) and 143.9 cm (A). According to Jiménez et al. (2014), papaya plants can reach up to 10 m, although hybrids and commercial varieties only grow up to 5 or 6 m. Almeida et al. (2003) found that the highest values for plant height and stem diameter corresponded to the highest productivity. However, plants with excessive heights make agronomic management more complex, whereas short plants are productive for a longer time. For stem diameter, Jiménez et al. (2014) pointed out that, in adult plants, it varies from 10 to 30 cm at the base and from 5 to 10 cm at the canopy. The stem diameter for the variety in this study was 10.59 cm in group D and 6.62 cm in group A. The stem provides structural support, storage capacity for defense substances (latex), transports water, nutrients, and various organic compounds, and is the site where fruits develop (Nabors 2006). Balakrishan et al. (1988) obtained a significant positive correlation between dry fruit weight, plant height, and stem circumference in 10 papaya cultivars, which suggests that plants from group D are preferred because stem diameter is a highly heritable trait and is highly influenced by the environment. The UN Cotové papaya variety presented 31 leaves for group D and 21 for group A. According to García (2010), reasonable values for a papaya cultivar in the adult stage are 30 leaves, requiring a minimum of 15 for an accepted fruit yield. Stem is relevant in production since a papaya leaf can support the development of three to four fruits (Jiménez et al. 2014). Plants with a large leaf area have a greater photosynthetic capacity, influencing the accumulation of carbohydrates in fruits (Zhou et al. 2000).
Growth modeling
Constructing a mathematical model for the two groups of plants allowed us to identify plant characteristics and predict behaviors using mathematical language through equations. The plant's development depends strongly on temperature, and this effect can be quantified using thermal time or GDD. Consequently, describing the growth dynamics of plants with equations based on thermal requirements for each phenological stage could help forecast the harvest date more accurately by reducing the observed variability, counting calendar days, predicting yield, and improving fruit quality (Salinas et al. 2019).
The proposed models fulfilled the assumptions of normality based on the Shapiro-Wilk test and homoscedasticity using the Bartlett test for all variables.
The appropriate degree for the different polynomials tested was selected with the adjusted R2 value, the mean squared error (RMSE), and the corrected Akaike index (Table 4). For plant height, the best model was a two-degree polynomial in both groups; for the other variables, a three-degree polynomial best explained the data, which corroborates the findings of Almeida et al. (2003). The second and third-order polynomial models best fit the relationships of GDD versus plant height, stem diameter, canopy diameter, and number of leaves for the different environmental conditions (Table 4).
Table 4 Adjusted R2, mean square error (RMSE), and corrected Akaike index used to select the degree of the most appropriate polynomial for plant height (PH), stem diameter (SD), number of leaves (LN), and the area occupied by the plant (AOP) in UN Cotové papaya variety plants.
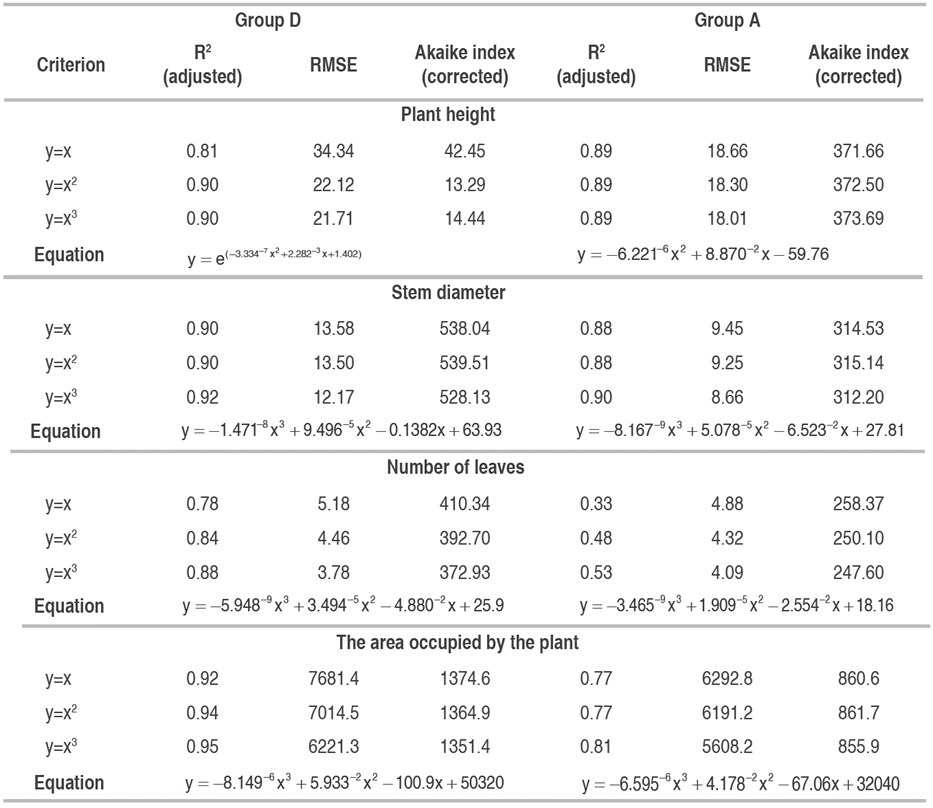
The graphical representation of the models is presented in Figure 6, where the group D plants show greater plant heights towards the end of the study (Figure 6A), with a very similar growth up to 1800 GDD. This result confirmed those obtained in the clustering, which indicated that the greatest morphological differences appeared after the fourth measurement. SD and the AOP exhibited a similar behavior; in the sixth measurement, the SD in group D was 64% greater than in group A, while the AOP was 35% greater in D. As for the LN, group A presented the highest value at the beginning of the plant development. However, after the fourth measurement, group D exceeded the foliar emission rate by 50% to group A.
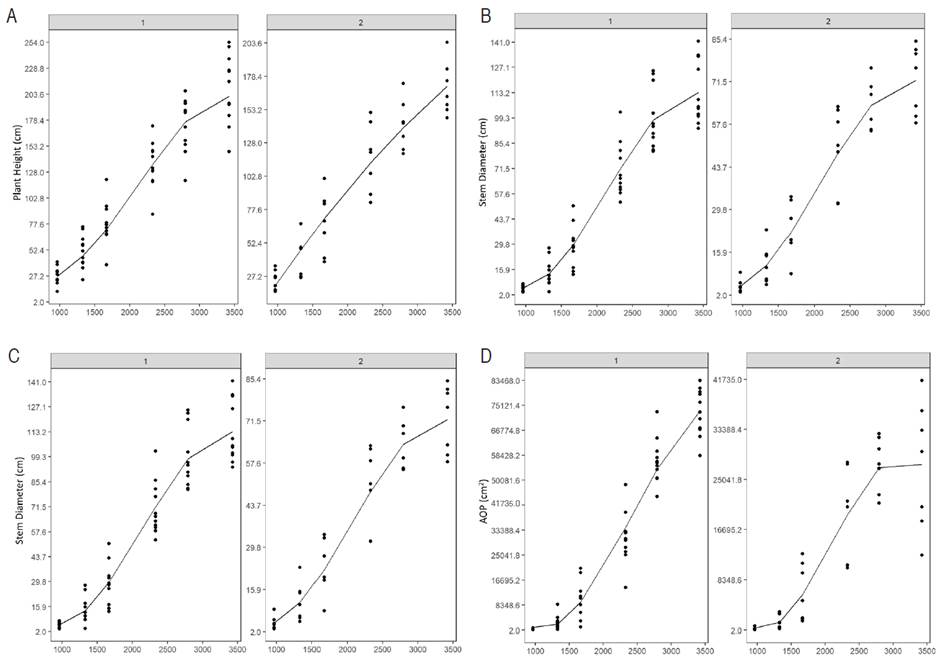
Figure 6 Representation of second and third-order models that explain growth for the variables plant height (A), stem diameter (B), number of leaves (C), and the area occupied by the plant (D) as a function of the accumulated degree days (GDD) in UN Cotové papaya variety plants.
Dos Santos et al. (2021) used mathematical models to estimate papaya fruits weight in the Alian cultivar. Salinas et al. (2019), using non-linear models in papaya, concluded that cultivars with smaller fruits need less time than cultivars with larger fruits to reach harvest. In this sense, selecting the appropriate polynomial degree to fit the data can be a problem since data can be underestimated by not ordering them correctly in the equation if a too-low polynomial order is used. Thus, data can be overestimated if a high-degree polynomial is used, especially at the ends of the curve. Hughes and Freeman (1967) suggest using third-degree polynomials to describe plant growth as a function of dry weight and leaf area.
For PH and SD, the sigmoid or non-linear models (Logistic model: L, Log-logistic model: LL, Log-Normal model: LN, Gompertz model: G, Weibull model: W) were not significant since the "Lack of Fit" values were greater than 0.05. For LN, it was observed that many of the non-linear models were statistically significant; however, the significant models did not achieve higher "loglik" values nor lower AICc values (differing by at least three units). For AOP, group D only had one model (W1.4) that was significant; however, it was impossible to obtain a lower AIC than the simple polynomial regression model; in group two, no model was statistically significant.
For the UN Cotové papaya variety, non-linear models are not the best option to describe the morphological variables. Simple polynomial regression models offer a good fit and simplicity in the equations. A possible explanation for why non-linear models do not fit well is that the GDD is used as an independent variable. This "standardized" or "normalized" variable can reduce non-performance, typical linear growth. A similar result was described by Salinas et al. (2019) when using the Richards and Weibull models, finding that the fit of data was not improved when using GDD instead of calendar days.
CONCLUSIONS
The UN Cotové papaya variety was composed of two morphotypes: group "A" presented the lowest plant height, stem diameter, number of leaves, and the area occupied by the plant. Group "D" had more developed plants. The best plants identified by morphological criteria in cluster "D" can be used as progenitors to cross with commercial materials for future breeding papaya programs. These plants confer desirable morphological characteristics such as low plant height and an adequate number of leaves because they provide better structural support. The high correlation between temperature and morphological variables indicated that quantifying environmental heat, expressed in GDD in each phenological stage, helps predict growth parameters with simple polynomial regression models.

