


 Inglés (pdf)
 Articulo en XML
 Referencias del artículo
 Enviar articulo por email
 Citado por SciELO
  Citado por Google
  Similares en
SciELO
Similares en
SciELO  Similares en Google
 Permalink
Grasses form the source of fodder for domesticated and undomesticated animals. Generally, livestock dependence on grasses as feed forms faces deficits of 11.2% green fodder and 23.4% dry crop residues (Royet al. 2019). The three sources of fodder supply for livestock feeds are crop residues, cultivated fodder, and fodder from common property resources like forests, permanent pastures, and grazing lands (Royet al. 2019). In Nigeria, grasslands form 37% (about 341,800.82 km2) of the total land area (Jimoh et al. 2020). The distribution of the grasses varied along different agroecological zones in the country. These variations are based on environmental factors, including the soil fertility status. The fertility of the soil is determined by many soil properties (including pedogenetic factors) their use, and management, which are interrelated (Ramírez-Iglesias et al. 2022). Hence, soil fertility describes the present state of the soil, which means that soil fertility is a combination of soil quality (mineral composition, soil texture, soil structure, soil organic matter (SOM) content, and phosphorus concentration) (Stewart et al. 2019). Also, the soil mineral composition affects the mineral levels found in pasture, and when not in the right proportion, causes an imbalance that will compromise animal productivity (Ramírez-Iglesias et al. 2022). Consequently, these factors and human activities (including fertilization) affect the abundance and quality of grasses (Ramírez-Iglesias et al. 2022). The availability of grasses in any location, without supplementation from other sources dictates or limits the sustainability of the available resources for which livestock are dependent (Lamidi and Ologbose 2014). Eventually, this may result in overgrazing when in short supply. Studies have shown that with adequate rainfall, grass production may substantially reduce when a considerable part of the leaf surface is frequently removed by close grazing without adequate time to regrow before it is harvested again (Kirkman et al. 2023). The extent of grass availability as fodder for livestock was reported to affect the abundance of livestock that depends on grasses (Kirkman et al. 2023). Hence, location and soil fertility are essential in the sustainability of wildlife that depends on grass for sustenance. This is particularly true for antelope (Kobus kob) commonly found in parks across the West, Central, and Eastern parts of Africa.
The Kob are herbivorous. They eat grass and reeds and are hunted for sport and food. However, a survey has shown that they are the third most preferred species of bush meat in Central Africa (Folorunsoet al. 2019). The abundance of livestock (including Kob) and the maintenance of their population are generally affected by food availability. However, there is a need to evaluate the soil properties that favor the growth and quality of grasses, thereby increasing or decreasing the abundance of Kob. Previous studies on the Kob population and density at the Kainji Lake National Park (KLNP) have not considered soil properties as an essential contributor to the dynamic of Kobs (Olajesuet al. 2019). Hence, the knowledge of the relationship between soil properties, grassland, and grazing activities at the KLNP is lacking. This understanding will enunciate knowledge-based decisions on relevant grassland management strategies required in the different locations at the KLNP. Consequently, the risks that lead to degradation conditions of the park ecosystem are minimized, thus sustaining, or improving the animal population, thereby maintaining the park functions. Therefore, the aim of this study was to evaluate soil properties as they affect the availability of grass and the abundance of Kob in KLNP.
MATERIALS AND METHODS
Description of the study area
The study site was at the Kainji Lake National Park, predominantly explored for park activities. The park is broadly classified into 10 transects based on their vegetation (Ikusemoran and Olokor 2014). The coordinates of the location span between 09°40'N - 10°30'N and 03°30'E - 5°50'E with approximately 5,340.82 sq. km land area. Five of the existing jeep tracks/roads transects and trails transects based on the KLNP master plan (that is, vegetation types and water availability) were randomly selected: Gilbert Child (GC), Shehu Shagari (SS), Mamudu Lapai (ML), Hussain Mashi (HM) and Mara Tsaude (MT) for this study. The transects of 5 km in length were established per site and censured for Kob species, morning (07.00 - 10.00 h) and evening (15.00 - 18.00 h).
Soil sampling
Soil samples were collected at 0-30 cm depth from each transect. Using a grid-line survey technique with 20 m × 20 m, 35 samples were collected for the laboratory analysis of soil physical and chemical parameters. For the terraced landscapes (foot slope, back slope, and shoulder slopes), samples were taken in the middle of the terraces, while for the non-terraced crest and toe slope landscapes, samples were collected at the maximum and minimum altitudes, respectively, for each transect.
Soil analysis
The soil samples were air dried, ground using a pestle and mortar, and sieved to pass through a 2 mm sieve. The soil chemical properties were determined at the Service Laboratory, Department of Soil Resources Management, University of Ibadan. Soil pH was determined following the FAO (2020) procedure. The organic carbon content was analyzed using the Walkley-Black method described by Poudel (2020). Soil organic matter was calculated by multiplying soil organic carbon by the van Bemmelen conversion factor of 1.724 (Heaton et al. 2016). The total nitrogen content was determined using the Kjeldahl method (Hicks et al. 2022). The available phosphorus was determined following the Olsen procedure (FAO 2021). The cation exchange capacity (CEC) and exchangeable bases were determined after extraction of the samples with 1 Nammonium acetate at pH=7 and the Ca2+ and Mg2+ were measured by atomic absorption. A flame spectrometer was used for Na and K from the aliquot following the procedures described by IITA (1982). The percent base saturation was calculated by dividing the sum of base cations by the cation exchange capacity and multiplying by 100 (Culman et al. 2019). The particle size distribution of the soil was determined by the Hydrometer method (Beretta et al. 2014).
Estimation of grass cover
The spatial distribution of grass cover (in %) during the study period was determined using a standard procedure through remote sensing by using aerial photographs and satellite images for each of the transects (Varga et al. 2014).
Cluster and number of Kob species
The cluster and number of Kob species were determined three times a week during the dry and rainy seasons by direct observation from a high hide (observatory tower), anthill, and tree formation. The observation of the Kob species was achieved using the King Census method of enumeration for the count with the aid of Zeiss Dialyt 10 by 40 binoculars, camera, and Global Positioning System (GPS) as described by Olajesu et al. (2019). The dry season observation spanned between the months of December - March, and the rain between June - September. The other months were the transition periods between seasons.
Statistical data analysis
Analysis of variance (ANOVA) was carried out to determine significant differences among the treatment means using SAS 9.0 software. Significant means were separated using Duncan's Multiple Range Test (DMRT) at P<0.05. Correlations coefficients were carried out for the relationship among the various parameters observed.
RESULTS AND DISCUSSION
Soil properties
The variations in soil physical and chemical properties of the locations under investigation are presented in Table 1. No significant difference was observed in the clay content among the soils from the different locations. However, soil from Mamodu Lapai (ML) had 16.06% higher clay content compared to Hussain Mashi (HM) and Mara Tsaude (MT), and 9.61% more clay content than Gilbert Child (GC) and Shehu Shagari (SS). The Silt content in the soils varied from 100.6 g kg-1 in SS and MT to 154.0 in soil from HM, with no significance observed among the locations. The sand content was highest (805.3 g kg-1) in soil from SS, and lowest (638.6 g kg-1) in MT, with no significant difference observed among locations. Soil texture influences the rate at which water is available to the plant (Huntley 2023). This, according to Huntley (2023), determines the pore space in the soil and consequently the movement of water and air through its porosity and permeability. The soil textural classification did not differ among the locations, except for SS with the highest in sand content. The soils from the regions signified similarity in textural classes. The similarities in the soil's textural classifications should not impose any appreciable dissimilarities on grass coverage since they belong to the same classification. However, the distinction in the proportions of sand, silt, and clay contents of the soil may create a slight variation in grass performance, which may likely affect the abundance of animals in the different locations. According to Weil and Brady (2017), soil with relatively higher clay content (such as observed in ML soil) is likely to have better water and nutrient holding capacity and resistance to pH change, but poorer in aeration. The soil is likely to be compacted, which is not adequately suitable for grass development. However, SS soil that was relatively higher in sand content is expected to show relatively opposite qualities to ML. Furthermore, soil with a relatively high percentage of silt and clay particles has a greater erodibility than sandy soil under the same conditions thus leading to poorer grass cover (Johannes et al. 2017).
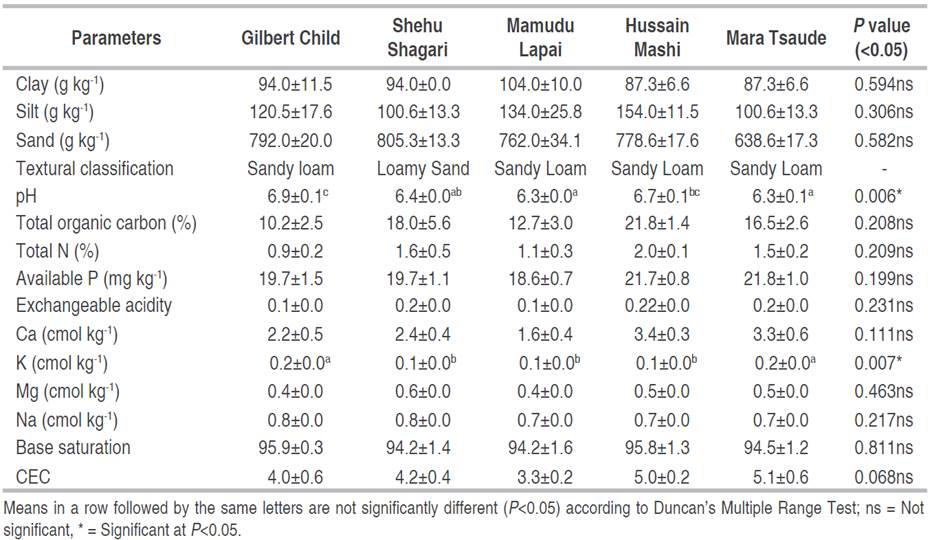
The soil's chemical properties varied among the locations (Table 1). The soil pH differed significantly among the study sites under investigation. It differs from 6.3 in ML and MT to 6.9 in GC. Soils from ML and MT had significantly lower soil pH compared to GC and HM. Also, SS soil had significantly higher soil pH compared to GC. Although, these pH values were within the range considered adequate for good grass growth, and nutrient availability (Yue et al. 2017). In their report, soil pH affects the availability and root uptake of nutrients to the crop. However, the ability of grass to thrive under different soil pH differs within crop variety (Yue et al. 2017). The total organic carbon (TOC) did not differ significantly. However, the highest TOC was observed in soils from HM with 53.21, 17.43, 41.74, and 24.31% more compared to GC, SS, ML, and MT, respectively. The TOC serves as a major component of understanding land degradation resulting from diminished soil organic carbon (SOC) stock, hence, loss of soil condition and function (Tessema et al. 2021). This implies that HM had the highest carbon stock followed by GC, while the least was observed in MT. An increase in TOC also implied higher microbial activities and improved soil structure, consequently enhancing soil health (Silva et al. 2014). However, the depletion of TOC in grassland has also been reported to be associated with intensive grazing activity (Ajorlo et al. 2011). Total N in the soils from the locations was not significantly different and had a similar trend as observed for the TOC. The low total N observed in GC could have been a result of overgrazing as reported by Ajorlo et al. (2011) that overgrazing results in the degradation of total soil N. Also, the soil available P values were similar in the different locations with no significant difference observed. However, HM and MT had higher available P compared to the other locations with the lowest observed in ML soil. The exchangeable acidity ranged from 0.1 (in GC and ML) to 0.22 (in HM soil), with no significant difference among the values. The Ca content was higher in the HM and MT soils and lowest in the ML soil. However, the values were not significantly different. Potassium content varied significantly among the soils from different locations. Soils from GC and MT had significantly higher K compared to the soils from other locations. Soil from SS contained the highest Mg content, while the lowest was observed in soils from GC and ML but were not significantly different. The nutrient compositions in soils from the various locations were similar in trend to the TOC. A similar finding was reported by Gerke (2022), that soil organic matter increases and improves soil nutrients. This was attributed to the significant role of organic matter in affecting nutrient availability. The soils from the locations did not differ significantly in Na content; however, GC and SS had higher Na than the other locations. High Na in soil was reported to result in a rapid loss of the native SOC because of increased solubility, decomposability, and accessibility, hence, increasing its accessibility and degradability for the microbial population (Singh 2016). However, grasses vary in adaptation to saline conditions (Yue et al. 2017). The high Na content in GC soil can also be responsible for the low TOC, while the Na in SS soil could indicate a possible susceptibility to rapid depletion of the soil TOC. Similarly, the base saturation ranges from 95.8 in HS to 94.2 in SS and ML but was not significantly different. The CEC of the soils did not vary significantly among the locations, but MT had 21.56, 17.64, 35.29, and 1.06% higher CEC than GC, SS, ML, and HM, respectively.
Grass cover and Kob abundance
Grasslands serve as energy capture, soil conservation, hiding cover, bedding cover, nesting cover, and improve habitat quality (Vandever and Allen 2015). They also provide the feed base for grazing and thus numerous high-quality foods. Percent grass coverage across the locations indicated that GC had significantly higher grass coverage compared to MT (Table 2). However, compared to GC, SS, ML, HM, and MT had 9.67, 25.92, 12.96, and 41.97% lower grass coverage, respectively. This trend was similar to what was observed for Na, with GC having higher Na and relatively lower TOC. Hence, the grasses in these locations were enhanced by alkaline conditions (Yue et al. 2017). Furthermore, the higher grass coverage observed could have resulted in overgrazing (by encouraging animal influx) which led to serious grassland degradation (Mligo 2015). They reported that overgrazing results in the depletion of TOC. This explained the differences found in TOC and Na in GC. Consequently, the possibility of a higher level of soil degradation is imperative as reflected in Table 1, whereby the location had lower nutrient status. Soil quality as an indicator of improved crop performance depends on the value of other soil properties considered as the most suitable conditions for a particular crop (Johannes et al. 2017). Also, the cluster size of Kob was significantly higher at GC compared to the cluster size of Kob observed at the other locations.
Table 2 Influence of location differences on grass cover, cluster size of Kob, and number of Kob sited in Kainji Lake National Park.

Grassland coverage indicates the carrying capacity of the location in supporting a larger number of animals. The result indicated that the GC with significantly higher grass coverage than the other locations, except HM also had a significantly higher cluster size of Kob. The finding was supported by Qiet al. (2017) report, which reported that sustainable livestock production must be accompanied by sufficient grassland size. The high cluster size in GC consolidated that there were higher activities of Kob in this location than in the others. This finding reaffirmed Olajesuet al. (2019) report that GC had a higher cluster size of Kob than the other locations under study. The basis for this assertion is that an increase in cluster size is likely to encourage high reproductive activity, concomitantly resulting in to increase in the Kob population (FAO 2018), due to the realization of an adequate food supply. However, SS had a significantly higher number of Kob sited compared to the sited Kob at GC, which also had significantly higher than the sited Kob at the other locations. This finding was substantiated by the high salt content observed in GC soil. According to Taboada et al. (2011), the level of salt accumulation at the surface of grazing land is an indication of the extent of animal activity. In their report, salt does not accumulate at the surface of the soil with limited grazing. Surface soil salt accumulation was attributed to the fact that evaporative losses were reduced with a thick layer of litter, thus decreasing the upward flux of water and salts. Hence, only minor salinity fluctuations were detected in the surface soil of pasture with limited grazing. Nevertheless, the fact that higher TOC was observed in SS soil despite similar Na content, indicated limited grazing, which could be a result of better grass quality or more grass coverage at GC.
Correlation coefficient soil physical properties, grass cover, and Kob abundance
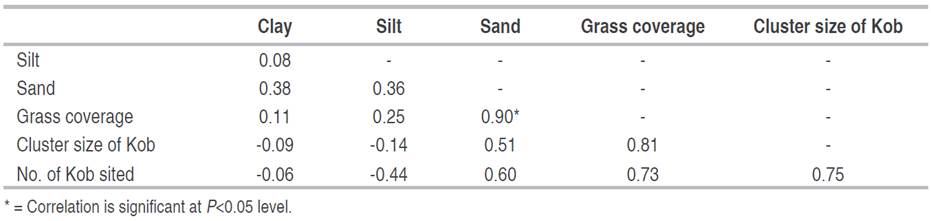
The Pearson correlation coefficient among the observed parameters indicated a non-significant correlation between clay content in the soil with silt, and sand but had a negative correlation coefficient with a cluster size of Kob and number of Kob sited (Table 3). Sand content in the sampled soil correlated significantly with the percentage of grass coverage. This finding supported Weil and Brady (2017) and Johanneset al. (2017) report that grasses are favored in well-drained soils with little silt and clay content. A high correlation coefficient also exists between grass coverage, cluster size of Kob, and number of Kob sited.
Table 3 Pearson correlation coefficient between the soil physical properties and grass cover, cluster, and number of Kob.
The soil pH had a significant correlation with percentage (%) base saturation (Table 4). A similar result was reported by Kabala and Łabaz (2018) that %BS increases with increasing soil pH. Also, a very high correlation coefficient existed between soil pH with grass cover score and cluster size of Kob. The relationship between TOC and total N was highly significant. Similarly, total soil OC had a high correlation coefficient with Ca, Mg, CEC, and available P. Total N correlated significantly with available P, Ca, Mg, and CEC, and had significant correlation exchange acidity. A highly significant correlation existed between available P with Ca and CEC observed. Also, Ca had a very high significant correlation with CEC. The soil Na had a highly significant correlation with the number of Kob sited, while the correlation with a cluster size of Kob and grass cover was high, but not significant. Corwin and Lesch (2005) reported that water uptake by the plants under saline conditions was limited, thus increasing the soil's osmotic potential, and causing nutritional imbalances, consequently reducing plants' growth and development. However, the high correlation observed between Na and grass cover, cluster size of Kob and number of Kob sited revealed that the grasses preferred saline conditions and could lead to the deterioration of the location vegetation. Similarly, sodium was reported to play an essential nutrient in animal feed (Johansson 2008). Salt helps in maintaining the right level of mineral balance of the animals and keeps the livestock healthy. There are; however, limits to its requirement to prevent food poisoning (EFSA 2019). Furthermore, studies have indicated that high salinity beyond the threshold level hinders root growth and causes drought symptoms (Vandever and Allen 2015). These salts could compete with the plant roots for available water. Consequently, under drought conditions, soil salts pull water out of plant roots through osmotic pressure, causing them to dehydrate or desiccate. High salt concentrations in the soil could burn young tender roots and prevent normal development. Similarly, intensive grazing causes an increase in topsoil temperatures, thus leading to higher soil water evaporation rates (Taboada et al. 2011). The various correlation was in support of Ajorloet al. (2011), indicating the effects of varying level of overgrazing activities of Kob across the location on the soil properties of the different locations under investigation.

CONCLUSIONS
The impact of different soil properties on grass coverage and animal abundance at the KLNP transect under investigation is confirmed by this study. Sand, silt, and clay contents in the locations were similar, but GC and SS soils were sandier than the other locations. Soil from GC with lower TOC and TN, but higher soil pH and Na contents had higher grass coverage and the cluster of Kob sizes. The order of grass coverage and cluster sizes of Kob were GC>SS>HM>ML>MT and GC>SS>HM>MT>ML, respectively. Sand and grass coverage were highly correlated, while soil Na content and the number of Kob sited had a high correlation. Based on the findings of this study, grass coverage, and Kob activity increased under sandy soil, high in soil pH and Na content but low in TOC and TN. However, to maintain good quality grass cover and animal stock at the KLNP, a proper grazing management strategy is critical to ensure continual maintenance of soil quality for sustainability.

