


 Inglés (pdf)
 Articulo en XML
 Referencias del artículo
 Enviar articulo por email
 Citado por SciELO
  Citado por Google
  Similares en
SciELO
Similares en
SciELO  Similares en Google
 Permalink
Durum wheat (Triticum durum Desf.), is one of the oldest cultivated cereal species in the world and one of the staple foods for a balanced diet because it is very rich in calories (149 Cal 100 g-1), starch, proteins, trace elements, and vitamin B1 (Amallah et al. 2016). So, it is recommended to consume Durum wheat widely because it constitutes a large part of humanity's diet at around 35% and provides 15% of its energy needs (IDRC 2010).
Algeria has recorded an average cereals production of around 5.23 million tons over the past three seasons and remains far from the demand estimated at 13 million tons (MADR 2021), durum wheat is the first economically major crop in Algeria which represents 46% of total cereals production grown on 1.6 million hectares (Harrag and Boulfred 2019). However, the durum wheat produced covers only 24 to 55% of the country's annual consumption based on the climate conditions, i.e., approximately 202 kg per capita per year (ITGC 2022), while the residual supplier is essentially provided by imports, to meet the needs croissants, which makes Algeria the world's leading importer of durum wheat (Bessaoud et al. 2019). This situation can be explained by: the main dependence of the Algerian diet on the consumption of durum wheat in its various forms (bread, pasta, couscous, freekeh, aish, baghrir, tamina, borj, rishta, etc.) and on the relatively low grain yields obtained in the country, which is closely linked to the effect of the climate (insufficient and erratic rainfall, low winter temperatures, spring frosts, late-season drought, and sirocco occurrence) (Haddad et al. 2021), with poor application of modern agricultural techniques (including the process and the harvest period) (Di Mola et al. 2021).
Harvesting durum wheat is considered one of the most important stages in the production system, due to its direct relationship with the grain yield and final quality of the grain. Each year, it is observed that there is a big gap between the yields obtained and those estimated because of the high losses registered before and during the harvest which are estimated at 20% for cereal crops (Gustavsson et al. 2011; Lipinski et al. 2013). Harvesting crops with appropriate grain moisture content often leads to a reduction in yield losses, but in the event of a delay in harvesting after physiological maturity, undesirable changes in the technological quality of durum wheat are likely (Forster et al. 2017). Any delay in harvesting will reduce the quality of the harvested grain and may influence the final storage result (Deliberali et al. 2010). Luhmann (2017) also demonstrated that when harvest was delayed beyond grain maturity, durum wheat test weight (Kg hL-1) began to decrease and there was no need to wait for the straws to completely dry out; this will cause a loss of weight, loss of dry matter. One of the options for improving grain quality is early harvesting. For this, the producer must take into account the need and availability of drying, the risk of spoilage, and the energy spent on drying (Embrapa 2011; Alt 2018). The early harvesting process after physiological ripening can be effective in obtaining a suitable industrial quality product, when there are high levels of starch, protein, and water, preventing the grain from being exposed longer to diseases such as mycotoxin-producing fungi (Paul and Lindsey 2014). It is necessary to evaluate whether the grain moisture content at harvest is compatible or not with their characteristics. This study aimed to evaluate the parameters of the technological quality of three durum wheat genotypes sowing under semi-arid conditions and to estimate the efficiency of using mathematical models based on the relation between the grain yield and grain moisture in the field to estimate the grain yield loss caused by the delayed harvest.
MATERIALS AND METHODS
The experiment was carried out at the Experimental Station for Field Crops ITGC in Setif -Algeria- (36°08'N, 5°20'E; 973 m) during the growing season (2020-2021). Three genotypes of durum wheat (Triticum durum Desf.) are: Boussellam (BOS), Oued El Bared (OB), and GTA dur (GTA) were shown on 20-12-2020 in randomized blocks design with three replications. The sowing density was adjusted to 300 seeds m-2. The one plot's dimensions were 2.4 m2, comprising 6 rows, each 2 m long and spaced 0.2 m apart. The soil has a loamy-clay texture with an average organic matter content of 2.8%. The bulk density is 1.35 g cm-3, the field capacity is 25%, and the wilting point is at 12%. The experimental plots were fertilized with 100 kg ha-1 of mono-ammonium phosphate (12% N + 52% P2O5) before sowing and 80 kg ha-1 Urea (46% N) at the tillering stage. The monthly precipitation recorded during the 2020-2021 crop season, from September 1st to June 30th, reached 320.24 mm (Tutiempo Network 2021).
Agronomic and technological measures
Measurements were taken from the onset of physiological grain maturation until the day of mechanical harvest in the experiment. Samples were collected five times during 13-day intervals after final maturation to evaluate the effect of grain moisture degradation on yield components and technological parameters of durum wheat grain:
Agronomic parameters
Grain yield (GY, t ha-1) was estimated at harvest, the grain yield samples were harvested manually in an area of 1 m2 for each repetition and then converted into ton ha-1. Measurements of grain moisture content in the field (GMF, %) were conducted using a portable moisture meter "Riceter f 508" type which directly gives the grain moisture in the sample as a percentage.
Technological parameters
The quality analyses were carried out on the grains after the harvest, grain protein content (P, %), the content of yellow berry (non-vitreous grains) (YB, %), the test weight (TW, Kg hL-1), and the content of grain moisture in the laboratory (MlAB, %), using an "Inframatic 9500 Results Plus" type measuring device, which ensures precise measurement of the samples.
Prediction model for estimating grain yield losses based on grain moisture values
To assess grain yield losses due to grain moisture degradation at harvest, a linear regression model was utilized and to evaluate the performance of the model, the following notations were adopted:
Average absolute error (AAE)
The average absolute error (AAE) measures the weighted average magnitude of the absolute errors and can be calculated using the following equation (1) (Willmott and Matsuura 2005).

Root mean square error (RMSE)
Root means square error (RMSE) gives the weighted variations in errors (residual) between the simulated and observed values, if the value of AAE and RMSE is close to 0, then the model is perfect. The RMSE was calculated following equation (2) (Willmott and Matsuura 2005).

Index of agreement (D)
The index of agreement can detect additive and proportional differences in the observed and simulated means, the agreement value of 1 indicates a perfect match, and 0 indicates no agreement at all. It was calculated using the equation (3) by Willmott et al. (1985).

Coefficient of efficiency (E)
The coefficient of efficiency (E) expresses how much the overall deviation between observed and simulated values departs from the overall deviation between observed values (Oi) and their mean value (MO). The E is unitless and can take values ranging from -∞ to +1, with better model simulation efficiency when the values are closer to +1. It is calculated using the equation (4) (Yan et al. 2015).

Correlation coefficient (r)
The correlation coefficient is an indicator of the degree of proximity between the observed values and the estimated values of the model. The observed and simulated values are found to be better correlated when the correlation coefficient approaches one. If the observed and predicted values are completely independent, i.e., they are uncorrelated, then r will equal zero. The correlation coefficient was calculated by the following equation (5).
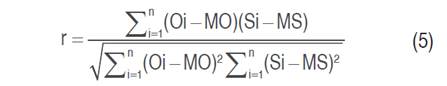
Where:
Si = simulated value
Oi = observed value
n = number of observations
MS = mean of simulated value
MO = mean of observed value
A statistical analysis was applied to determine the significant differences between genotypes "one-way analysis of variance (ANOVA)". Fisher's LSD test was used for comparisons of means with CoStat software version 6.4.
RESULTS AND DISCUSSION
Agronomical parameters
The analysis of variance proved that the effects of genotypes are significant for all parameters. The genotype Boussellam registered a grain yield equal to 2,063 t ha-1, followed by Oued El Bared at 2,006 t ha-1 which is equal to the general average (2,006 t ha-1), and GTA dur recorded the minimum value of 1,950 t ha-1. The grain yield of the genotype Boussellam exceeded that of the two genotypes, Oued El Bared and GTA dur with 2.76 and 5.48%, respectively (Table 1).
Table 1 Analysis of the variance of the parameters: Grain moisture, grain yield, and quality parameters.
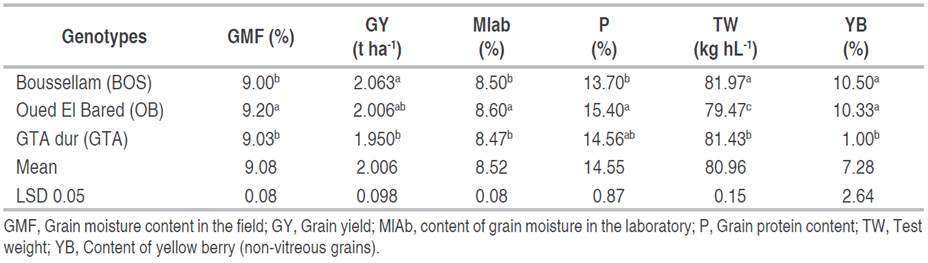
A very significant inter-varietal difference (P<0.01) for grain moisture content in the field, where the BOS genotype registered the minimum value (9%) and the maximum value was recorded by Oued El Bared (9.2%). Low final grain yield values are accompanied by lower relative values in the grain moisture content in the field (Figure 1). The ideal moisture for harvesting durum wheat is 15 to 18%, then the grain must be dried and stored with 13% moisture (Alt et al. 2019). Grain moisture content affects the time of harvest and the drying process (Maiorano et al. 2014). When farmers have a hot air dryer, the harvesting process can be started at 18% moisture content (Metz 2006). In Algeria, due to the lack of artificial drying, durum wheat harvesting generally begins when the moisture content of the grains is around 13% and continues down to 9%, coinciding with high temperatures in the air and the lack of a combined harvester.
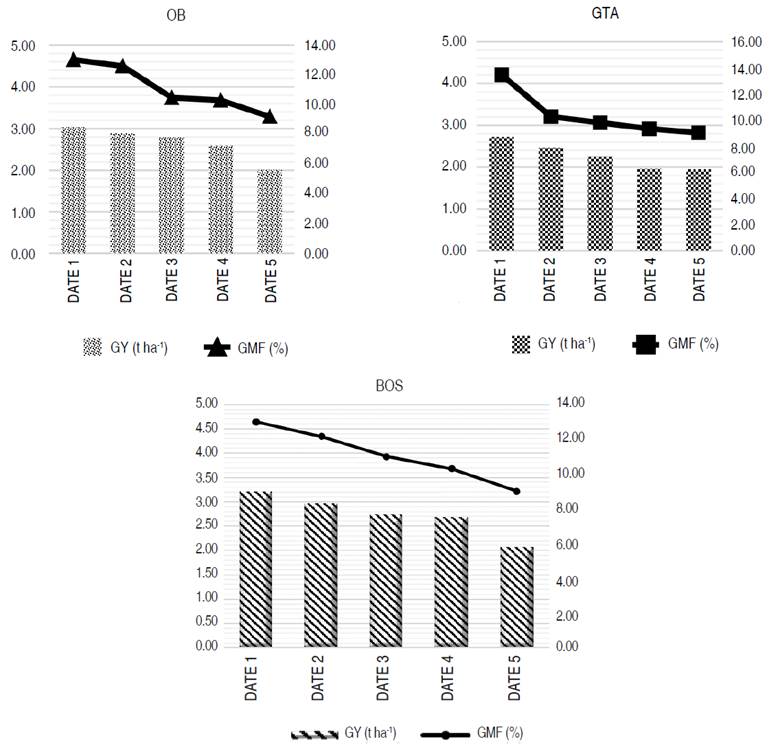
Figure 1 Grain yield loss (GY) as a function of grain moisture degradation in the field (GMF). BOS, OB, and GTA are abbreviations of Boussellam, Oued El Bared, and GTA dur, respectively.
Five samples were collected after the physiological maturity of the grains, expressed in five dates during a time interval of 13 days, commencing with the first sample on "Date 1" and concluding on "Date 5" to quantify the grain yield (t ha-1) and their respective grain moisture content (%). A consistent decline in grain moisture content (GMF) was observed from Date 1 to Date 5, coinciding with a decrease in grain yield (GY). The highest GMF recorded were 13.00, 13.03, and 13.47%, corresponding to maximum grain yields of 3,201, 3,032, and 2,726 t ha-1 for the BOS, OB, and GTA genotypes, respectively. In contrast, the lowest GMF were recorded on Date 5, with values of 9.00, 9.20, and 9.03% for the BOS, OB, and GTA genotypes, respectively, and these conditions resulted in the lowest grain yields of 2,063, 2,006, and 1,956 t ha-1 for each respective genotype (Figure 1).
According to Parvej et al. (2020), grain yield losses can fluctuate based on multiple factors, such as the geographical region, prevailing weather conditions, the specific type of wheat under cultivation, and the length of the harvest delay. The results of this study indicated after 13 days of physiological ripening, grain moisture losses at Boussellam reached 30.77%, this corresponds to a loss of grain yield of 35.55% equivalent to 1,138 t ha-1, GTA dur lost 32.96% of grain moisture which corresponds to 28.47% (0.776 t ha-1) loss of grain yield and at Oued El Bared the grain moisture losses reach 29.39% and it has lost 33.84% of its grain yield i.e., 1,026 t ha-1 for 13 days (Figure 1). Indeed, after physiological maturation, each day of delay leads to a loss of 2.73% (0.088 t ha-1), 2.60% (0.079 t ha-1), and 2.19% (0.060 t ha-1) of the grain yield for Boussellam, Oued El Bared and GTA dur, respectively.
Technological parameters
The grain protein content shows significant differences (P<0.05) between the genotypes tested, it varied between 13.7 and 15.4% with an average of 14.55%. The grain protein content was significantly higher for the Oued El Bared genotype (15.4%) followed by no significant differences in the GTA dur genotype (14.56%), while grain protein content was significantly lower for Boussellam genotype (13.7%) (Table 1).
This inter-varietal variability highlights a genetic divergence between the varieties studied. The genetic diversity of endosperm reserve protein richness has been widely analyzed by several authors, according to Serra et al. (2021) attributed protein synthesis to the expression of several genes so that each genotype has a wide spectrum of variants. Allelic is responsible for its qualitative profile.
As well as the analysis of variance indicates that there is a very highly significant difference (P<00.1) between the genotypes for the test weight (TW), this explains why the test weight is a parameter under genotypic control, but it is also affected by climatic conditions at the time of grain filling. It is noticed that the test weight was significantly the highest for Boussellam genotype (81.97 kg hL-1) while it was significantly the lowest for OB and GTA genotypes (79.47, 81.43 kg hL-1) with significant differences respectively (Table 1). In most countries, durum wheat is marketed based on its physical properties, established by grading systems such as test weight (Forster 2016). In addition, the dimensions of the grain of wheat, as well as the size of the caryopsis, constitute very important factors that influence the semolina yield. At the regulatory scale, the test weight of the three genotypes meets the first-degree requirements of the American and Canadian grading systems (GIPSA 2020; CGC 2021).
For the content of yellow berry (non-vitreous grains), the difference between the varieties was very highly significant (P<0.001). The mean value of yellow berry was significantly higher for (BOS) and (OB) genotypes without significant differences between them (10.50, 10.33%, respectively) so they presented more non-vitreous grains, while it was significantly lower for (GTA) genotype (1.00%) (Table 1).
That means (GTA) genotypes developed a tolerance to yellow berry and characterized by high proportions of vitreous grains and minimal starchy kernels rates (1%). However, it was acceptable for Tilley et al. (2012) who defined the vitreousness of durum wheat as high (above 75%), medium (between 60 and 75%) and low (below at 60%). Annicchiarico et al. (2006), claim that durum wheat is faced with a lack of technological and commercial quality stability, due in particular to variations in important criteria such as non-vitreous kernels (penalizing semolina value) and black point.
Indeed, in durum wheat, the relationship between content of yellow berry and milling performance is complex, but it can be said that in general, starchy grains give less coarse semolina and more flour, which reduces their ability to milling (Heinze et al. 2016).
Correlations between the different parameters studied and estimation of inter-varietal genetic diversity
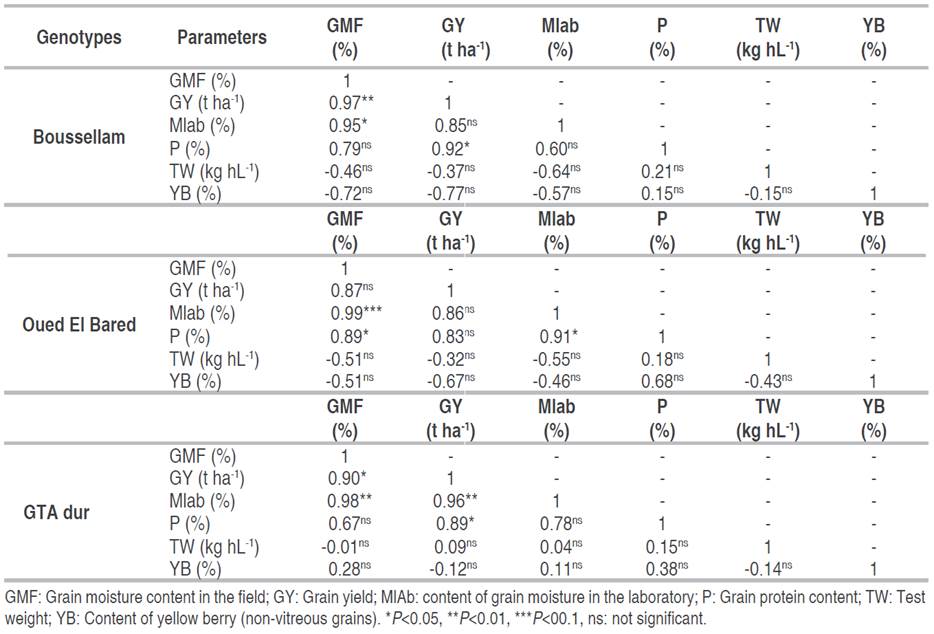
The results indicated that there are significant and positive correlations between grain moisture content in the field and grain yield in GTA dur r=0.90* and very significant and positive in Boussellam r=0.97** (Table 2); these results suggest that a decrease of grain moisture is generally linked to a decrease in grain yield, and this relationship is particularly strong in the Boussellam genotype.
Table 2 Correlation coefficient between grain moisture, grain yield, and quality parameters for the three genotypes studied.
Parvej et al. (2020) indicated that delaying the harvest of wheat beyond its physiological grain maturity can indeed lead to grain yield losses, and it emphasizes the importance of timely harvesting to maximize both yield and quality. According to Scariot et al. (2018), managing grain moisture content through effective drying and storage practices is also essential in reducing both pre-harvest and post-harvest losses.
At Boussellam there was a positive and significant correlation between grain moisture estimated by the mobile moisture meter and that estimated in the laboratory r=0.95*. GTA dur and Oued El Bared showed very significant and very highly significant correlations with r=0.98** and r=0.99***, respectively. These results proved the effectiveness of the mobile moisture meter in estimating changes in field moisture (Table 2).
Positive and significant correlations are observed between total protein content and grain yield in Boussellam and GTA dur, r=0.92*, and r=0.89*, respectively, while Oued El Bared marked a positive correlation and not significant (r=0.83). This positive relationship between grain protein content and grain yield suggests that plant nutrition and growth conditions were suitable for grain yield and grain protein accumulation. In addition, the grain could act as a sink, promoting the translocation of proteins to the grain. These results help contribute to the development of wheat varieties with improved yield potential and desirable protein content to meet the needs of different end uses, such as bread making or pasta production.
Pandey (2014) showed a strong correlation between the protein and carbohydrate content of various cereals and legumes and the moisture content of the grain. Starch is considered a dominant constituent of cereal grains; protein is the second component that plays a similar role in terms of water absorption and water binding. The Oued El Bared genotype highlighted this correlation, in which the protein content and the grain moisture content in the field and content of grain moisture in the laboratory are positively and significantly correlated r=0.89* and r=0.91*, respectively, according to Deliberali et al. (2010), any delay in harvesting will reduce the quality of harvested grain and may affect the final storage outcome. No correlation was observed for Boussellam and GTA dur genotypes concerning grain moisture content and protein content. Dorrian et al. (2023) found that the variation in protein content based on the harvest date was no greater than 0.20%. They also stated that, from a physiological perspective, moisture content would not be expected to have a significant effect on grain protein because protein accumulation is anticipated to be at its highest and stable at maturity.
Estimating grain yield losses based on grain moisture
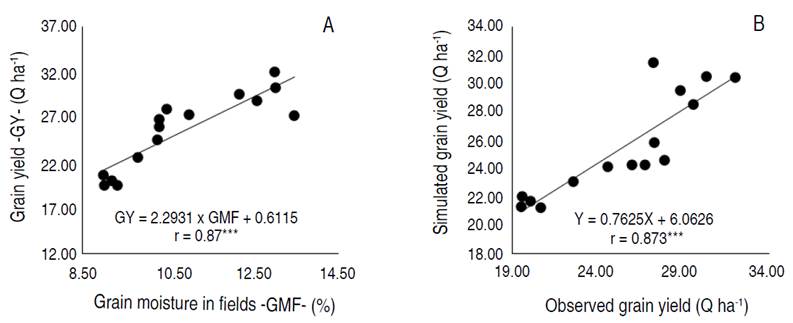
The relationship between grain moisture in the field (GMF) and grain yield (GY) is illustrated in Figure 2A. Based on the mean values of the treatments, a model was generated based on grain moisture in the field to estimate and predict the grain yield loss. The results indicated a very highly significant correlation with r=0.87*** (P<0.001). Regression models that empirically fit the linear grain moisture-grain yield relation indicate that 76% of the variation in grain yield is due to the effect of grain moisture change. Linear regression gives an equation (6), that is, after the physiological maturity of the grain, 1% loss of grain moisture, there is a loss of about 0.290 t ha-1 of grain yield.

The evaluation of model performance
To check the goodness of yield prediction by the linear model proposed, average absolute error (AAE), root mean square error (RMSE), index of agreement (D), coefficient of efficiency (E), correlation coefficient (r), and the T-test (student test) were calculated to evaluate the performance of prediction models in this study.
Observed and simulated grain yield correlated very well giving an r=0.87 a slope of 0.76 and D of 0.93 (Table 3, Figure 2B) indicating that the model explained 76% of the relationship between observed and modeled durum wheat grain yield with an agreement (D) of 93%. The good agreement between measured and simulated is also reflected in the statistical analysis, with low average absolute error and root mean square error. The grain yield was also well simulated with the observed yield giving a coefficient of efficiency (E) of 0.76, i.e., with a simulation capacity of 76%.
Table 3 Derived statistical indices to assess the performance of the regression model in predicting grain yield from grain moisture in the field.
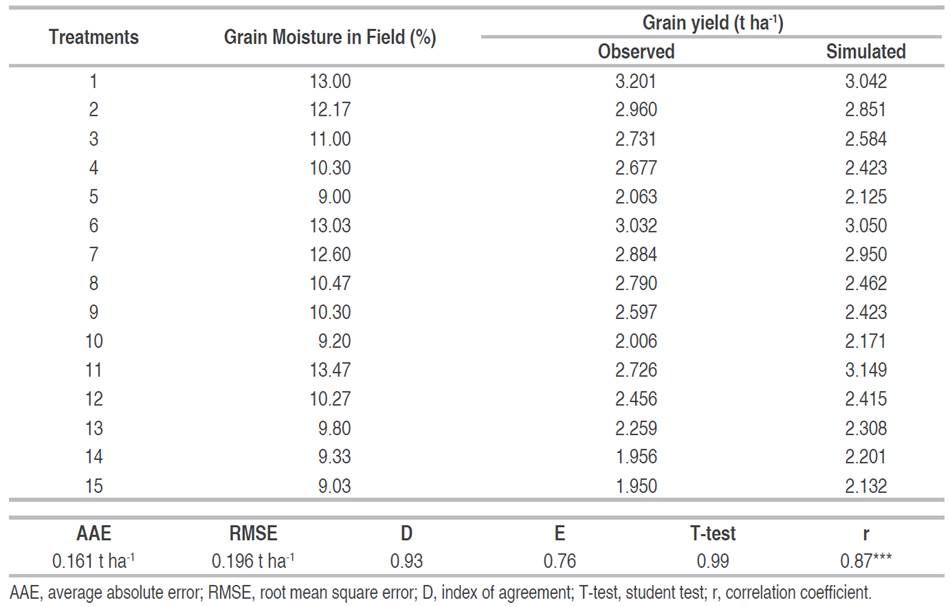
The Studied T-test showed that the simulated grain yield was not significantly different (P>0.05) from the observed grain yield, with RMSE and AAE of 0.196 and 0.161 t ha-1, respectively (Table 3). Leng and Hall (2020) used a regression model to simulate changes in historical maize yield from observations, with r and RMSE of 0.51* and 7.52, respectively. The RMSE and AAE values when expressed as a percentage of the average observed grain yield were 7.68 and 6.31%, respectively. Overall, the difference between the simulated and observed grain yield was <0.0001%, the performance of the model concerning RMSE was estimated at 92.32%, and the accuracy to AAE was 93.69%, which suggests that the model has high precision in predicting grain yield under semi-arid conditions, surpassing the results of Mkhabela et al. (2011), who developed a regression model as a predictor and reported that the model explained 47 to 80% of grain yield variability in prairie spring wheat, with RMSE ranging from 6 to 34% of average yield.
CONCLUSIONS
The study provides valuable insights into estimating grain yield losses in durum wheat under semi-arid conditions through a mathematical model based on grain moisture. Genotype variations were significant in key parameters such as protein content, test weight, and content of yellow berry when the BOS genotype exhibited the highest proportions of GY, TW, and YB (2,063 t ha-1, 81.97 kg hL-1, and 10.50%, respectively) with the lowest protein content (13.70%), OB. On the other hand, showed values significantly close to BOS in terms of GY and YB but had higher protein content (15.40%) and lower TW (79.47 kg hL-1), GTA dur demonstrated a tolerance to yellow berry (1.00%), featuring a higher proportion of vitreous grains. This highlighted the importance of genotype selection in crop management. The study establishes a strong positive correlation between decreasing grain moisture in the field and subsequent grain yield loss. This relationship can be predicted accurately using a robust mathematical model. Statistical analysis confirms the model's effectiveness with low average absolute error (0.161 t ha-1) and root mean square error (0.196 t ha-1), resulting in a 76% simulation capacity as indicated by the coefficient of efficiency. Furthermore, the research emphasizes the critical role of timely harvesting after grain physiological maturity to minimize yield loss. In summary, this study equips durum wheat farmers in semi-arid regions with valuable tools and insights for optimizing grain yield and quality through genotype selection and harvest timing. The developed model's high precision and accuracy make it a valuable resource for durum wheat cultivation in challenging semi-arid environments.

