


 English (pdf)
 Article in xml format
 Article references
 Send this article by e-mail
 Cited by SciELO
  Cited by Google
  Similars in
SciELO
Similars in
SciELO  Similars in Google
 Permalink
INTRODUCTION
Camera traps, and the images they generate are becoming an essential tool for field biologist studies and for monitoring terrestrial animals (Fegraus et al. 2011). These tools were used to study birds nest predation (Holloran and Anderson 2003), feeding ecology, nesting behavior, with additional applications such as activity patterns, presence-absence monitoring and estimating population parameters (Cutler and Swann 1999). Track surveys are efficient and are usually low-cost but rely on suitable field conditions and trained personnel. In comparison, camera-trapping is more costly at the beginning but does not rely so much on the environmental conditions, intensive fieldwork, or highly experienced field staff (Silveira et al. 2003). Camera traps are also very convenient for detecting cryptic and rare species, which are difficult to capture by more traditional techniques. Also, this method is particularly important to study endangered species, when capture or collection is restricted or prohibited (Botello et al. 2007). Because of the extensive data collection, camera-trapping studies usually record abundant information about non-targeted species, but, that data has been marginalized and rarely published. However, those extra stored images may provide critical information for certain types of research, for example: (1) measuring biodiversity, (2) finding new evidence about the efficacy of management actions taken in different protected areas, and (3) studying species thought to be locally extinct (Can and Togan 2009). Camera-trapping data usefulness can be determined from indirect methods (Rowcliffe et al. 2008), for example, underlying detection probabilities from camera-trapping data can be estimated by combining occupancy models (Mackenzie et al. 2002) and population size measurements (Royle and Nichols 2003, Stanley and Royle 2005).
Systematization of the images captured by camera traps allows them to be easily included in scientific collections, increasing the information available from any sites being monitored by this method. This can contribute significantly to global biodiversity assessments and help with key management decisions to be made (Botello et al. 2007). However, the rapid increase in camera traps usage has not been accompanied by appropriate software solutions to manage and analyze the images captured (Harris et al. 2010, Zaragozí et al. 2015).
Not many studies have analyzed the effects of land use changes on the past, present, and/or future distribution of mammals in Europe (Acevedo et al. 2011). Predictive habitat distribution models are a relevant tool to assess the impact of global change on species distributions (Thuiller et al. 2008). Although many studies have explored land use change dynamics (Agarwal et al. 2002), very few have used habitat distribution models to address the impact of land use changes on animal populations (Lütolf et al. 2009). A variety of statistical models can be used to assess the impact of land use changes on ecosystems, and to predict the potential ecological consequences of future land-use changes (Millington et al. 2007). For example, hunting datasets have been analyzed using GIS in order to determine the primary relationships between landscape structure and game species populations in Mediterranean environments (Belda et al. 2011).
In this work, we quantified the relationships between a set of landscape metrics -measured in different resolution grids - to test whether spatial heterogeneity plays a significant role in determining the distribution of ungulates -in a Mediterranean landscape. We explained much of the variation in distribution with metrics, specifically related to habitat heterogeneity. That outcome highlighted the potential importance of spatial heterogeneity in determining the distribution of large herbivores. We place our results in the context of forestry conservation practices and discuss potential ways to integrate ungulate management and forestry practices better. We used discriminant and logistic modeling to determine significant landscape properties factors with both the presence and absence of ungulates species. We also ran the corresponding validation tests of each calculated statistical model in order to make predictions about wildlife behavior following landscape properties. To meet the aim of our work, we used a case study that was conducted in a specific area to demonstrate the versatility and robustness of the proposed statistical models.
MATERIAL AND METHODS
Location
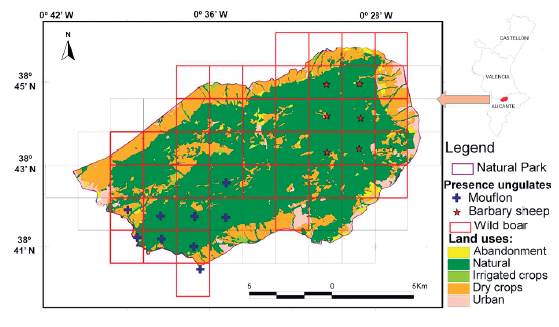
The Sierra de Mariola Natural Park, located in the southeast of the Iberian Peninsula, covers 17 500 ha of seven nearby municipalities (Fig. 1). The park is characterized by a very mountainous relief, crossed by river valleys, and exhibiting a typical Mediterranean climate. Natural land cover predominates (67 %), followed by some areas with rain-fed crops (24 %), residential areas (5 %), abandoned crops (3 %), and irrigated crops (1 %) (Belda et al. 2016). Finally, this natural park also holds great biodiversity in plants and animals, highlighting a large variety of carnivorous mammals, ungulates, and game species (Belda et al. 2012). In order to better understand the sustainability of this semi-natural environment, we have been observing and analyzing its composition for almost one decade.
Camera models
The methodology used to determine the presence/absence and relative abundance of terrestrial vertebrate fauna, related mainly to ungulates, is based on the camera-trapping technique. We used 25 cameras with motion sensors -Moultrie Game Spy I-60 Infrared Flash Game Camera. This high-tech camera-trap uses infrared technology to pick up on any game that moves through its field of view. Not only does it capture wildlife with precise results in the daytime or at night, but it has a vast number of features to provide a complete information source: a built-in 6.0 megapixel picture and video viewer, with displays barometric pressure, temperature, time, and moon phase readings. The 1-60 also has 32 MB internal memory, 50' flash, and 150 days of battery life. It can support external memory cards and add-on power packs to expand snapshot capabilities and battery life. Data is stored on a two GB SD memory card. Units are equipped with an external power system, which consists of a 12V battery and power cables. We selected this model for its usability, resolution, and adaptability with other Moultrie add-on accessories.
Sampling process
In order to place the camera-traps, we divided the study area into a grid of 63 squares of 2x2 km. The sampling period was from August 2008 to September 2009. During that period we installed two camera traps in each grid square, keeping a minimum separation distance of 200 m between them and 30-50 cm above the ground. As an attractant, we used a mixture of corn, almonds, wheat, and salt, placed at 4-5 meters in front of the camera traps. Devices were scheduled to take three consecutive shots before a five minutes rest period. In this work, we define valid pictures as those were species identification, and counting can be performed. Any blurred images, e.g. captured in movement, were considered invalid. All the captured images were copied to a personal computer and analyzed with our software - namely CameraTrapManager. This software facilitates the creation of a GIS database containing the metadata extracted from the captured images and an expert classification; then it can be used to prepare reports and maps (Zaragozi et al. 2015).
Landscape analysis
The landscape was characterized as a land-use GIS layer, photo-interpreted and manually digitized from publicly available ortophotographs at a 1:5000 scale (ICV c2005). We also identified and digitized all hunting areas. The resulting land-use layer comprised 1213 polygons that were categorized into three classes of natural uses: pine forest, shrubland, and riparian, three classes of agricultural uses: rainfed, irrigated, or abandoned crops, and a unique class for representing urban areas (Fig. 1). Finally, we rasterized the resulting vector layer for facilitating further analyses (Zaragozi et al. 2015). These processes were performed using the ArcGIS 9.0 suite.
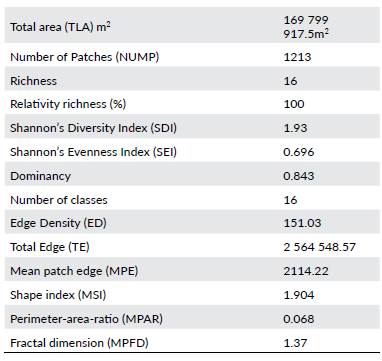
In accordance with similar studies (Yamaura et al. 2005, Belda et al. 2011), we used two different programs for calculating the landscape metrics from the previously created GIS layers, V-late 1.1® - an ArcGIS extension- and FRAG-STATS® (Mcgarigal et al. c2002), to calculate landscape metrics. We calculated 16 landscape metrics including: Total Landscape Area (TLA), Number of Patches (NUMP), Mean Patch Size (MPS_ha), Median Patch Size (MEDPS), Patch Size Coefficient of Variance (PSCOV), patch size standard deviation (PSSD), Total edge (TE), Edge density (ED), Patch Edge (MPE), Shape Index (MSI), Area-weighted Mean Shape Index (AWMSI), Perimeter-Area-Ratio (MPAR), Mean Patch Fractal Dimension (MPFD), Area Weighted Mean Patch Fractal Dimension (AWMPFD), Shannon's Diversity Index (SDI), and Shannon's Evenness Index (SEI).
Statistical modeling
First, we studied the correlation between the initial variables using the Pearson correlation test. Since they are highly correlated, we performed a factorial analysis (PCA). In this way, we obtained new uncorrelated variables and the relationships between the calculated metrics which included all the information. Using the PCA, we confirmed independence between the newly obtained variables (Korre 1999, Abdul-Wahab et al. 2005). Then we performed discriminant and logistical analyses to obtain predicting models for the ungulate wildlife in a general analysis, and particularly for the mouflon (Ovis orientalis musimon Pallas, 1762), wild boar (Sus scrofa, Linnaeus, 1758) and Barbary sheep (Ammotragus lervia Pallas, 1777) species. The normality of the data within the groups was tested through the Kolmogorov-Smirnov test.
RESULTS
Finally, 72 347 images were collected (more than 93 GB), of which 29 941 showed some wildlife contacts; 4981 of these were ungulates - spotted in 45 of the 20 grid squares (71.43 %). The wild boar was present in 69.84 % of the grid squares (4408 images), mouflon in 14.29 % (546 images), and Barbary sheep in 11.11 % (27 images).
The digitized land uses were used to calculate the landscape indices shown in Table 1. Moreover, we used 16 landscape indices to perform a factorial analysis, necessary to obtain the determinant value of the correlated matrix and ensure the existence of correlations among the selected variables. Total Landscape Area (TLA) and Number of Patches (NUMP) metrics were not significant, so they were excluded from the model.
We obtained a matrix determinant value of 1.96 10-8, which indicates a strong correlation among the landscape indices. This result meant that it was possible to apply the PCA analysis on these indices (Cuevas et al. 2013). After the viability test, we obtained the best result when we used Standardization rotation Oblimin with the Kaiser Method.
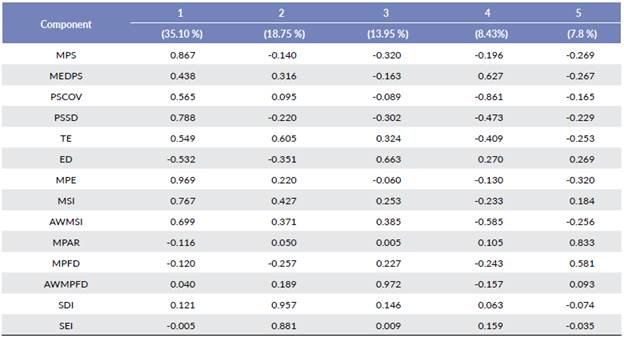
We obtained five components capable of explaining 84.08 % of the typical variability of the variables. The relevance and structure of the variables are listed in Table 2.
Table 2 Component Matrix of the Landscape Indices. Extraction Method: Principal Component Analysis. Rotation Method: Oblimin with Kaise Normalization.
The interpretation of the obtained components was:
- Component 1 (C1): more influenced by indices Mean Patch Size (MPS), PSSD, MPE, MSI, and AWMSI, defined as Area size.
- Component 2 (C2): more influenced by indices TE, SDI, and SEI, defined as Diversity.
- Component 3 (C3): more influenced by indices ED and AWMPFD, defined as Edge density.
- Component 4 (C4): more influenced by indices MEDPS and PSCOV, defined as Size variance.
- Component 5 (C5): more influenced by indices MPAR and MPFD, defined as Fractal dimension.
We used the components of the PCA to run the discriminant and logistical analyses. First, we applied discriminant modeling, which included the five components above, as well as the presence and absence data of each species. Table 3 shows the four models obtained by the discriminant analysis. In these models, we included only the significant components, although other components explain more variation compared to the previous ones. Their sign revealed their positive or negative influence on the presence of species, and the successes and failures percentages in the model fit.
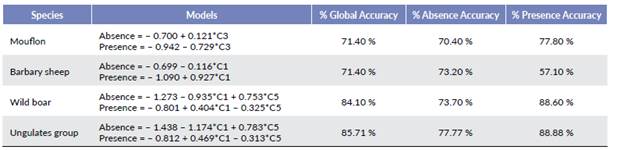
To generally predict ungulate behavior, the components used were C1 and C5, which corresponded to Area size (MPS) and Fractal dimension (MPFD), respectively. The fractal dimension influenced the presence of ungulates was negative, while Area size was positive, which means that the whole group of ungulates preferred large and homogeneous areas. The model was very useful because it correctly discriminated 85.71 % of the measured data.
With mouflon, the only significant component was C3 more influenced by Edge density- with a negative influence on the presence of moulon. The model was able to discriminate 71.40 % of the data. Size component (C1) had a positive influence on the presence of Barbary sheep, and the model discriminated 71.40 % of the studied data. Finally, wild boar behavior was explained with the same components as ungulates in general (C1 and C5) discriminating 84.10 % of the data.
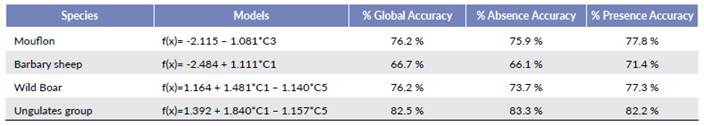
We employed logistical regression to model the same data with the five components calculated by PCA (Table 4). We use the same components employed in the discriminant models, which reinforced the obtained results. These components influenced ungulates and were the same as in the discriminant models in the three analyzed individual species. The only difference found was the adjustment percentage in each model. In this case, the logistical function adjustment for ungulates species was 82.5 %, 76.2 % for moulon and wild boar, and the lowest of all the calculated models was 66.7 % for Barbary sheep.
DISCUSSION
The application of landscape metrics provided excellent results when included in monitoring wildlife studies (Smith et al. 2004). Therefore, ecologists have often assumed the most important ecological processes to affect wildlife populations and communities operate on local spatial scales. Vertebrate species richness and abundance are often considered to depend on variation in local resource availability, vegetation composition and structure, and on habitat patch sizes (Mcgarigal et al. c2002).
In this work, we confirm that the advantages of using camera-trapping include accurate species identification, little environmental disturbance, similar efficiency to detect nocturnal and diurnal species, as well as the possibility of studying activity patterns, easy handling by untrained personnel, the extent of the area that can be simultaneously sampled, and the possibility of being used in further population studies. This seems proved, despite that in previous studies; the track census was the most effective method for detecting richness, followed by camera-trapping and direct fauna surveys (Silveira et al. 2003). There is no doubt that camera traps have opened up new ways to study elusive species, but some substantial methodological issues are still to be overcome, and far too often, camera-trapping studies gave a little forethought to the study design and subsequent data analyses. This problem may be compounded as the methodology becomes outpaced by technology (Kelly 2008).
In the Sierra de Mariola Natural Park, ungulates generally preferred large homogeneous areas with few vegetation types. Similarly, as in nearby areas, the ungulates correlated positively with homogeneous forest areas. More concretely, Barbary sheep density was positively related to dense pine forests, clear shrublands, old abandoned fields, and large homogeneous areas (Belda et al. 2011). These preferences seem to be very common in Spain, as in previous studies the aoudad preferred land forest, bare rock, shrublands, and natural grasslands. However, when facing human disturbance, it is associated with less mountainous areas, forests, and rain-fed crop areas (Cassinello et al. 2006). Similarly, wild boar selects dense pine forests with oak trees, seeking for shelter and refuge. These preferences have been favored in recent decades when old abandoned crops were reverted into natural areas, contributing to increase the presence of new populations in nearby areas. Cereal crops and dry groves seem to be preferred by wild boar in Mediterranean landscapes as feeding areas (Calenge et al. 2004). This species presence is positively correlated with the Total Core Area index (TCA) and the Number of Disjunct Core Areas (NDCA). Thus core area metrics seem to be better predictors for wild boar habitat quality than patch areas metrics. This could be taken into account by forest specialists (Belda et al. 2011).
Big-game species populations have expanded considerably in recent decades, and it appears that environmental changes will occur in forthcoming years. Therefore, as natural predators that can regulate the size of their populations are lacking, hunting management and disease are the only possible regulatory options available (Acevedo et al. 2011).
This work provides important information on the relationships between biodiversity and the landscape structure of the Sierra de Mariola Natural Park. Wildlife managers need to take the landscape structure into account for improving the management of game species in their territory. Thus, local governments and associations of hunters should encourage the conservation of crops and water sources. Our results provide the territorial ordination of hunting yields in southern Spain and offer several potential applications for the strategic planning of hunting activities and biodiversity conservation. Finally, research into the effects of hunting, long-term monitoring, and regional-scale analyses of habitat availability, should be future research priorities.
Since 2009, the camera-traps used in the Sierra de Mariola study area have produced a large volume of information that is difficult to manage. We consider that despite the high initial costs required by camera-trapping -devices and human resources- this method is appropriate for making inventories of ungulates under different environmental conditions, and allows the wildlife conservation status to be rapidly assessed. Hence it is useful to invest time in developing methods and tools such as those mentioned in this work. Moreover, camera traps combined with GIS tools have allowed the integration of simple wildlife information collected in the field with other data sources. Use of camera traps in research has vastly varied and provided researchers with new insights into many aspects of wildlife behavior, which would not have been gained without this technology.
We successfully modeled ungulate behavior using the data collected from camera traps regardless of the multifactorial statistical analyses. By following the proposed methodology -PCA combined with multifactorial analyses- we obtained new evidence to explain ungulates distribution.
Discriminant analysis adjustment was better than logistical adjustment. So we recommend these models for predicting the absence and presence of ungulates under these experimental conditions.

