


 English (pdf)
 Article in xml format
 Article references
 Send this article by e-mail
 Cited by SciELO
  Cited by Google
  Similars in
SciELO
Similars in
SciELO  Similars in Google
 Permalink
INTRODUCTION
Since the 20th century, the use of biological indicators has become an indispensable tool for evaluating the ecological status of an aquatic ecosystem, and monitoring its dynamics, in both lotic and lentic environments. However, more attention has been given to particular communities about others, due to their ease of identification or because they house several species with a high bio-indication value, such as aquatic macroinvertebrates and fishes (Nichols et al. 2000, Pinilla 2016). Within these communities with bio-indicating characteristics, we find the macrophytes that constitute a group of aquatic life organisms where their formations are complex, but easily identifiable (Suarez et al. 2005) and that has been very little studied in Ecuador (Terneus 2002). In the last decade, the water bodies of continental Ecuador have been subjected to strong human pressure as a result of demographic growth and the inequitable distribution of wealth and productive systems.
The presence and abundance of certain species of aquatic plants, together with the physicochemical characteristics of the water they inhabit, such as the concentration of nitrogen and phosphorus, are the biotic and abiotic conditions that commonly define the trophic state of a body of water; in addition this is an essential part for cataloguing lake systems (Moreno Franco et al. 2010, Dodkins et al. 2012). Unlike other aquatic bio-indicators, macrophytes manifest a longer response time to environmental disturbances, being considered as indicators of changes in the medium and long term, i. e. in months or years, so the disappearance of a species can become highly significant for the ecosystem water body functionality (Cirujano et al. 2007, Arnau et al. 2015).
The aquatic macrophytes constitute approximately 1 % of the vascular flora of the world, being today the centre of many investigations (Velásquez 1994, Chambers et al. 2008, Rial et al. 2016). In the last 20 years, the role of macrophytes has been analyzed from the point of view of nutrient recycling (McDermind Naiman 1983, Carvalho et al. 2004, Ramos Montaño et al. 2013) and the impact as indicators of the level of eutrophication in water bodies (Kahn et al. 1993, Rojas Moreno and Novelo Retana 1995, Schneider and Melzer 2003, García et al. 2006, Duran-Suarez et al. 2011). Several investigations have shown the relationship between abiotic parameters and the presence of macrophytes because they are sensitive to fluctuations in the ecosystem giving them an essential value as bio-indicators (Reiss and Brown 2005, Vasquez et al. 2012, Pinilla 2016). However, in order to apply these indices, the specific determination of the different taxa and the reaction patterns of the species to the concentration of nutrients are necessary as determinant elements of their presence (Suarez et al. 2005, Dodkins et al. 2012, Poikane et al. 2018).
It is also important to consider that its application must be restricted to certain regions due to the great environmental variability, which determines the composition and structure of the particular aquatic vascular flora (Pinilla 2016). For this reason, the methods of evaluating the quality or state of health of the lagoons of Ecuador cannot be generalized to other regions.
Research shows that the seasonal fluctuation of water levels and current flows are determinants of the richness and abundance patterns of aquatic plants (Rial 2004, 2006). However, these patterns of seasonal variation are typical of the ecological dynamics of water bodies to which aquatic plants are adapted, responding to intense evolutionary processes. The idea that this is a stress factor implies ignoring the processes of regulation of wetlands where eurytipic plants with ample tolerance to these hydrological changes predominate (Rial 2004, 2014). In Ecuador, this type of weather phenomena and hydrological variation patterns respond to the raised premise, so it is supposed that these variation patterns would not be determinants of wealth and abundance of aquatic plants, as could happen in temperate countries.
In Europe and Africa, several indices have been applied that use aquatic macrophytes as indicators of the rivers trophic status (Dodkins et al. 2012, Kennedy et al. 2016). However, studies have been scarce for lentic environments. In South America stands out the Limnological Status Index (IEL) of Pinilla et al. (2010), which is a simplified version of the ICOL "Use of Limnological Indices of Colombia" (ICOL) where physical and chemical biotic variables are taken into account to determine ecological health in aquatic systems.
The IVAM index used in the Iberian countries (Moreno et al. 2006a) which is currently part of the Water Framework Directive, as a normative body, was taken as reference for the construction of the tool proposed in the present study to evaluate the trophic status in lotic systems. This index is based on relating the composition and structure of aquatic plant species in order to their spatial distribution and habitat preference according to the concentration of nitrogen and phosphorus. Some studies show a high correlation between the concentration of nutrients and the establishment of communities of aquatic plants (Poikane et al. 2018, Stefanidis et al. 2019), an aspect that motivated the construction of this index. The present analysis pursues the objective of adapting the IVAM, to the hydro-biological conditions of Ecuador considering the geological and relief variability influenced by the presence of the Andes Mountain Range.
Its application is aimed to evaluate the trophic status of lentic water bodies specifically, thus generating the IMAE index (Index of Aquatic Macrophytes of Ecuador), a necessary tool for monitoring water bodies and strengthening of the taxonomic and ecological knowledge of this biological guild, very little studied in Ecuador.
MATERIAL AND METHODS
Study Area
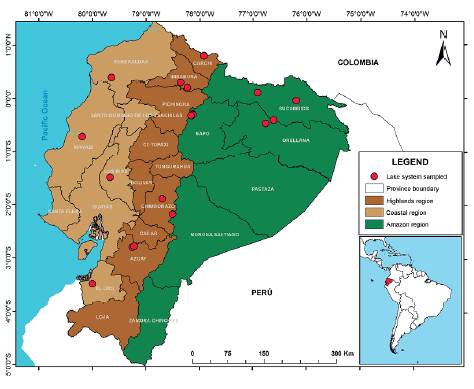
The present study is part of an extensive analysis throughout the three regions of Continental Ecuador, Coast, Highlands and Lowlands, aimed to the taxonomic identification and knowledge of the distribution of aquatic vascular flora and their habitat preferences. The study area comprises 18 lake systems selected from previous studies conducted by Terneus (2002, 2007, 2014), regarding the structure and distribution of aquatic vascular flora and their coverage patterns. From that group of lakes, ten belong to the Highlands region, four to the Coast region and four to the Lowlands region (Fig. 1). It should be noted that the Ramsar Convention has classified nine of the studied systems as wetlands of interest for conservation.
The hydrological regime of the sampled wetlands responds to three seasonal moments: dry, rainy and transitional times, which occur at different times in the three studied regions. Although it is true that rain intensity or drought determines the availability of habitat and the distribution of the species, this pattern appears with more considerable variation in the lotic affluents and effluents of water bodies, unlike wetlands and lagoons that due to being lentic atmospheres undergo less intense and drastic variations in fluctuation and level of water.
Other criteria considered to select the sampling lagoons were the altitudinal range location and the type of anthropic intervention such as the capture of primary sources, dams for irrigation and flood control, and proximity to population centres. The bodies of sampled water were permanent lagoons of depths greater than 5m and with a littoral zone with minimal hydrological variability.
Sampling points location
The sampling points were located in each lake, making exploratory journeys through the perimeter of the water bodies looking for areas of greatest macrophyte diversity, life form diversity, and variability in the coverage patterns, taking into account the coastal zoning proposed by Kiersh et al. (2004), and the diversity of habitats and human impacts. Subsequently, linear depth transects proposed by Terneus (2007) were drawn, whose length was determined by the vertical distribution patterns of the aquatic plant communities along the littoral zone.
Aquatic plants Analysis
Only hydrophytic and heterophytic vascular plants (bryo-phytes, pteridophytes and phanerogams) were taken into account for sampling (Poikane et al. 2018). Linear transects were drawn at several sampling points in each lake, which have their starting point on the shore (0 meters deep) towards the center of the lake, as far as there is the presence of plants (Terneus 2007). The transect was divided into 1 m2 vegetation quadrants where the coverage of the species was estimated as percentages. The use of a 1 m2 frame with a transparent plastic sheet facilitated the coverage observation patterns of the within-species inside the square. For macrophytes of submerged habitats that cannot be seen with naked eyes, collections were made with a drag anchor from the bottom at each sampling unit (Ramos Montaño et al. 2013, Terneus 2014). The samples were analysed in the laboratories of the International University of Ecuador. Finally, the collected material was dried for later identification and final disposal in the herbarium from the Catholic University of Quito (QCA).
Physicochemical analysis
The following variables were taken into account for each transect: saturation and concentration of dissolved oxygen, pH, electrical conductivity, total dissolved solids (STD) and water temperature. These were measured in situ at three different depths with a Hanna brand multiparameter model HI98194.
Research conducted by Arnau et al. (2015), Pinilla (2016), Pinilla et al. (2010), Moreno et al. (2006b), Suárez et al. (2005), and Cirujano et al. (2007) show that important elements for the growth of aquatic plants are nutrients. For nitrites, the kit Hanna brand model HI708 (Colour Checker Nitrite) with a range of 0 - 150 ppm was used. For phosphate concentrations, the kit Hanna brand model HI713 (Colour Checker Mini Phosphate) with a range of 0.00 - 2.50 ppm was used. For the ammonium analysis, the spectrophotom-etry method was used with YSI-9300 equipment.
The Index Construction
Transformation and statistical data processing
All concentration values from the nitrogenous and phosphate species expressed as mg/l of total ammonium, nitrites and phosphates, were transformed to be expressed as a millimolar concentration (mM/l) of nitrogen and phosphorus in terms of logarithm of base 2. The total nitrogen equals the sum of the millimoles of the corresponding nitrogen species. With the transformed values, we proceeded to find the dispersion and central tendency statistics, using as a grouping factor the macrophyte species found in the study sites. Following the methodology of Moreno et al. (2006b) the most relevant descriptors were the maximum values of Total Nitrogen and Phosphorus to form the tolerance value (Vt), as well as the concentration ranges as measures to establish the indicator value (Vi) of each species of macrophyte under study (Table 1). The arithmetic mean of the log-transformed values of Total
Table 1 IMAE-Values of Vt and Vi for each species identified and coded in the three regions of Ecuador. Highlands (H), Coast (C), and Lowlands (L), Species code (COD).
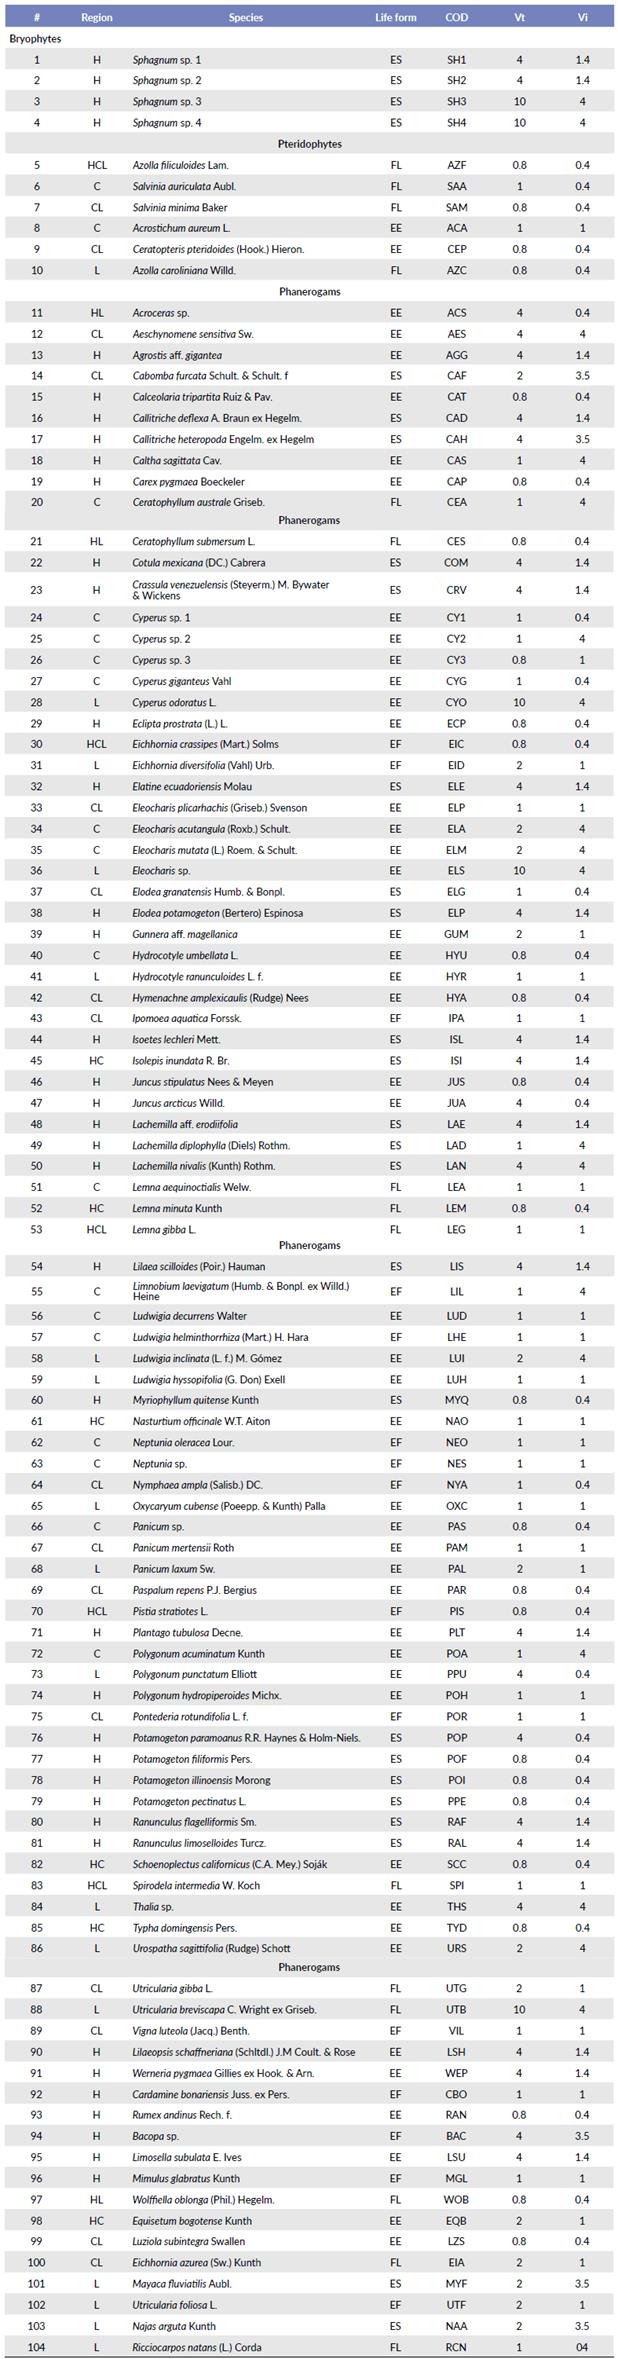
Nitrogen was also used as a necessary descriptor for the latter grouping and species classification.
Index Calculation
Based on the proposal of Moreno et al. (2006b) the calculation of the index is done by applying the formula.
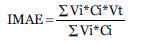
Where Vi is the indicator value of the species; Ci is the value of coverage of the species, and Vt the tolerance value of the species.
Definition of the tolerance value (Vt) and the indicator value (Vi)
The maximum values of Total Nitrogen (Nt), Phosphorus (P) and the arithmetic average of Total Nitrogen were used to group the species through the K-means clustering method with a total of six numerical categories to define the tolerance value Vt; the grouping method is nonhierarchical, and the number of clusters is a function of the number of levels considered most adequate to cover the entire concentration range. The same criterion was used to determine the range of the indicator value Vi, in this, case a number of five conglomerates was determined as the most suitable to convenient to group all the species according to the concentration ranges of (Nt), P and arithmetic mean of (Nt).
Once the species were grouped, the indicator values and the tolerance values corresponding to each of the obtained conglomerates were quantified, for which the total average value of the log2 concentrations of both the (Nt) and P ranges were considered for the case of Vi as for the maximum values of (Nt) and P for Vt, corresponding to each conglomerate of species. Thus, each conglomerate of species has a characteristic average of concentrations expressed as ranges and maxima of N and P. The average normalized value was obtained by dividing the average value of the conglomerate for the arithmetic mean of the log2 value of (Nt) of each of the species. This value raised to a suitable power, subtracted from the unit and multiplied by a numerical factor, corresponds to the values of Vi and Vt of each conglomerate of species. The procedure is summarized in the following mathematical expression:
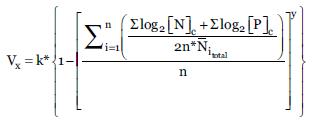
Where:
Vx is the Indicator value (Vi) or Tolerance value (Vt). k is the Constant; where k = 4 for Vi; k = 20 for Vt and: Constant; where y = 2 for Vi; y = 1 for Vt. n is the number of species in the conglomerate [N] c; [P] c: millimolar concentrations of N total and P, expressed as ranges and maximum values respectively for Vi and Vt, associated to each species in the conglomerate. Ni total: Arithmetic mean of the N total for species i.
For any conglomerate, the values obtained under the methodology described will be lower for those species that are more tolerant to high concentrations of N and P, while the higher values belong to the species that are more sensitive to them. In the case that the value calculated for the conglomerate of more tolerant species is equal to zero or negative, we should work with the positive values of the other conglomerates and, by extrapolation, find the corresponding ordinate.
Determination of the coverage value (Ci)
The coverage value is an index expressed in j-levels each corresponding to an accumulated and normalized frequency interval of the total coverage area of all the species in the total study lagoons. The product of the average coverage area of each species multiplied by its frequency of presence varies exponentially according to the number of species, so the value of the integral of the function was an indication of the variation of the area within a given interval. The number of intervals corresponding to j-levels was determined as the number of changes in the value of the slope of the exponential function (Table 2).
The index was calculated as follows:
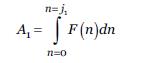
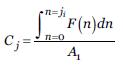
Where:
Al: area of the first interval ji; F (n): function that describes the variation of the area with the number of species n; dn: differential function, where n corresponds to the number of species; Ji: maximum value of n within the given range; Cj: value of the coverage index for an interval Ji.
Grouping of species according to their values of Vi, Vt and Ci
The proposed classification method was subject to a Non-Metric Multidimensional Scaling (NMDS) using Bray Curtis distance as a measure of similarity. The species were grouped according to their values of Vi, Vt and Ci. In addition to the maximum values and ranges of Nt and P, averaged according to the IVAM calculation (Fig 2).
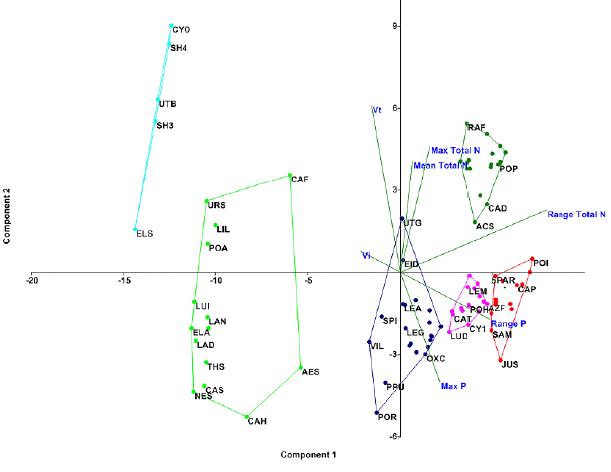
Figure 2 PCA projection of the species correlating Vt, Vi, maximum values of Nt and P, ranges of Nt and P. There are four groups of species that respond better to the variables and testify their quality as bioindicators. Codes of the species are specified in Table 1.
Grouping of lakes according to their IMAE values
Following the same methodology applied to the species, the lagoons were grouped according to the values of the IMAE index. The coordinates respond to the Euclidean distance between lagoons taking as variables the values of Vi, Vt and Ci. (Fig. 2).
RESULTS
In the 24 lagoons visited that make up the 18 lake systems sampled in this study. There were 85 transects with a total of 934 quadrants. A total of 104 species of vascular aquatic plants, 57 species of hydrophytes and 47 species of helophytes were identified. Of which, four species are Bryophytes, six Pteridophytes and 94 Phanerogams. The forms of life found correspond to 43 emergent rooted species, 22 submerged aquatic plants, 23 free-floating ones and finally 17 to floating rooted ones.
Obtaining Vt and Vi
The values of Vt correspond to the manifest tolerance for each species to the maximum concentration of nutrients, while Vi corresponds to the assigned value of indication for each species according to the ranges of concentration of nutrients. Four trophic status classes were established that contain all the species for the Vt and Vi. These levels go from 0.8 to 10 and from 0.4 to 4, respectively (Table 1). The highest values correspond to species sensitive to the concentration of organic load and the lowest scores to species of wider distribution and that better tolerate the eutrophication of water bodies.
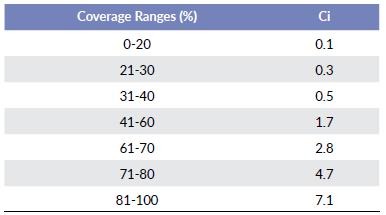
Obtaining Ci
Growth habits in the communities of aquatic plants in the littoral zones of the lagoons tend to form groups or associations of species arranged in a concentric way, where their forms of life form a multicoloured mosaic of coverage patterns, evidencing the dominance of each group or association. The sensitivity to changes in water quality experienced by aquatic plants is usually reflected in the increase or decrease in their coverage. According to the coverage patterns identified in the present study, the values (Ci) are expressed in seven levels, which correspond to an exponential type distribution. At the beginning range, 0 - 20 belong to 0.1 value, and the ending range belong to 81 - 100 belong to 7.1 value (Table 2).
Quality ranges (Q)
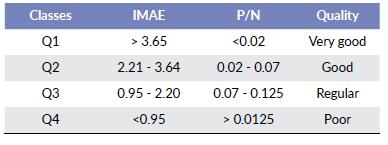
The quality ranks were established through a nonpara-metric analysis of variance (Kruskal-Wallis) and its subsequent grouping with the Bonferroni method (P < 0.05). Four classes of water quality associated with P/Nt concentrations were established. Q1 and Q2 values represent the best quality of water bodies, while Q3 and Q4 represent the regular and poor quality of water bodies (Table 3).
Table 3 Water quality ranges established for the IMAE, as well as a pro-portional variation of the concentration ratio of P/N.
The coordinates of each point correspond to the distance between the species characterized by their values of coverage, tolerance and maximum values, represented in a space reduced to two dimensions in such a way that the distortion caused by the reduction from a dimensionality N was the lowest possible (stress < 0.05; R2 > 0.90). (Fig 2).
DISCUSSION
There is no other index of macrophytes generated in Ecuador to evaluate the quality of lakes and lagoons (Arias and Terneus 2012). The IMAE has been generated in Continental Ecuador in the three biogeographical regions (Coast, Highlands and Lowlands) which have different characteristics from each other and which make up the four biogeographical provinces detailed by the MAE (2013) (Choco, Equatorial Pacific, Highlands of the North, and Northwest Amazonia). Water quality of water bodies can be expected to change between ecoregions in terms of ionic charge, nutrients, and organic matter because they are receptors of climatic conditions, hydrological regimen, and land use practices (Moreno et al. 2006a). Similarly, it is necessary to have a prediction when comparing index values between different types of water bodies, since there may be differences between the indices. Besides, the values of tolerance and the indicator value of the genus can vary between different regions or countries (Pinilla 2016). This highlights the importance of generating indices by specific regions, as in the case of Ecuador and the Andean region.
The IMAE integrates two relevant aspects, the biotic variables and the physicochemical factors for the water quality evaluation in a determined lentic system (Hernández Henao 2015). By combining these factors a more objective vision of the ecosystemic functionality is obtained, and its ecological health status has even been shown to be more efficient than the indices of richness and diversity used to express the conservation status of a water body (Moreno et al. 2006b).
The adapted methodology developed in this study is based on the IVAM proposed by Moreno et al. (2006b), the same one that has been tested in different parts of Europe and America, reflecting its validity. Regardless of how the tolerance values, indicator values and percentage of coverage are established, the IVAM, IMF and IMAE are governed by the same formula, based on the nutrient ranges and including the ecological amplitude of the species studied. As mentioned by Kiersch (2004) and Moreno et al. (2006b), macrophytes as bioindicators depend on the species and the value that corresponds to each of them, so the IMAE focuses on an analysis of aquatic plants and its specific tax-onomic assessment. In contrast to the IVAM, which covers the main groups of organisms considered as bio-indicators where algae stand out and do so in lotic systems and with a generic taxonomic assessment (Kelly et al. 2016).
The vast majority of indices used in Europe (United Kingdom, Germany, France, and Spain) are based on the nutrients of nitrogen and phosphorus in their different forms, since they reflect the levels of eutrophication in the water bodies (Poikane et al. 2018). They also have a direct relationship with the diversity of aquatic plants and with their establishment. The different chemical forms of the two nutrients are involved in their recycling and consumption, so when analysing the data, it is necessary to identify and relate those variables that have a higher correlation and that are statistically significant. For this reason, the IMAE has been elaborated from the values of the ammonium, nitrite and phosphorus concentrations transformed to milli-molar units, where the nitrogenous species respond to the total nitrogen. Given that in the IMAE was found a significant correlation between total nitrogen and coverage. (P = 0.03), this correlation justifies its use in the calculation of Vi and Vt., unlike the (IVAM) that uses the net values of the ammonium and phosphate concentrations.
In reference to the level of taxonomic resolution of the species, Moreno et al. (2006b) and Arnau et al. (2015) emphasize that this has a significant effect on the establishment of quality classes. The IMAE worked at the finest possible taxonomic level so that only thirteen species are classified at the genus level, among which the bryophytes and some genera of the families Poaceae and Cyperaceae predominate. Additionally, it should be noted that the IMAE registers a larger number of phanerogams (94) concerning the other indices proposed by Moreno et al. 2006a, Moreno Franco et al. 2010), which take into account different taxonomic groups due to their limited representativeness in lotic systems (Bonilla and Novelo 1995, Kelly et al. 2016), while the IMAE focuses only on aquatic plants, which having different life forms capture nutrients from different areas of the water bodies (from the substrate through their rhizomes and stolons, from the water column through leaves and from the mirror of water by stolons, leaves and shoots) (Poikane et al. 2018).
It is very important to emphasize that the IMAE establishes four levels of water quality, which are related to the variations of nitrogen and phosphorus. Where Q1 and Q2 represent oligotrophic systems of excellent and good quality ranks respectively. There are also lakes that are influenced by anthropogenic pressures (Q3) and (Q4); the presence of these activities have a relationship in the increase of nutrients, characterized by a high load of nutrients with particularities of eutrophy and hyperthrophy (Dawson et al. 1996). The hydrological regimen of each water body is a key issue and most be always described and analyzed. Nutrients exchange occurs around the wetland according to it, affecting the presence of some species and communities.
The upper quartile of the IMAE values in any of the three regions refers to higher quality water bodies, while the lower quartile reflects the impacted or degraded zones. Most of the Highlands region systems are located in Q1 and Q2, where there are the most sensitive species to nutrient concentrations, because they receive less human pressure and therefore lower nutrient supply, as evidenced in the lagoons located in the paramo area and within of protected areas (Terneus 2002, 2007, Moreno et al. 2006a, Moreno Franco et al. 2010, Schmidt-Mumm and Vargas Rios 2012, Ramos Montano et al. 2013). While the low quality Q3 and Q4 values enclose the most affected lagoons located in the lowlands regions.
The species that are found in higher altitudes tend to be more sensitive to environmental fluctuations (Ramos Montano et al. 2013). However, not all species found in this area are considered good quality bounders; Kiersch (2004) catalogue certain species such as Ceratophyllum demersum L., Myriophyllum quitense Kunth and Potamogeton illinoensis Morong as highly tolerant species to a high concentration of nutrients. On the other hand, from 12 to 300 meters of altitude we find a greater diversity of species, mostly with generalist characteristics, cosmopolitan and tolerant to human disturbances such as Pistia stratiotes L. with a Vt of 0.8 and a Vi of 0.4, Eichhornia crassipes (Mart.) Solms, and Pontederia rotundifolia L. f. that presents a Vt and a Vi of 1. As mentioned by Moreno et al. (2006b), species with the lowest Vi and Vt are highly distributed and indicate high levels of nutrients.
The IMAE can be used as a complement to other indexes to monitor and catalogue lake systems, depending on the eutrophy of water bodies and habitat preferences for the growth of aquatic plant species.
The IMAE index will contribute significantly to the enrichment of the environmental control tools of the Ecuadorian state, by representing a systematically raised methodological input and whose technical justification justifies the assessment of the quality thermometers used in the proposed model.

