Notas breves
Elevation as an occupancy determinant of the little red brocket deer (Mazama rufina) in the Central Andes of Colombia
Elevación como un determinante de la ocupación del venado soche (Mazama rufina) en los Andes centrales de Colombia
1 Sociedad Colombiana de Mastozoología, SCMas, Bogotá D.C. Colombia. dj.lizcano@gmail.com
2 Wildlife Conservation Society, WCS, Bogotá D.C, Colombia. salvarez@wcs.org
3 Programa de Biología, Universidad del Quindío, Armenia, Quindio. vandiaz91@gmail.com
4 Grupo de investigación en Ecología y Biogeografía (GIEB), Departamento de Biología, Universidad de Pamplona, Pamplona, Norte de Santander. diecolo24@gmail.com
5 Centro de Estudios de Alta Montaña (CEAM), Colección de Mamíferos Universidad del Quindío (CMUQ), Armenia, Quindio. ceam@uniquindio.edu.co
ABSTRACT
We assessed the influence of terrain variables on the occupancy of the little red brocket deer (Mazama rufina) in the Central Andes of Colombia. Occupancy increased with elevation up to 3000, where it starts decreasing. This information is crucial to predict the potential effects of climate change on M. rufina and other mountain species.
Keywords: Andean mountains; camera trap; Cervidae; detection probability
RESUMEN
Evaluamos la influencia de variables del terreno sobre la ocupación del venado soche en los Andes centrales de Colombia. La ocupación aumenta con la elevación hasta los 3000 m y por encima de este valor decrece. Esta información es crucial para predecir los posibles efectos del cambio climático sobre M. rufina y otras especies de montaña.
Palabras clave: Cervidae; montañas andinas; probabilidad de detección; trampa cámara
Understanding the factors influencing the spatial distribution of mountain-living species is important to predict their potential responses to climate change and other factors affecting their habitat availability and quality (Elsen and Tingley 2015). The little red brocket deer (Mazama rufina Pucheran, 1851) is found in Andean forests above 1500 m and goes up to paramos at 3800 m in Venezuela, Colombia, Ecuador, and Northern Peru (Lizcano et al. 2010). It is classified as vulnerable by IUCN due to the decrease in its populations associated to habitat transformation and habitat loss (Lizcano and Alvarez 2016). In this study we estimated the influence of mountain attributes (i.e., terrain variables) on occupancy (ψ) and detection probability (p) of M. rufina.
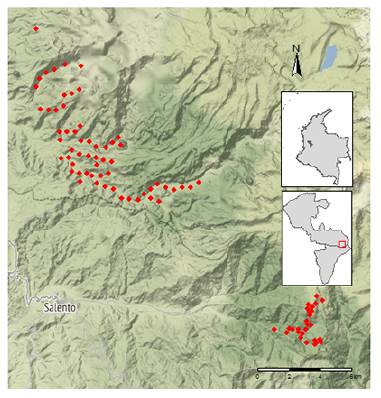
This study took place in the Central Andes of Colombia, at the Biological Station Estrella de Agua and its surroundings in Salento, (Quindío department) and Ucumari Regional Park (Risaralda department). In these two localities elevation ranged between 1800 and 3880 m. We installed 28 camera traps (Bushnell HD) in three arrays between March and June 2017 at the Quindio locality where they remained active for 35 days. In Risaralda we installed 60 cameras (Bushnell Trophy Cam) in two arrays between March and July 2017. These remained active for 45 days. We installed the camera traps with at least 500 m distance from each other on a regular grid. Distance between cameras was based on travel distance estimates for the closely related species Mazama gouazoubira (Fischer, 1814), to ensure sampling independence (Grotta-Neto et al. 2019). Cameras were unbaited. We followed a variation of the TEAM Network protocol (TEAM Network 2011). We organized and tagged pictures using the software WildID (Fegraus et al. 2011), using one-hour intervals to define independent sampling events (Meek et al. 2014). For more details on methods (see Supplementary material).
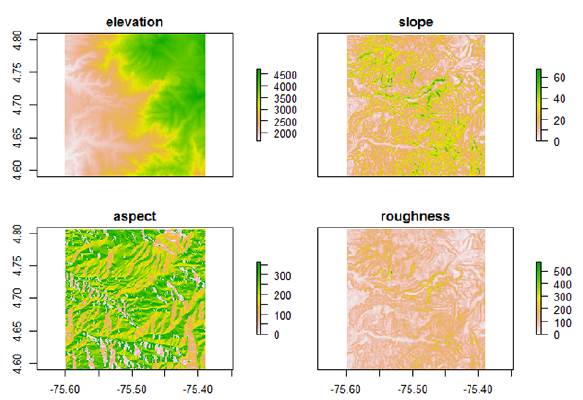
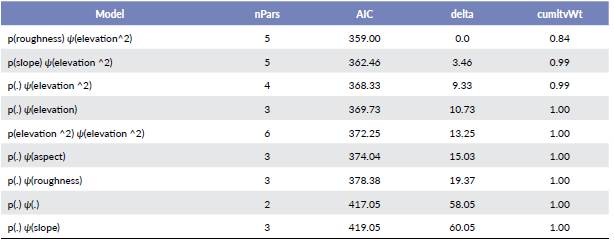
Based on elevation data (CGIAR-SRTM 90 m), we estimated three terrain variables slope, aspect, and roughness that can, in addition to elevation, influence the presence of M. rufina. We used the occupancy modeling framework to investigate the relationships between occupancy, elevation and terrain covariates, which were previously normalized and evaluated for correlation (MacKenzie et al. 2006). We assessed the effect of these covariates and combinations of them on occupancy and detection probability across a set of nine candidate models (Supplementary material) and used the Akaike Information Criterion (AIC) and cumulative weights for model selection, using a minimum difference of 2.0 between AIC values to differentiate models (Akaike 1973). We used the package 'unmarked' for model fitting, model selection, and assessing goodness-of-fit of the selected occupancy model (Fiske and Chandler 2011). We used the best-fit model to predict the occupancy across a spatial grid extending over both sampling localities. For reproducibility purposes, full code and data set are provided in https://github.com/dlizcano/Mazama_rufina.
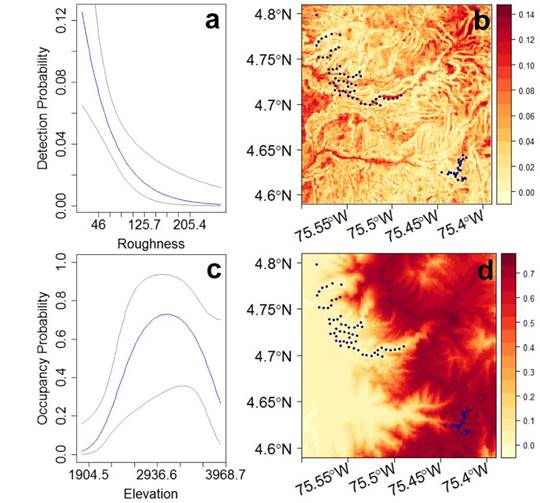
A total of 9396 camera days were accumulated, with an average of 41.76 observations per site, based on records from 87 cameras. The best-fit model showed that detection probability decreased with increasing roughness while occupancy increased with elevation but decreased with values above 3000 m (Fig. 1, Supplementary material). Naive occupancy was 0.26, while estimated occupancy was 0.56 assuming the elevation average and correcting the detection process with roughness values.
The best model suggests that occupancy reaches a maximum around 3000 m. Elevation is a common variable influencing species distribution of tropical animals, which can be linked to physiological conditions as well as biotic interactions (Jankowski et al. 2013). Studies on physiological limitations, interactions with other species, and temporal variation in diet could help explain the occupancy peak around 3000 m of M. rufina. Elevation has also been observed to influence habitat use and movement of other deer species, especially of migratory ones outside the tropics (Mysterud 1999, Wyckoff et al. 2018). Determining whether migration is also present in this tropical deer is important to predict its response to climate change, a factor that can further threaten its persistence in the tropical Andes.
ACKNOWLEDGMENTS
Data collection was funded by Segre Foundation as part of the Tapir Conservation Project of the IUCN Tapir Specialist Group (TSG). We thank the local communities for logistical support and hospitality, CARDER and CRQ for providing permits number 253-03-2017 and 118 to work in the study area.
LITERATURE CITED
Akaike H. 1973. Information theory and an extension of the maximum likelihood principle. In: Petrov BN, Csaki F, editors. 2nd International Symposium on Information Theory. Budapest: Akademiai Kiado. p. 267-281.
[ Links ]
Elsen PR, Tingley MW. 2015. Global mountain topography and the fate of mountain species under climate change. Nat. Clim. Change 5(8):772-776. doi: https://doi.org/10.1038/nclimate2656
[ Links ]
Fegraus EH, Lin K, Ahumada JA, Baru C, Chandra S, Youn C. 2011. Data acquisition and management software for camera trap data: A case study from the TEAM Network. Ecol. Inform. 6(6)345-353. doi: https://doi.org/10.1016/j.ecoinf.2011.06.003
[ Links ]
Fiske I, Chandler R. 2011. unmarked: An R Package for fitting hierarchical models of wildlife occurrence and abundance. J. Stat. Softw. 43(10):1-23. doi: https://doi.org/10.18637/jss.v043.i10
[ Links ]
Grotta-Neto F, Peres PHF, Piovezan U, Passos FC, Duarte JMB. 2019. Influential factors on gray brocket deer (Mazama gouazoubi-ra) activity and movement in the Pantanal, Brazil. J. Mammal 100(2)454-463. doi: https//doi.org/10.1093/jmammal/gyz056
[ Links ]
Jankowski JE, Londono GA, Robinson SK, Chappell MA. 2013. Exploring the role of physiology and biotic interactions in determining elevational ranges of tropical animals. Ecography 36(1):1-12. doi: https://doi.org/10.1111/j.1600-0587.2012.07785.x
[ Links ]
Lizcano DJ, Alvarez SJ. 2016. Mazama rufina. The IUCN Red List of Threatened Species 2016: e.Tl2914A22l65586. [Last accessed: 28 Feb 2020]. doi: doi: https://doi.org/10.2305/IUCN. UK.2016-2.RLTS.T12914A22165586.en
[ Links ]
Lizcano DJ, Alvarez SJ, Delgado-V C. 2010. Dwarft red brocket Mazama rufina (Pucheran 1951). In: Duarte, JMB, González, S, editors. Neotropical Cervidology: Biology and Medicine of Latin American Deer. Jaboticabal: Funep. p. 177-180.
[ Links ]
MacKenzie DI, Nichols JD, Royle JA, Pollock KH, Bayley LL, Hines JE. 2006. Occupancy Estimation and Modeling: Inferring Patterns and Dynamics of Species Occurrence. Burlington: Academic Press.
[ Links ]
Meek PD, Ballard G, Claridge A, Kays R, Moseby K, O'Brien T, O'Connell A, Sanderson J, Swann DE, Tobler M, Townsend S. 2014. Recommended guiding principles for reporting on camera trapping research. Biodivers. Conserv. 23:2321-2343. doi: https://doi.org/10.1007/s10531-014-0712-8
[ Links ]
Mysterud A. 1999. Seasonal migration pattern and home range of roe deer (Capreolus capreolus) in an altitudinal gradient in southern Norway. J. Zool. 247(4)479-486. doi: https://doi.org/10.1111/j.1469-7998.1999.tboioil.x
[ Links ]
TEAM Network. 2011. Terrestrial vertebrate protocol implementation manual, v. 3.1. Centre for applied biodiversity science. Arlington: Tropical Ecology, Assessment and Monitoring Network, Center for Applied Biodiversity Science, Conservation International.
[ Links ]
Wyckoff TB, Sawyer H, Albeke SE, Garman SL, Kauffman MJ. 2018. Evaluating the influence of energy and residential development on the migratory behavior of mule deer. Ecosphere 9(2):e02113. doi: https://doi.org/10.1002/ecs2.2113
[ Links ]
SUPPLEMENTARY MATERIAL
Methods details
Camera placement: The cameras were installed using a minimum distance of 500 meters between each other. This distance corresponds to an average home range for the closely related species Mazama gouazoubira (Fischer, 1814).
The data set for the little red brocket deer was produced manipulating the output tables from WildID using the R code created by the TEAM network, available in the link: https://github.com/ConservationInternational/teamcode/tree/master/cameratrapping
The definition of an event for the camera trap data organization (Meek et al. 2014) was initially defined as one hour, meaning that all the little red brocket deer pictures in the same camera during one hour period were grouped and considered as one individual event. For the occupancy analysis, we grouped and coded all the events on the same day as one, and cero if there was no picture on that day. The data set was composed of 108 days and 87 sampling locations or camera sites. We did not collapse the data set to perform the analysis. We used the occupancy modeling framework to investigate possible relationships between occupancy and the geographical covariates et al. 2017; Dénes et al. 2015; Bajaru et al. 2019). We compared a set of nine models testing the effect of the covariates on occupancy and detection. In this framework, weson 2002; Johnson and Omland 2004). The models were coded using the package unmarked (Fiske and Chandler 2011). The spatial covariates used in the analysis were four; elevation, slope, aspect, and roughness (Fig. 1). The elevation was obtained from the CGIAR-SRTM (90 m resolution) using the function getData of the package raster (Hijmans 2020). Slope aspect and roughness were computed using the function terrain of the package raster. The four covariates were stacked, and the values were extract-ed for each camera trap location using the function extract from the package raster (Hijmans 2020).
Table 1 Model assessment to select the best-fit model for detection probability (p) and occupancy (ψ) of M. rufina. The point in the model indicates that the parameter (detection or occupancy) is constant and variables inside the parenthesis represent the covariate related to the parameter.
R code and data to reproduce the analysis and figures are at: https://github.com/dlizcano/Mazama_rufina
CITED LITERATURE
Akaike H. 1973. Information theory and an extension of the máximum likelihood principle. 2nd International Symposium on Information Theory.:267-281. doi: https://doi.org/10.1016/j.econlet.2011.12.027.
Bajaru SB, Kulavmode AR, Manakadan R. 2019. Influence of microhabitat and landscape-scale factors on the richness and occupancy of small mammals in the northern Western Ghats: A multi-species occupancy modeling approach. Mamm Biol. 99:88-96. doi: https://doi.org/10.1016/J.MAMBIO.2019.10.003.
Burnham KP, Anderson DR. 2002. Model selection and multimodel inference: a practical information-theoretic approach. Springer Science & Business Media, New York. doi: https://doi.org/10.1007/b97636
Dénes FV, Silveira LF, Beissinger SR. 2015. Estimating abundance of unmarked animal populations: accounting for imperfect detection and other sources of zero inflation. Isaac N, editor. Methods Ecol Evol. 6(5):543-556. doi: https://doi.org/10.1111/2041-210X.12333
Fiske I, Chandler R. 2011. unmarked : An R Package for fitting hierarchical models of wildlife occurrence and abundance. J. Stat Softw. 43(10):1-23. doi: https://doi.org/10.18637/jss.v043.i10
Hijmans RJ. 2020. raster: Geographic Data Analysis and Modeling. R package version 3.4-5. [Revisada en: 01 Ene 2020] https://cran.r-project.org/package=raster.
Johnson JB, Omland KS. 2004. Model selection in ecology and evolution. Trends Ecol. Evol. 19(2):101-108. doi: https://doi.org/10.1016/j.tree.2003.10.013
MacKenzie DI, Nichols JD, Royle JA, Pollock KH, Bailey L, Hines JE. 2018. Occupancy Estimation and Modeling. 2nd ed. London: Academic press. Elsevier. doi: https://doi.org/10.1016/C2012-0-01164-7.
Meek PD, Ballard G, Claridge A, Kays R, Moseby K, O’Brien T, O’Connell A, Sanderson J, Swann DE, Tobler M, Townsend S. 2014. Recommended guiding principles for reporting on camera trapping research. Biodivers. Conserv. 23:2321-2343. doi: https://doi.org/10.1007/s10531-014-0712-8.


 Inglês (pdf)
 Artigo em XML
 Referências do artigo
 Enviar este artigo por email
 Citado por SciELO
  Citado por Google
  Similares em
SciELO
Similares em
SciELO  Similares em Google
 Permalink