Servicios Personalizados
Revista
Articulo
Indicadores
-
 Citado por SciELO
 -
 Accesos
Links relacionados
-
 Citado por Google
 -
 Similares en
SciELO
 -
 Similares en Google
Compartir
Revista de la Academia Colombiana de Ciencias Exactas, Físicas y Naturales
versión impresa ISSN 0370-3908
Rev. acad. colomb. cienc. exact. fis. nat. vol.39 no.151 Bogotá abr./jun. 2015
https://doi.org/10.18257/raccefyn.184
doi: http://dx.doi.org/10.18257/raccefyn.184
1 Universidad Nacional de Colombia - Sede Bogotá, Colombia. *Corresponding author: Carlos Alberto Vargas Jimenez, cavargasj@unal.edu.co
2 Universidad Francisco de Paula Santander, Cúcuta, Colombia
3 Universidad Antonio Nariño, Bogotá, Colombia
Recibido: 16 de enero de 2015. Aceptado: 26 de abril de 2015
Abstract
This work extrapolates the application of coda-waves' imaging, in order to determine lateral anomalies of attenuation for surficial targets, and providing experimental elements that justify its use in an economic way with a relatively good resolution. A numerical procedure for the spatial inversion of the attenuation, inside a small region, has been established. The numerical effectiveness of the inversion was evaluated carrying out a field experiment, which detects, based on attenuation contrasts, the presence of a tunnel built in the Colombian Eastern Cordillera. The experimental work allows the validation of the proposed method, and the acquisition of associated information about the geotechnical conditions at the experimental site.
Key words: Coda waves, attenuation, scattering, tomography, surficial exploration.
Resumen
En este trabajo se extrapola la aplicación de estimación de imágenes a partir de ondas Coda, en busca de definir anomalías laterales de atenuación relacionadas con objetivos superficiales y suministrando elementos experimentales que justifican su uso de manera económica con una relativamente buena resolución. Se presenta un procedimiento numérico para la inversión espacial de la atenuación para un volumen o región pequeña. La efectividad numérica de la inversión fue evaluada mediante un experimento de campo, que basado en contrastes de atenuación, detecta la presencia de un túnel construido en la Cordillera Oriental de Colombia. El trabajo experimental permite la validación del método propuesto, así como la manera en que fueron adquiridos los datos alrededor de un propósito geotécnico.
Palabras clave: ondas coda, atenuación, dispersión, tomografía, exploración superficial.
1. Introduction
Inelastic attenuation is the energy loss that seismic waves suffer while they propagate through a medium. In a seismogram the attenuation is represented by the amplitude reduction, caused by geometric spreading, intrinsic attenuation due to the medium anelasticity, scattering associated with the inhomogeneities, among other factors. The end part of a seismogram of short period, normally in the frequency range between 1 and 50 Hz, is called "coda" or "seismic coda waves". The coda is an important feature of seismograms of local earthquakes. Short period coda waves coming from nearer earthquakes became a subject of detailed study since mid the past century. Estimates of scattering and absorption parameters of the Earth can be derived from coda observations.
The seismic coda depends on the composition of the medium between the seismic station and event location, independently of the energy released in the earthquake or elastic perturbation (Aki & Chouet, 1975). Its duration is an increasing function of the magnitude of the event, and corresponds to approximately 60% of the seismogram (Lee et al., 1972). Snieder (2006) remarks that "coda waves are sensitive to changes in the subsurface because the strong scattering generated by the heterogeneity of the medium and the repeated sampling of waves along a limited region of space". Therefore, the analysis of "the coda of seismograms" is important because brings information about the medium crossed by these seismic waves.
Different works have been carried out to demonstrate and to apply the capability of the coda waves to reconstruct the attenuating structure of subsoil. For example, the quality factor Qc (which characterizes the attenuation) has been estimated to assess the effect of tectonic and seismic activity in the NW Himalayas (Kumar et al., 2005). In that work the authors observed that the quality factor of the coda waves is strongly dependent on frequency, which indicates that the region is tectonically active and may incorporating large crustal heterogeneities.
In Colombia has been emphasized its use in the determination of temporary contrasts of attenuation associated with eruptive processes (Londoño & Sudo, 2002), and to identify the spatial contrast of attenuation at regional level (Vargas, 1999; Ugalde et al., 2002; Vargas et al., 2004; Vargas & Mann, 2013). Nevertheless its seismological use has not been applied extensively in terms of a spatial characterization of geotechnical purposes.
The use of coda waves for geotechnical purposes have been applied in several cities. For example, after the Calima earthquake (Colombia, February 8, 1995, ML= 6.6) a geotechnical zonation was carry out in Pereira city. Spectra of the coda waves allowed the observation of contrasts of amplification, the identification of the dependency on the frequency and dominant periods of 0.5 s in fluvio-lacustrine formations and anthropic landfills, while the deposits of volcanic ash did not offer clarity about dependency on frequency, neither on dominant period (Carvajal & Vargas, 2001). Vargas et al. (2001), obtained the transfer function "Soft Formations/Rock" in two places of the Armenia city using neural networks. In Vargas et al. (2001) coda waves associated to three-dimensional accelerographic records from aftershocks of the Armenia earthquake (Colombia, January 25, 1999, MW = 6.2) were used. A similar pattern with seismic coda waves of earthquakes in the region of Guerrero (Mexico) was applied in order to obtain the transfer function of the shallow formations of Mexico City (Vargas & Cuenca, 2003).
Despite the good information that provides the analysis of coda waves, is not common to find examples that evaluate its aptitude to define lateral variation of geotechnical properties. An explanation of such situation seems to be the relative good availability of other methods as seismic techniques (refraction and reflection) and electromagnetic arrays (GPR), which offer 2D images of relatively acceptable quality for geotechnical purposes. On the other hand, 3D tomography images have been associated with intensive computational processes that could lead to misinterpretations when there is not additional information from other techniques.
This work extrapolates the application of coda waves using tomography in order to determine lateral anomalies of attenuation for geotechnical purposes, and providing experimental elements that justify its use in an economic way with a relatively good resolution.
2. Geotectonic frame
Colombia is located in the northwest corner of the South American. It is a region of high seismic activity as result, mainly, of the convergence of three lithospheric plates: Nazca, South America and Caribbean. Figure 1 shows that Colombia's topography is dominated by the Andean Cordillera that is crossed by an intricate system of faults. Seismicity along the Andean region is coming from different sources, e.g. subduction, surficial active faults, volcanoes and anthropogenic events. Nevertheless, seismicity near to Bogota and the study area (the Boqueron tunnel) is sparse and with low recurrence.
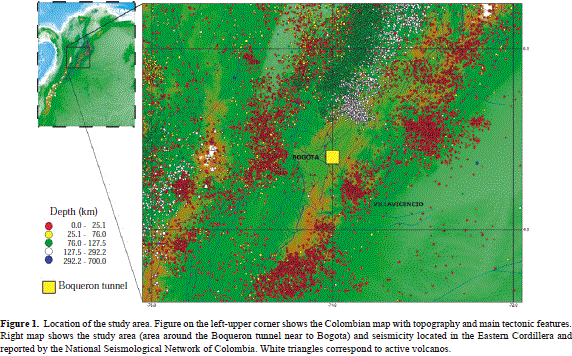
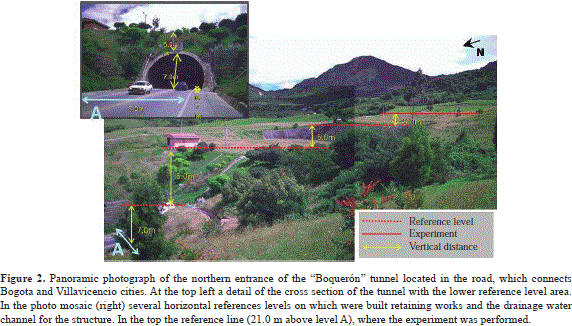
The study area of this work is located on the Eastern Cordillera, which is the eastern branch of the Andean Cordillera in Colombia. The experimental site was located near the northern entrance to the "Boquerón" tunnel (known also as the "Argelino Duran Quintero" tunnel), which is located on the road that connects Bogotá and Villavicencio cities. This road crosses different rock units and geological structures of the Eastern Cordillera, thus explaining the variation in the geomechanical behavior observed at different sections during rainfall events.
At the exit from Bogotá, the road passes through rocks belonging to the so-called Guaduas and Bogotá Paleogene formations, comprising shales covered in several sectors by fluvio-glacial deposits. In the vicinity of the Boquerón tunnel, sandstones with intercalated shales are present, which form part of the "Arenisca Dura" Formation of the Guadeloupe Group - Upper Cretaceous age (Lobo-Guerrero, 1992).
The experimental site ("Boqueron" tunnel) is located relatively close to the "Piedemonte Llanero" fault system. A recent and relevant earthquake is associated to the activity of this geological structure. The so-called "Quetame" earthquake, on May 24, 2008, 55 km south-east of Bogotá, 30 km depth, and ML = 5.5, hit the central-eastern region of Colombia and seriously affected the neighboring localities, including Bogotá city, and the road, which connects Bogotá and Villavicencio cities (where the tunnel is located). No structural damage of the tunnel was reported regarding this event.
3. Attenuation parameters
The quality factor Q is a dimensionless parameter of measurement of the attenuation of seismic waves. Its inverse, that is the specific factor of attenuation, is defined as:

where, DE represents the energy of a harmonic excitation, dissipated by cycle, in a certain volume, and E is the stored elastic energy during the same cycle. In contrast to the previous parameter, the attenuation factor g is defined as the coefficient of inelasticity with respect to the distance:

It means the relative variation of the amplitude with respect to the distance due to anelastic effects. Integrating Eq. 2 we obtain:

This equation represents the variation of the amplitude A of the seismic wave with the distance r, being A0 and r0 initial constants. Q and g can be related to the equation of energy of a harmonic movement:

where k is the elastic constant, and A is the amplitude of the movement. Calculating the DE/E ratio from (4), and replacing (1) we obtain:

Here we consider that DE in (1) represents the energy loss, which is, for this reason, a negative quantity. The obtaining of (5) supposes the following approach, valid for the case of not perfectly elastic behavior or weak dissipation:

Integrating (5) and considering that T = 2p/w, being T the period, and w the angular frequency, we obtain:

Eq. (7) represents the variation of the amplitude of the seismic wave with time, where A0 and t0 are constants. Comparing (3) and (7) it is observed that g and Q take into account the effects of the energy absorption on the amplitude of the movement. g evaluates the energy variation in space, whereas Q considers the time variation of the energy in a point. Equaling these equations and considering that the energy is propagating with velocity v, we obtain:

Taking into consideration the phenomenon of attenuation in time, Dainty (1981) determined that the overall attenuation of coda waves is the sum of the contributions of intrinsic absorption 1/Qi, and the attenuation by scattering 1/Qs, and proposed the following expression:

This expression can be rewritten as:

being g the coefficient of relaxation. This expression has been questioned when it is used supposing that the intrinsic absorption is independent of the frequency.
4. Modeling of Q by means of hypothesis of single scattering
4.1. Basic concepts
The proposals of modeling the quality factor Q of Coda, or Coda Q, have evolved from the first ideas raised by Aki (1969) that supposed that coda waves propagate in homogeneous and isotropic medium, with heterogeneities located randomly and uniformly distributed, and where source and receiver are coincident. This model, based on weak relaxation, is known as Model of Single Backscattering, and was the point of inspiration of some proposed methods later. This theory is based on the fact that the power spectrum of coda waves can be expressed as:

where, S(w) has information about the focal parameters, C(w) about the region characteristics, and R(w) about the conditions and system of registry. This equation is valid for t > 2tb being tb the time of arrival of S-waves (Rautian & Khalturin, 1978). The form of P(w,t) was expressed by Aki and Chouet(1975) in its model of Single Backscattering under the following premises:
1. Coda is composed by S-waves.
2. The effects due to multiple scattering are not taking into account.
3. The scatterers are distributed on uniform and random form.
4. The propagation medium is uniform, and is limited only in the surface.
In a system of ideal registry, the effect of the term R(w) in (11) can be neglected. We suppose that f = (wlr) is the Fourier Transform of the displacement due to waves that have undergone some process of scattering with some single heterogeneity located at a distance r; f = (wlr) depends on the seismic source as well as on the scatter. Supposing an uniform and random distribution of heterogeneities responsible for scattering the waves, and taking N(r) as the number of scatters within a radius r around the station, then the number of heterogeneities in a region limited by the interval (r, r + Dr) will be (dN/dr )Dr. In this case, the waves that travel toward the receiver, originated on scatters located in the interval (r, r + Dr) will have to arrive at the station in a time interval (t, t + Dr), where Dt = 2Dr/v. For a large distance range Dr (such that the corresponding Dt is greater than the duration of the travel of a wave that has undergone the scattering in a single heterogeneity, and for a random distribution of heterogeneities) the sum of the energy obtained by arrivals of waves at the receiver after undergoing scattering, in heterogeneities, for (t,t + Dt), will have to be equal to Dt times the density of the power spectrum of coda waves. Therefore, we can write:

where, rn is the distance from the nth scatterer to the registry station. If now we considered that this phenomenon takes place for internal waves, we can consider a density e of scatters by volume unit. The number of heterogeneities within a spherical region in the radius interval (r,r + Dr) is:

Thus, it is possible to rewrite (12) as:

If additionally we consider the effect of geometric expansion of the seismic waves, the power spectrum of amplitude of the coda waves depends on the traveled distance, according to the expression:

Besides the geometric expansion, the related anelastic attenuation in (1), (5) and (7) allows Eq. 15 be rewrited as:

Taking (14) and (16) with r = vt/2 and Dr = vDt/2, the expression for the density of the power spectrum of coda waves is obtained for internal waves that have undergone scattering with some heterogeneity of the medium:

In this way, P(w,t) can be expressed in a simplified way as:

where, b is the velocity of S-waves, g(p) is the directional scattering coefficient, defined as 4p times the fractional energy loss due to the relaxation of primary waves per unit of distance, measured from the direction of propagation of the wave. Combining the equations (16) and (18), taking into account the attenuation effect in the propagation from the scatter to the station, and by linearization, we obtain:

where, C is a constant with respect to t, and Aobs (flr, t) the amplitude of the registry, previously filtered at frequency f. In this way,Qc-1 can be found by a single linear regression.
The previous model was extended by Sato (1977) to the case when source and receiver were not coincident. His model, called Model of Single Isotropic Scattering supposes three-dimensional, infinite and perfectly elastic medium in which the scatters are distributed randomly in a homogenous medium. In this model, the distribution of heterogeneities is characterized by the average free-path Ls, which is determined by the probability that a primary wave has to undergo a scattering by a heterogeneity of the medium. This probability, of dimension L-1, is equal to the inverse one of the average free-path and is named the turbidity g. In addition, the source is placed at the origin, the receiver is located at a distance r from origin, and the ith scatter at distances ri from source.
In such conditions, the energy density of the scattered wave by ith heterogeneity Eis without considering the second order and higher terms in the estimation of s (effective cross section of the scattering process), and at the frequency f (f = 1/T ≈ w/2p), can be expressed as:

r, r1, r2as shown in Figure 2. L(tlf) is the power spectral density generated at the source, and n0is the density of scatterers distributed homogeneously.
The energy density of all the waves that have undergone a single scattering is equal to the sum of all scalar densities, Eis thus:

The integral is extended over the whole volume of the medium.
This equation can be written as:

where, Gs is the Green's function defined as:

Attention is called to the fact that in the term d(t – (r1 + r2)/v) the single scatterered waves at a distance r and at a time t consist of the scattererd waves from scatters distributed over a spheroidal shell of which the foci are the source and the receiver. Applying in (23) a spherical transformation of coordinates with center in the source, the following equations are obtained:

where, r, v, t as defined herein above and

being q(x) the Heaviside's step function, and for Sato (1977) corresponds to the causality condition, which means that the apparent propagation velocity is less than or equal to v.
Now, if it is supposed that the energy generation is expressed by

being Lu(tlf) the average energy production per unit time of the elastic wave, within a unit angular frequency band around w at the source (subscript u denotes the source time duration of the considered impulse at the source), W0 (f) is the total radiated energy within a unit angular frequency band.

As "u" is a short time with respect to the direct wave travel time, it is possible to approach (1/u)Su(t) to a delta function, and to write directly after the integration:

If the direct S-wave energy is named Esw, and the Q value is considered, the equation (28) can be expressed as

As the energy ratio Esw/Es is aproximately equal to As/Ac2, with As taken as the maximum S-wave amplitude, and Ac as the coda wave amplitude, it is possible to obtain:

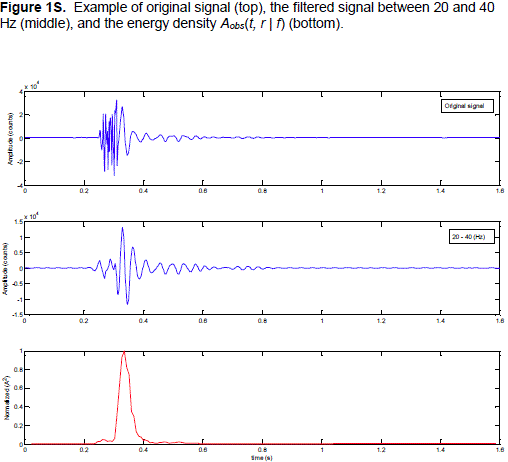
In equations (29) and (30) ts is the travel time of the direct S-wave, and Qc is the coda Q. According to Sato (1977), by performing a linear regression of equation (30) we obtain Qc-1 from a single linear regression on filtered seismograms at frequency f (Figure 1S, http://www.raccefyn.co/index.php/raccefyn/article/downloadSuppFile/184/832).
4.2. 3D Tomographic analysis of Qc
As it has been demonstrated by different authors (Singh & Hermann, 1983; Pujades et al., 1990; Xie & Michell, 1990) the regionalization of Qc implies to consider that the chosen frequency is sensitive to the presence of scatters of certain sizes. Conventionally, from the law Qc ( f ) = Q0fn it has been obtained the term Q0 to regionalize Qc to 1 Hz. Following the model of seismic coda proposed by Aki (1969) and Aki and Chouet(1975), as well as the results of scattering found by Malin (1978), Pulli (1984) and Durán et al. (2003), in an instant t, the amplitude of coda must be due to back-scattering of the primary waves at the scatterers located in ellipses whose foci are the registry station and the hypocenter respectively. For homogenous scatters distribution, the sampled volume by coda waves can be expressed as:

This ellipsoid represents the geometric place of the points whose sum of distances to foci is constant and equal to vt (R is the distance source-receiver).
Following Singh & Herrmann (1983), for an instant t the observed coda wave amplitude corresponds to the interaction of the primary waves with the scatterers located in the ellipsoid given by the expression (31). Hermann, (1980) proposed a method that allows an estimation of the quality factor Q0 corresponding to each time t. This value is the average quality factor and corresponds to the area included within the ellipse. If the study area is composed of sub-regions, then the following equation can be written:

being, ti the time that the wave spends crossing the region with quality factor Q0i and T is the sum of ti's. This equation represents the attenuation of coda waves for simple scattering.
4.3. Sampled Region
The observed attenuation of coda waves or the elastic disturbances in the ground is a complex process due to a "multiple relaxation" or "multiple scattering" in the heterogeneities of the propagation medium. The influence of the scattering in coda decreases with the order of the interaction, due to the diminution of the energy involved in successive interactions; in this way, the predominant effects in coda are due mainly to the low number of interactions. For this work we are assuming that the first order or "single scattering" represents a reasonably approach for imaging the subsurface.
The average sampled volume can be represented by the average lapse time, given as: tav = tstart + Dtwin/2, where tav is the average of the interval of time for the first order scattering, tstart is the beginning of the interval of time, and Dtwin is the length of the window (Vargas et al., 2004). By using the S-wave velocity v, and associating the ellipsoidal shell volume as function of the time, then the relation between the volume and Qc can be expressed as:

where, VTOTAL is the total sampled volume, and each value of Qc measurement is an average estimated value Qav (or apparent Q) for the sampled volume. VBlock - j are the volume fractions whose true quality factor values are represented by Qj.
If a constant propagation velocity is assumed, then, the process on which the ellipsoidal volume is sampled by one of the rays that leaves from one of the foci, outward away within a lapse of time, and later it is scattered toward the second focus, can be expressed as:

where, the ratio VBlock - j/VTOTAL represents the fraction of the volume associated to the total travel time used in the scattering process during the step along the block of order j. If the process is repeated for each pair station-hypocenter, then the region is sampled enough to assure a reliable inversion. The equation (34) has the form:

where,

This way, it is possible to use a least squares estimation to obtain the values of Qc (xi), in whose case the compact matrix system can be written as:

being, "A" a coefficients matrix (k × n), "X" a vector (n × 1), and "Y" a vector (k × 1), where k is the number of station-hypocenter pairs, and n is the number of parameters to be inversed. A solution of (37) can be obtained by means of the damped least square method (Crosson, 1979). According to this method, the solution matrix [A] and the resolution matrix [R] can be found from the following equations:

4.4. Synthetic test
Following Vargas et al. (2004) several numerical tests were completed in order to evaluate the efficiency of the previous inversion procedure. In effect, it was solved the direct problem for the case of a 2D regular distribution of attenuation anomalies over an area with many well distributed station-epicenter pairs. As it can be seen in Figure 2S(a), http://www.raccefyn.co/index.php/raccefyn/article/downloadSuppFile/184/833, a chess model was implemented by dividing the total area in 8 × 8 equal area sectors. In this case the used values were Qc = 30 and Qc = 90. In order to estimate the inverse problem, a pattern of 500 ellipses distributed randomly were calculated. As it is appreciated in Figure 2S(b), as product of a greater ellipses concentration, the best sampled area is at the center. Then, the associated to Qc or Qav elliptical areas were calculated, related with every hypothetical

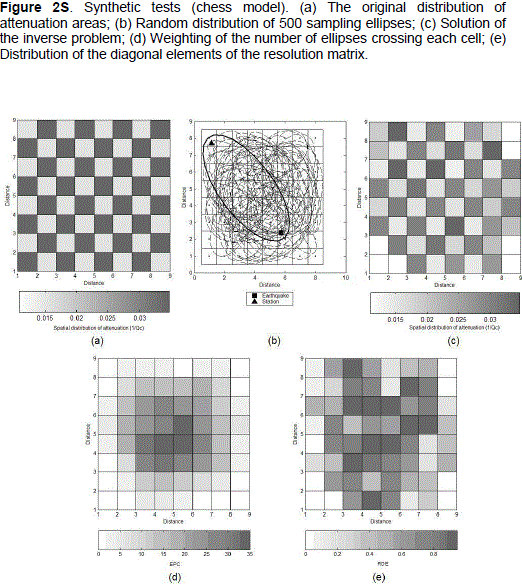
The figures 2S(c), 2S(d) and 2S(e), respectively represent: the inverted model, the number of ellipses per cell (EPC), and the diagonal elements distribution of the resolution matrix (RDE) of the Eq. (39). As we can see, in the cells covered by a large number of ellipses the solution is reliable and the attenuation values are well solved. In the same way, the procedure was extended to a 3D model, similar to the previous chess structure, and with the same attenuation values.
In this case, 2000 pairs of ellipsoidal foci that rea-sonably sample all the volume (Figure 3S(a), http://www.raccefyn.co/index.php/raccefyn/article/downloadSuppFile/184/834) on 8 × 8 × 8 blocks were considered. Although the sampling frame respect to depth is ideal, the procedure suggests that the results are reliable for 3D tomographic procedures (see figures 3S(b) and 3S(c)).
5. Field experiment and data
In order to validate the numerical effectiveness of the tomographic procedure, we designed a field acquisition experiment that was carried out in an area where the subsoil contains "well-known objects", and that defines contrasts of attenuation anomalies. Once analyzed the logistic and operational implications associated with the experiment, it was selected an area on the entrance of the "Boqueron" tunnel. This tunnel that connects the Bogotá and Villavicencio cities presents a slope of 2.6% and its internal coating was built in conventional concrete, on a semicircular projection of radius 9.0 m. Nowadays, this tunnel drives the vehicular traffic flow along 2.4 km by two 3.5 m wide traffic lanes and 0.7 m wide sidewalks. The zone of influence of the experiment is located about 200 m from the tunnel entrance. This entrance is shown in the panoramic photography in Figure 2. The zone where the experiment was developed is located approximately 21 m above the entrance of the tunnel and deployed almost 80 m of horizontal distance from this entry.
5.1. Experimental procedure
Figure 3(a) shows a schematic representation of the field experiment. The design consisted of a line of 30 seismic sensors type DX-20x, oriented E-W (2.0 m of distance between each one). In this experiment a mass of 7.25 kg was used to generate excitations by hammer blows against a steel plate. The hammer's shots were applied on two profiles at both ends of the seismic line: One profile, 40.0 m length to the East, with blows each 4.0 m, and the other profile, 70.0 m length to the West, with blows each 2.0 m.
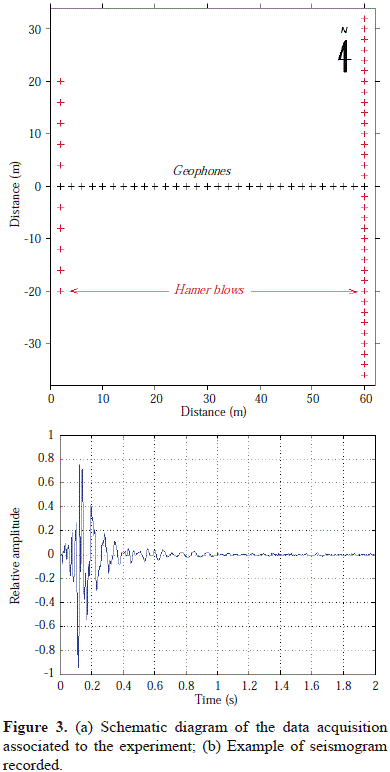
1380 signals were captured of which 1139 were selected and, that by their quality, allowed us to calculate Qc values using the model of Sato (1977), with a time window Dtwin = 1 s. In Figure 1S(b) is presented an example of the processed signal type, for the estimation of the attenuation. To determine the Qc quality factor using the Single Backscattering method (Aki & Chouet, 1975), the following procedure was implemented:
1. Filtering of seismogram. It was applied a bandpass-filter process for each seismogram over the frequency bands 20-40 Hz, in order to detect heterogeneities whose wavelength allowed the tunnel identification.
2. Calculation of the energy from quadratic average amplitudes, for t ± 0.05 s with sliding windows of 0.05 s.
3. Choosing a time window defined by the time from 2(r/v) to 2(r/v) + 1 s, from the excitation's initial time.
4. Adjusting the root mean square (rms) of the amplitudes by using linear regression by least squares. The value of Qc-1 was obtained from the slope of the regression. Only amplitudes greater than two times the background noise level were considered.
5. We considered the Qc-1 values for which the adjustment by using least square shows a coefficient of correlation greater than 0.7. Finally, the frequency dependence law of the coda Q (Qc-1 =Qc-1f-n) was adjusted by using the set of values of Qc-1 found at different frequencies.
5.2. Spatial inversion of Qc
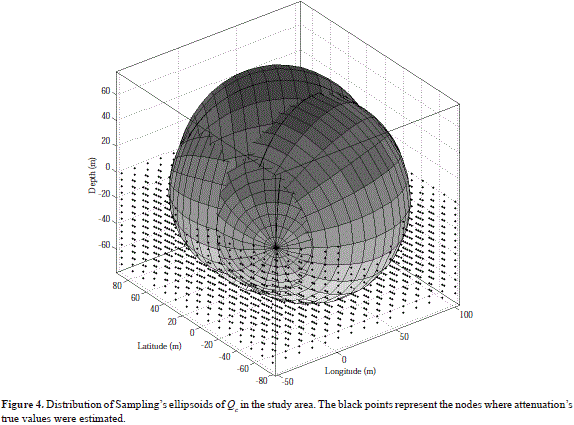
We performed the proposed scheme of spatial inversion by using the equations (32) to (39), and estimating Qc for f = 30 Hz and v = 150 m/s. The velocity (v) was determined by means of a refraction exercise, and the chosen frequency allowed detecting as low wavelengths as 5.0 m. In Figure 3 the space distribution of the sampling ellipsoids is observed. This distribution covers an associated volume of 240 m in N-S direction, 190 m in E-W direction, and 130 m in depth. This volume was discretted in a matrix of 15 × 15 × 15 nodes that involves the cubical region around the tunnel.
6. Discussion
Figure 4 shows the fractions of the ellipsoidal volume that involve the air layer and that were not considered for the spatial inversion. The distribution of mesh nodes associated to the tomography is concentrated in the subsoil. Also we can see that, due to the form and the concentration of the ellipsoids is difficult to perform the sampling at the cube corners.
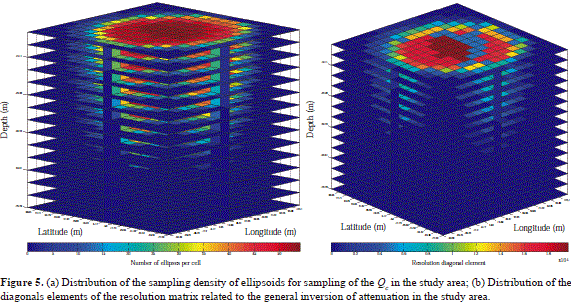
In a similar way to the case of the synthetic tests, in this experiment is possible to confirm that the nodes at depths greater than 55 m do not allow enough collecting information for deducing the distribution of attenuation (Figure 5a). It is generally observed the largest sampling densities toward the center of the analyzed volume, such that in some areas are observed values higher than 50 ellipsoids per cell, whereas toward the periphery it decreases to less than 5 ellipsoids per cell. This situation is closely related to the distribution of the diagonal elements of the resolution matrix (RDE). As shown in Figure 5b, although the solution has low values of RDE (< 10-5), the higher estimates are located toward the center of the study area, and substantially decrease toward the volume's corners that define the cube. Two aspects must be considered: 1) The estimations of RDE at depths greater than 40 m suggests that the inversion's solution has little reliability; and 2) the low values of RDE indicate that the density of inverted nodes is very high with respect to the volume of data available for the tomography.
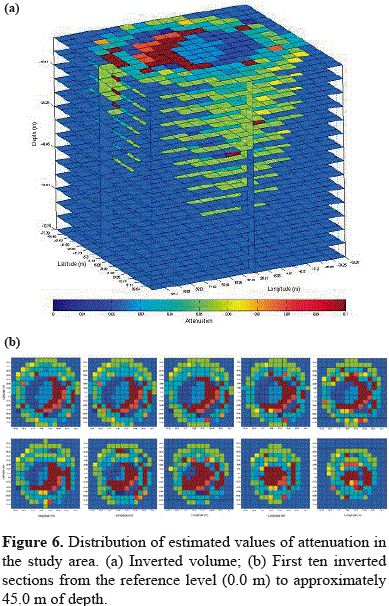
Despite this situation, and in similar way to the synthetic tests, the distribution of anomalies attenuation (Figure 6) allows the estimation of Qc values in the range 10 < Qc < 100 for the areas where number of ellipsoids per cell and RDE are higher. According to the above exposed the most appropriate depth for interpretations are located in the range 0 - 45 m. At west there is a good coincidence between high values of RDE and low values of attenuations with presence of more competent rock (Figure 6). On the other hand, in the east area, the highest attenuation values could correspond to unconsolidated material that was noted during the field activities. In fact, in this region was possible to note the presence of a water outcrop, which is canalized to avoid infiltration problems inside the main works of the tunnel.
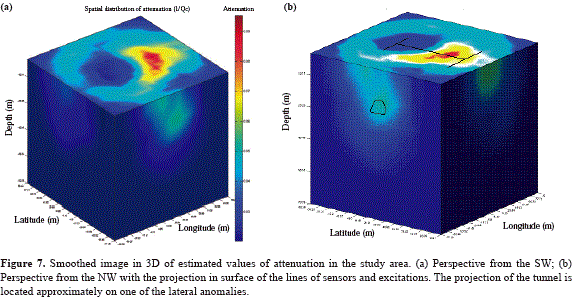
A smoothed image of the estimated attenuation inside the volume analyzed shows that the region where the sensors' lines and excitations were unfolded, covers a region where appears the highest contrasts of attenuation (Figure 7a). Laterally these contrasts allow to detect the presence of a region of high attenuation in the sector where the tunnel runs (Figure 7b). Toward west sector and to depths until 10 m it is possible to identify a region of high attenuation that could be related to a saturated zone due to the presence of water outcrops.
7. Conclusions
In this work we have implemented a procedure for studying the spatial variation of the coda wave's attenuation for surficial exploration purposes. Based on the parameters that govern the estimation of the quality factor Qc as well as its spatial distribution, it was performed a numerical simulation for the spatial inversion of the attenuation inside an regularly discreet area. Several synthetic experiments showed that it is possible to use this procedure to determine tomographic images of 2D and 3D attenuation. This procedure in small scales suggests that may be a useful tool for geotechnical purposes.
The procedure allows a better understanding of attenuation structures of subsoil, as result of the presence of geotechnical anomalies. A field experiment with controlled-geometry in the "Boqueron" tunnel western entry and located in road, which connects the Bogotá and Villavicencio cities, allowed the validation of the method, and found additional information related to the geomechanical behavior of the study area. In general, it was observed that the method was effective despite the low resolution of the inversion.
Whatever the numerical reliability of the method of tomographic inversion based on coda, it is necessary to evaluate its exploratory capability by means of other methods and controlled field experiments. In addition, although the system was conceived in terms of a low cost experiment, some aspects related to the levels of saturation of the signal, the synchronism of the system, the consumption of power, the versatility, among others, must be considered for hardware implementations on future.
Acknowledgments
This work was partially supported by the Universidad Nacional de Colombia, with the Hermes' projects 5965 "Influencia de las propiedades geotécnicas de los macizos rocosos en la propagación y atenuación de ondas sísmicas" and 17186 "Distribución espacial de la microsismicidad en la Sabana de Bogotá y sus altededores, Fase II: Sostenimiento instrumental", as well by COLCIENCIAS under Project "Distribución espacial de la microsismicidad en la Sabana de Bogotá y sus altededores, Fase I: despliegue instrumental - implementación de subred con cinco estaciones", Contract Contrato 201-2006. We also thank to two anonymous reviewers and the Editor-in-Chief of the RACCEFyN, Dr. Elizabeth Castañeda.
Conflict of interests
Authors declare they have none.
Bibliography
Aki, K. (1969). Analysis of seismic coda of local earthquake as scattered waves. J. Geoph. Res., 74, pp. 615-631. [ Links ]
Aki, K. & Chouet, B. (1975). Origin of coda waves: source, attenuation and scattering effects. J. Geoph. Res. 80, pp. 3322-3342. [ Links ]
Carvajal, C. A. & Vargas, C. A. (2001). Respuesta de sitio de ondas coda en Pereira. Revista Horizontes, V. 4, pp. 63-77. [ Links ]
Crosson, R. S. (1976). Crustal structure modeling of earthquake data, 1. Simultaneous Least Squares Estimation of hypocenter and velocity partameters. J. Geophys. Res., 81, pp. 3036-3046. [ Links ]
Dainty, A. M. (1981). A scattering model to explain seismic Q observations in the Lithosphere between 1 and 30 Hz. Geophys Research Letters, 8 (11), pp. 1126-1128. [ Links ]
Durán, J. P., Vargas, C. A. & Briceño, L. A. (2003). Tomografía de CODA-Q del Piedemonte Llanero, Colombia. Revista Geofísica, IPGH UNAM, México: V. 58, No. 2, pp. 81-96. [ Links ]
Herrmann, R. (1980). Q estimates using the coda of local earthquakes. Bull. Seism. Soc. Am. 70, pp. 447-468. [ Links ]
Kumar, N., Parvez, I. A. & Virk, H.S. (2005). Estimation of coda wave attenuation for NW Himalayan region using local earthquakes. Physics of the Earth and Planetary Interiors 151, pp. 243-258. [ Links ]
Lee, W. H., Benett, R. E. & Meagher, K. L. (1972). A method of estimating magnitude of local earthquakes from signal duration. Geol. Survey. Open-File Rep. 28. [ Links ]
Lobo-Guerrero, A. (1992). Geología e Hidrogeología de Santafé de Bogotá y su Sabana. VII Jornadas Geotecnicas de la Ingenieria de Colombia, Bogotá [ Links ].
Londoño, J. M. & Sudo, Y. (2002). A warning model based on temporal changes of coda Q for volcanic activity at Nevado del Ruiz Volcano, Colombia. Bull. Volcanology. 64, pp. 303-315. [ Links ]
Malin, P. E. (1978). A first order scattering solution for modeling lunar and terretrial seismic coda, Ph.D. dissertation, Princeton Universtiy, Princeton New Jersey. [ Links ]
Pujades, L. G., Canas, J. A., Egozque, J. J., Puigvi, M. A., Pous, J., Gallart, J., Lana, X. & Casas, A. (1990). Coda Q distribution in the Iberian Peninsula. Geophys. J. Int., 100, pp. 285-301. [ Links ]
Pulli, J. J. (1984). Attenuation of coda waves in New England. Bull. Seism. Soc. Am., V. 74, pp. 1149-1166. [ Links ]
Rautian, T. & Khalturin, V. (1978). The use of the coda for determination of the earthquake source spectrum. Bull. Seism. Soc. Am. V.68, No.4, pp. 923-948. [ Links ]
Sato, H. (1977). Energy propagation including scattering effects. Single isotropic scattering aproximation. J. Phys. Earth., 25, pp. 27-41. [ Links ]
Singh, S. & Herrmann, R. (1983). Regionalization of crustal Coda Q in the continental United States. J. Geophys. Res., V. 88, B1, pp. 527-538. [ Links ]
Snieder, R. (2006). The theory of coda wave interferometry. Pure and Applied geophysics, V. 163, No. 2, pp. 455-473. [ Links ]
Ugalde, A., Vargas, C. A., Pujades, L. G. & Canas, J. A. (2002). Seismic coda attenuation after the Mw = 6.2 Armenia (Colombia) earthquake of 25 January 1999. J. Geophys. Res. 10, 1029/2001GB000197. [ Links ]
Vargas, C. A. (1999). Atenuación de ondas coda en la región central de los Andes de Colombia-Eje Cafetero. Tesina de Máster en Ingeniería Sísmica y Dinámica Estructural. Universidad Politécnica de Catalunya. [ Links ]
Vargas, C. A., Monsalve, H., Bermúdez, M. L & Cuenca, J. (2001). Utilización de redes neuronales para la determinación de respuestas de sitio a partir de ondas Coda: Aplicación para Armenia, Colombia. Revista Geofísica Colombiana, V. 5, pp. 27-31. [ Links ]
Vargas, C. A. & Cuenca, J. C. (2003). Application of neural networks to obtain the site response in. Mexico city. Geofísica Colombiana, V.7, pp.74-78. [ Links ]
Vargas, C. A., Ugalde, A., Pujades, L. & Canas, J. A. (2004). Spatial variation of coda wave attenuation in Noth-Western Colombia. Geophysical Journal International, V.158, No.2, pp. 609-624. [ Links ]
Vargas, C.A. & Mann, P. (2013). Tearing and Breaking Off of Subducted Slabs as the Result of Collision of the Panama Arc-Indenter with Northwestern South America. Bulletin of the Seismological Society of America, Vol. 103, No. 3, pp. 2025-2046, June 2013, doi: 10.1785/0120120328. [ Links ]
Xie, J. & Mitchell, B. J. (1990). A back projection method for imaging large scale lateral variation in Lg coda Q with application to continental Africa. Geophysical Journal, V. 100, pp. 161-181. [ Links ]


