Servicios Personalizados
Revista
Articulo
Indicadores
-
 Citado por SciELO
 -
 Accesos
Links relacionados
-
 Citado por Google
 -
 Similares en
SciELO
 -
 Similares en Google
Compartir
Revista de la Academia Colombiana de Ciencias Exactas, Físicas y Naturales
versión impresa ISSN 0370-3908
Rev. acad. colomb. cienc. exact. fis. nat. vol.40 no.156 Bogotá jul./set. 2016
https://doi.org/10.18257/raccefyn.333
doi: http://dx.doi.org/10.18257/raccefyn.333
1 Department of Statistics, Universidad Nacional de Colombia, Bogota, Colombia. *Corresponding autor: Jimmy Antonio Corzo, jacorzos@unal.edu.co
2 Department of Basic Sciences, Universidad de La Salle, Bogota, Colombia
Received: 05 de febrero de 2016. Accepted: 05 de agosto de 2016
Abstract
We propose a winsorized adaptive rank test for the location alternative for samples from asymmetric distributions coming from the Generalized Lambda Family. We give a method to calculate the exact conditional distribution, analytic expressions for the asymptotic distribution and for the first two moments of the test statistic. By means of a Monte Carlo study, we show that for various selections of the winsorization parameter, our test is more powerful than the sign test, and than the original test for appropriate choices of the winsorization parameter, from which the proposed test is adapted.
Key words: Location Tests; Winsorized Rank Tests; Power of Rank Tests.
Resumen
Se propone una prueba de rangos adaptativa winsorizada para la alternativa de localización en distribuciones asimétricas que provienen de la Familia Lambda Generalizada. Se da un método para calcular la distribución exacta y expresiones analíticas para la distribución asintótica, y los dos primeros momentos de la estadística de prueba. Por medio de un estudio de Monte Carlo, se muestran que para varias selecciones de parámetros de winsorización la prueba propuesta es más potente que la prueba del signo y que la prueba original para selecciones apropiadas del parámetro de winsorización, de la cual la prueba propuesta fue adaptada.
Palabras clave: Pruebas de Localización; Pruebas de Rangos Winsorizadas; Potencia de Pruebas de Rangos.
Introduction
Let X1, ..., XN be a random sample from a continuous distribution F(x - q) such that F(0) = 1/2 uniquely. Without loss of generality, consider the test problem:

or versus the alternatives q < 0 o q ≠ 0. Under such general conditions on, the sign test is a locally most powerful test for H0 against H1 when the sample distribution is double exponential (Hettmansperger 1984, page 9-12). When the symmetry of F around zero is justifiable, the Wilcoxon signed rank test is preferred, especially when the sampled distribution is logistic (Hajek 1999, page 119). Moreover, more efficient tests can be obtained by including information about the tail weight of the sampled distribution. This class of tests is called winsorized signed rank tests, and they are preferred instead of the Wilcoxon test, choosing a small winsorization parameter when the sampled distribution is close to the normal distribution, and a larger winsorization parameter when it is closer to the double exponential (Hettmansperger 1984, page 92-93). Baklizi 2005, proposed the use of the Wilcoxon scores modified by an exponent which depends on the asymmetry level of the sampled distribution to build a test for location under asymmetry, and showed by means of a simulation study that his test was more powerful than the sign test, than the Wilcoxon test, than the Lemmer 1987 and Lemmer 1993 tests, and than a bootstrap procedure test for samples coming from eight cases of the lognormal distribution.
We mix Baklizi's modification of the Wilcoxon scores with Tukey's winsorization technique to produce a new winsorized adaptive rank test, which becomes more powerful than the Baklizi test for samples coming from distributions with moderate levels of asymmetry obtained from the Generalized Lambda Distribution (GLD) (See appendix, http://www.raccefyn.co/index.php/raccefyn/article/downloadSuppFile/333/1647).
The Proposed Test Statistic and some Properties.
Let çX ç(1) ≤ ... ≤ çX ç(N) be the sequence of ordered absolute values of the sample; define Ri, the rank of çXi ç = çX ç(Ri). Let s(Xi) be the indicator variables:

A general scores statistic is defined by (Hettmansperger 1984):

where f (u), 0 < u < 1, is a nonnegative and nondecreasing function such that 0 < ∫10 f2 (u) du < ∞.
Some known special cases of ¯V are: the sign test (¯S-test) statistic with f (u) = 1, the Winsorized Wilcoxon signed rank test (¯W-test) statistic with f (u) = u, the winsorized signed rank test (¯WW-test) statistic with f (u) = min{u, 1 - g}, 0 < g < 1, where g is the proportion of winsorized observations.
A fourth special case of ¯V is the Baklizi test (¯B-test) statistic which uses the following conditional (on p) score function, f (u) = up, where p is the p-value of a test for the hypothesis of symmetry on F, F(x) = 1 - F(-x), for all xagainst asymmetric alternatives, proposed in Randles, Fligner, Policello and Wolfe 1980, and is an indicator of the asymmetry of F. Note that when papproaches zero, Fshows evidence of asymmetry. Explicitly, the Baklizi test statistic can be written as follows:

The fifth special case of ¯V is the proposed test (¯BW-test) statistic, which uses the conditional (on p) score function:

where 0 < g < 1 corresponds to the proportion of winsorized observations and g(p) plays a similar role as p in the Baklizi test statistic, that is to decrease the contribution to the statistic of large ranks (corresponding to large observations in the tail of asymmetric distributions).
The proposed winsorized test statistics are:

where ¯BW1 will be used for g(p) = p and ¯BW2 for g(p) = √p. When a property is common for the two statistics we will write ¯BW without subscript.
Using Baklizi 2005 notation, let P be the random variable denoting the p-value of the Randles test for symmetry with probability density function f(p). The proposed ¯BW-test rejects H0 in favor of H1 when ¯BW ≥ k where k is determined such that P (¯BW ≥ k çp) = a. The overall size of the test is a because for a fixed g (Baklizi, 2005):

The exact conditional distribution of ¯BW under H0 can be obtained by enumeration as follows: Let Z be a 2N × N matrix containing all possible configurations of ones and zeros assignable to the sample values according to (2.1), obtained by the Cartesian product {0,1}N such that each row corresponds to a different configuration.
The distribution of the vector (S(Xi), ..., S(XN)) is uniform on Z under H0, because X1, ..., XN are independent random variables from a continuous distribution with median zero. For f  as in (2.2), let

be a vector of scores, and denote by z = (z1, ..., zN) a row vector representing a row of Z. The values of ¯BW can be obtained as function of z by ¯BW(z) = zR and so the distribution of ¯BW can be calculated as:

The proposed test statistic has the following properties:
a) f (u) = min{ug(p), 1 - g} ≤ 1 - g; therefore, ∫01 f (u) du < 1 - g and 0 < ∫01 f2 (u) du < 1.
b) From the theory for linear rank statistics the conditional mean and variance, exact and asymptotic, of ¯BW for a given punder H0 are (all results in b) and c) are direct application of Theorem 2.8.1 from Hettmansperger 1984, page 88 for f (u) as defined in a)):
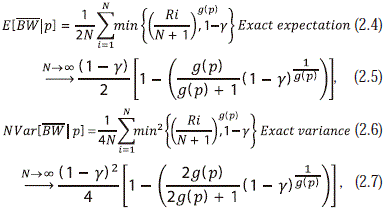
(Details in Appendix A.1, http://www.raccefyn.co/index.php/raccefyn/article/downloadSuppFile/333/1647.)
c) It also holds that

converges to a standard normal distribution.
Monte Carlo Study
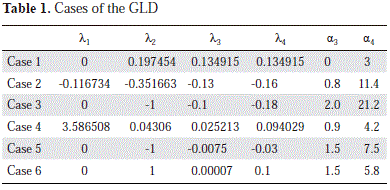
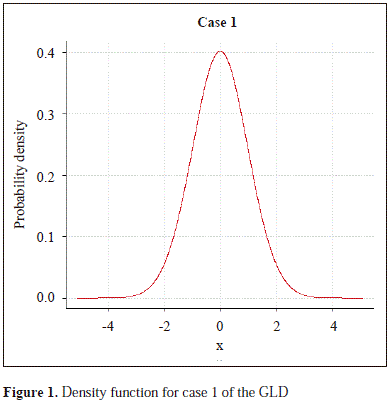
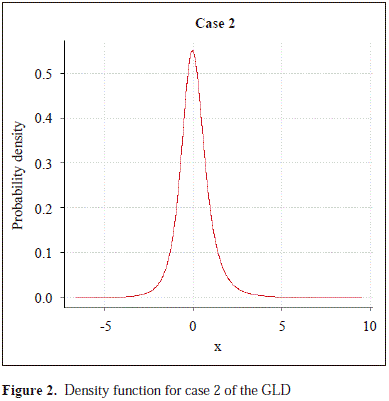
To study the empirical power of the proposed test, we selected five cases of the GLD with a moderate level of asymmetry, and to calibrate the size of the compared tests we selected the normal distribution approximated by the GLD. In Table 1 are shown the parameters of these distributions and the parameters of skewness a3 and kurtosis a4, which show that the sampled distributions are right skewed and have greater kurtosis than the normal distribution. The corresponding densities are in Figures 1, 2, 3, 4, 5 and 6.
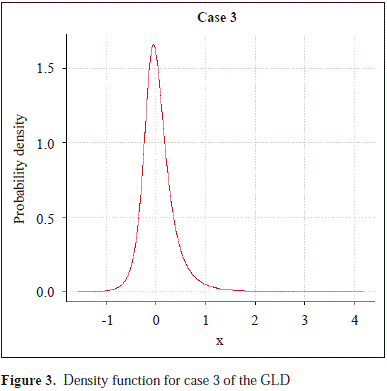
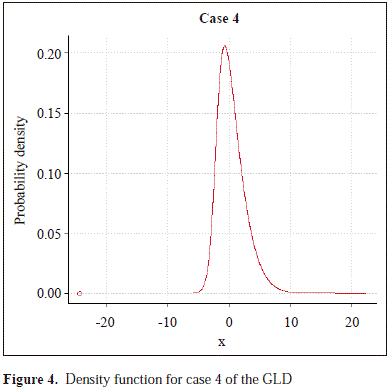
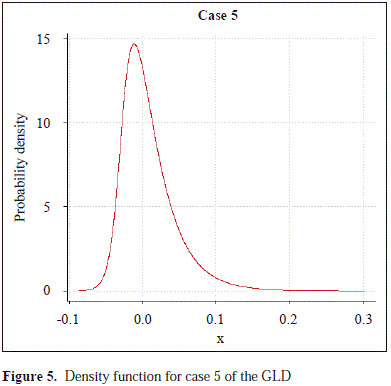
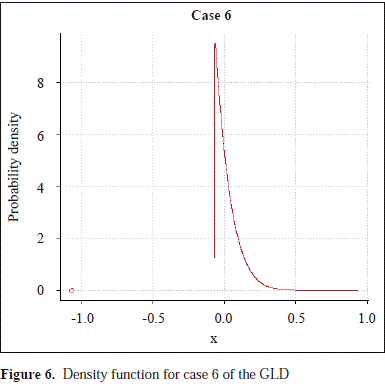
We have compared the ¯S -test, the ¯B-test, the ¯BW1-test and ¯ BW2-test, and we have included the ¯W-test to calibrate the compared tests under the assumption of symmetry of the sampled distribution (case 1). In all cases, we used 0.05 as the significance level. The critical values for all compared tests were obtained from the normal distribution. For the simulation study, we adapted an algorithm to R code from Corzo and Babativa 2013, described as follows: generate a uniform random number u and calculate

To center the simulated observations calculate the median of the GLD as

and then center the data by xi= xi* - q so that x1, ..., xN has zero median.
To calculate the empirical power of the compared tests, 1000 samples of size 30 were selected from each of the GLD cases, and we used the following values of the winsorization parameter: g = 0.1, 0.2, 0.4, 0.6, 0.8. The alternative hypothesis was simulated for values from q = 0 up to q = 1 for the cases two to five, and up to q = 1.2 for the calibration case one, with steps of size 0.2. The values of p were calculated as in Baklizi 2005, from the modified test of Corzo and Babativa 2013.
Table 2 contains the empirical powers of the thirteen compared tests. In the calibration case 1, it can be noted that none of the tests reaches the significance level, excluding ¯BW2 (0.8), and they reach the maximum power for q = 1 or 1.2. Furthermore all ¯BW-test show greater empirical powers than the ¯S -test. Moreover, the ¯BW2 (0.1), and ¯BW2 (0.2), show empirical powers greater than those of the ¯B-test. In cases 2 to 6, the twelve compared tests tend to show an empirical size slightly greater than the nominal size 0.05. However, the empirical sizes of ¯BW1 (0.4), in case 2, ¯BW1 (0.8), in case 3, ¯BW1 (0.6), in cases 4 and 5 are nearer to the nominal size 0.05 than the empirical size of the ¯B-test. Furthermore, for case 6, the empirical size of the ¯BW1-test, for any of the five values of g, are lower or equal to the empirical size of the ¯B-test.
Moreover, the empirical sizes of the tests ¯BW2 (0.1) and ¯BW2 (0.2) in case 2, are slightly lower than that of the ¯B-test, but the empirical power of the ¯BW2-test is greater than the empirical power of the ¯B-test, in both cases. In case 3, the ¯BW1 (0.8), shows an empirical size nearer to the nominal size than the ¯B-test, and its empirical power is very near to that of the ¯B-test. In case 4, the ¯BW2 (0.8) and ¯BW1 (0.6) tests have considerably lower empirical size than the ¯B-test. In case 5, the empirical size of the ¯BW2-test are lower than the empirical size of the ¯B-test; furthermore, the empirical size of the ¯BW1 (0.6) tests is nearer to the nominal size than that of the ¯B, although his empirical power is slightly lower than that of the ¯B. Finally in case 6, the tests ¯BW1 (0.4), ¯BW1 (0.6), ¯BW2 (0.6), and ¯BW2 (0.8), reach the exact nominal size, and their powers are almost equal to the empirical powers of the ¯B-test.
It can be noted also that the power decreases with increasing of the winsorization parameter. This is due to the fact that the more observations are trimmed, the fewer information about the parameter of interest there is in the test statistic. That means, the object of the winsorization is exaggerated at the point that the relevant information about the value of theta is lost.
To implement the test in applications we suggest the following steps:
• Test the symmetry of the data with the runs test by Corzo and Babativa 2013 or some other convenient test for symmetry to obtain the value of p for the test statistic in (2.3).
• Calculate the test statistic for the data.
• Perform the test of H0 in (1.1).
Conclusions and Discussion
In all studied cases there is at least one ¯BW -test with empirical size nearer the nominal size, with greater empirical power than the S test and almost as powerful as the ¯B-test.
In the calibration case, all proposed tests are well behaved in terms of their empirical powers and sizes, to the point that their empirical powers are greater that of the ¯S-test and are very near to the empirical powers of the ¯W-test. Additionally, the ¯BW2 (0.1), and ¯BW2 (0.2) -tests reach better empirical powers than the ¯B-test.
In cases 2 and 3 the empirical power of the test ¯BW2 (0.2), overtakes that of the other tests, in cases 4, 5 and 6 the empirical power of the test ¯BW2 (0.1), overtakes that of the other tests. We recommend the use of the ¯BW1 (0.4) and ¯BW1 (0.8), in cases 2 and 3 respectively. For cases 4, 5 and 6, the suggested tests are the ¯BW2 (0.6).
To discussion, note that, with exception of the ¯S-test in cases 2 and 4 all other compared tests show tendency to be biased, but this tendency is lower for the ¯BW1-test. This can be due to the functional form of g(p), to the used test to select the value of p or to possible dependence between g and p.
A second topic to discuss is for the applications due that when we apply the procedure explained in the last comment of the Monte Carlo study, we are not able to know if the sampled distribution is one of the five cases of the GLD analyzed, and that means that we do not know the empirical power of the location test. To know this is necessary to carry out a similar study as the here done.
Conflicts of interest
The authors declare that they have no conflict of interest.
References
Baklizi, A. 2005. A Continuously Adaptive Rank Test for Shift in Location, Australian & New Zealand Journal of Statistics 47 (2): 203-209. [ Links ]
Corzo, J. and Babativa, G. 2013. A Modified Runs Test for Symmetry, Journal of the Statistical Computation and Simulation 83 (5): 984-991. [ Links ]
Hajek, J. 1999. Theory of Rank Test, 2nd edition, Academic Press, New York. [ Links ]
Hettmansperger, T. 1984. Statistical Inference Based on Ranks, John Wiley & Sons, New York. [ Links ]
Karian, Z. A. and Dudewicz, E. J. 2000. Fitting Statistical Distributions: The Generalized Lambda Distribution and Generalized Bootstrap Methods, CRC Press, Boca Ratón FL. [ Links ]
Lemmer, H. 1987. A Test for the Median, Combining the Sign and the Signed Rank Tests, Comm. Statist. Simulation Comput 16 (4): 621-627. [ Links ]
Lemmer, H. 1993. Adaptive Tests for the Median, IEEE Trans. Reliability 42 (4): 442-448. [ Links ]
Randles, R., Fligner, M., Policello, G. and Wolfe, D. 1980. An Asymptotically Distribution-Free Test for Symmetry versus Asymmetry, Journal of the American Statistics Association 75 (369): 168-172. [ Links ]


