Inglês (pdf)
 Artigo em XML
 Referências do artigo
 Enviar este artigo por email
 Citado por SciELO
  Citado por Google
  Similares em
SciELO
Similares em
SciELO  Similares em Google
 Permalink
Introduction
This paper aims to produce a composite material based on high density polyethylene (HDPE) with different proportions of powdered magnetite (Fe3O4). Such composites have been subject of research because of its economy, its technological applications and also because they are environmentally friendly since some recycled plastic may be used for their production. Composites of this kind are used in different applications such as ferrite cores, electromagnetic shielding, transducers, and in some biomedical applications like drug delivery, organs tagging, etc. To produce this kind of composites fillers in different shapes are used: Particles, fibers or sheets in combination with matrices made of thermoplastic or thermoset polymers. The most common methods used to produce these plastic composites are the blending and cold blending methods. The last method is commonly known for its use with thermoset matrices like epoxy resins while the melt blending method is used with thermoplastic matrices such as the HDPE. In this work, a single screw extruder machine was used to produce the HDPE/magnetite composites following the melt blending method.
During the last decade, many studies have tried to improve the performance of plastic composites for specific applications, adding to the polymeric matrix different kinds of reinforcements like fibers and particulate materials such as silicates, hard and soft ferrites like the magnetite: abundant material, economical and easy to achieve due to the plenty number of mines found throughout Colombia, mainly those that are located in Huila and Cundinamarca. Additionally, the HDPE is one of the most used polymers in the world due to its low cost, ease of processing and good performance, in addition to being known as a reusable thermoplastic. By the addition of silicates, such as montmorillonite some researchers have successfully enhanced the mechanical properties of some polymeric matrices; these composites can be used as building block for constructions (Rosales, et al. , 2006). In other works, the addition of some minerals, like the graphite or magnetite (in different proportions) into the polymeric matrix, have allowed researchers to study the percolative properties of the composite material, these kinds of studies can be useful for the design of technological gadgets: heat sinks or packages for electronic devices with electromagnetic shielding (Panwar, Sachdev & Mehra, 2007;Weidenfeller, Höfer & Schilling, 2002). Although the use of magnetite in thermoplastic and thermoset matrices is relatively new, these composites have been implemented in the biomedical industry: Stents that can be able to change their shape in the presence of magnetic fields (Razzaq, Anhalt, Frormann & Weidenfeller, 2007; Zheng, et al. , 2009). Some polymers like the polymethyl methacrylate filled with magnetite can also be used in pharmaceutical applications including targeted drug delivery, tissue recon-struction and tumor treatments (Hamoudeh, et al. , 2007; Harris, et al. , 2003), primarily because of the low cyto-toxicity of the magnetite (Zhao, Saatchi & Häfeli, 2009; Zhang, Rana, Srivastava & Misra, 2008).
This work is an innovative example that raises the possibility of generating new products and contributions to the materials technology using economical and easily obtainable raw materials or in the case of magnetite to take advantage of an abundant and natural resource in Colombia.
After the samples production through the melt blending method, the crystallinity degree, resistivity, electrical polarization, and magnetization properties were studied. It was expected to achieve a composite with the mechanical properties (low weight and excellent machinability) of the polymers, along with the conductive and ferrimagnetic properties of the magnetite. This composite can be used for transducers, electromagnetic shielding or for the development of biomedical products, using economical and reusable raw materials.
Experimental procedures
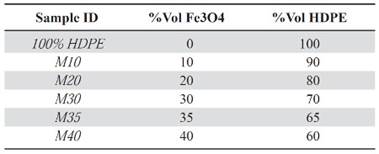
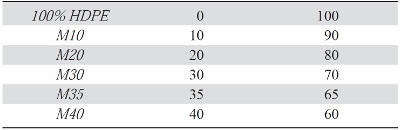
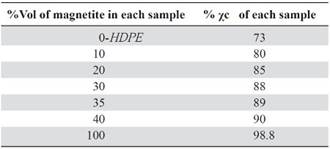
Samples preparation. With the magnetite (Fe3O4), and HDPE density, the samples were prepared with different volume ratios of the precursors, as it is shown in Table 1.
The samples were produced using a single screw extruder machine, with three heating zones and an extrusion rate of 42 rpm. After the extrusion, the samples were cutted using a diamond disk at low speeds. For each sample, two specimens were prepared. Experimentally it was found the extrusion temperatures and times of pure HDPE and the other samples, Table 2. In each case the machine was preheated for 15 minutes. There was a slight increase in the M35 and M40 temperatures and extrusion times, due to the growth of the total material density that flew around the screw and it was associated with higher ratios of magnetite. Hence, through some experimental tests, it was found that as the extrusion temperature raised, the flow rate of the mix is increased.
Measurements. The composites crystallinity degree was studied using the X-ray diffraction (XRD) technique (X’Pert PRO MPD panalytical) with CuKα1 radiation (1.540598Ǻ) in the 2θ range 10-70o, in steps of 0.02o. The semiquantitative analysis of the phases presented in the samples was conducted through the use of X’Pert High Score software version 2.1.2 developed by PANalytical B.V. with the material database 2004 PDF 2.
The morphology of the samples was observed through SEM micrographs (FEI Quanta 200). The volume resistivity measurements were conducted using an Electrometer / High Resistance Meter (Keithley 6517A with the MODEL 8009 test fixture) a bias voltage of 25V was applied during 60 seconds to each sample. The electric polarization measurements were carried out in a ferroelectric tester of Radiant Technologies (model N1P-HVA10-OP110) which uses the Vision Soft-ware version 3.1. These measurements were made with different voltage ranges because the relationship between the increasing ratio of magnetite in the samples and higher conductivity. As a result, the equipment integrity could be affected. The magnetic properties were measured using a vibrating sample magnetometer (VersaLab 3 Tesla, Cryogen-free PPMS of Quantum Design) the variable applied field was ±3 Tesla. Then, applying constant fields of 0.3 Tesla, magnetization and susceptibility measurements as a function of the temperature (50- 300K) were taken.
Results and discussion
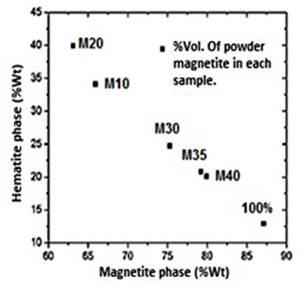
XRD. Prior to the samples synthesis, the different phases that comprise the powder magnetite used in the composites production were semiquantitatively identified. Through the X’Pert HighScore software version 2.1.2, it was found that the magnetite is composed of two different phases: Magnetite and Hematite, with an approximate weight percent of 87.1% and 12.9% respectively, Figure 1. Hematite (Fe2O3) is an iron oxide, with high corrosion resistance, low cost, semiconductor properties, no toxicity, is commonly known as antiferromagnetic materials (Tadić, et al. , 2011), but it is characterized to be chemically more stable than the magnetite. In Natural magnetite ore deposits it is common to find traces of hematite (Otake, Wesolowski, Anovitz, Allard & Ohmoto, 2007). The X ray diffractogram of pure Fe3O4, HDPE, and the composites with different filler ratio content are shown in Figure 2.
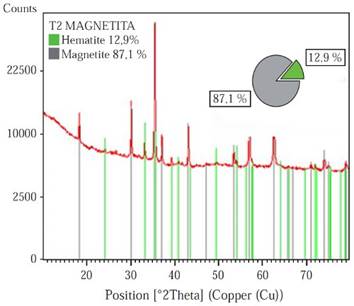
Figure 1 Weight percentage of the phases that compose the magnetite powder used for the samples synthesis.
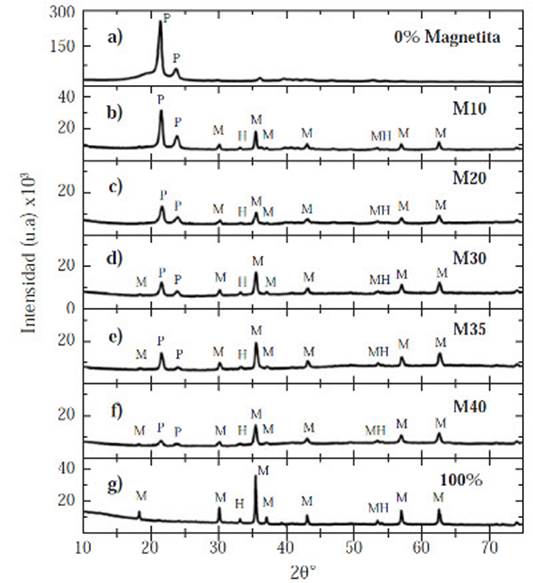
Figure 2 Diffraction patterns for all samples with different volume percentages of magnetite powder b) 10% c) 20% d) 30% e) 35% f) 40%. Diffraction patterns of: a) 100% HDPE, and g) 100% magnetite.
The hematite characteristic reflections are: 24.182°, 33.205°, 35.67°, 39.341°, 40.910°, 50.533°, 54.149°, and 72.065° while the magnetite characteristic reflections are: 18.28°, 30.08°, 35.43°, 37.071°, 43.070°, 53.43°, 56.95°, 62.546°, 70.95°, and 73.992°, Figure 2. The magnetite has a face-centered cubic system, whereas the hematite belongs to a hexagonal crystal system.
Figure 2 shows a steady decrease in the characteristic of the peaks’ intensity of the HDPE located in 21.419° and 23.707° in all samples, as well as the amorphous region (2θ :17°-21°). These peaks reduced dramatically in the M35 and M40 diffractograms (Figure 2e and Figure 2f respectively). Moreover, a gradual increase occurred in the characteristic peaks of the crystalline phases (hematite and magnetite): 33.205°, 35.43°, 37.071°, 43.070°, 56.95°, and 62.546°.
It can be concluded that there was an amorphous-crystalline transition due to the magnetite increasing content. The amorphous region size and characteristic HDPE peaks intensity decreased, while the quantity of crystalline peaks and its intensity increased. This is sustained through the calculation of the crystallinity percent for each sample (χc), Table 4. The HDPE and magnetite never reacted with each other; hence, did not create either a new phase or new peaks, Figure 2.
Table 3 Weight percentages of the phases present in the samples according to the XRD semiquantitative analysis.
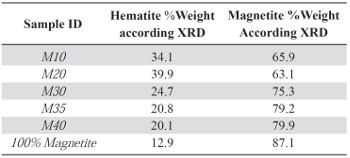
The semiquantitative analysis of each sample showed the variation in weight percentages of the contained phases (hematite and magnetite). This behavior helps to explain the magnetic properties of the composites. Table 3 shows the results for the semiquantitative analysis for each composite.
As it is shown in Table 3, the magnetite and hematite phases are present in all composite samples, since these comprises the magnetite powder used as raw material.
M10 and M20 samples contain a higher hematite weight percentage (34.1%-39.9%), and lower magnetite phase content (65.9%-63.1%), regarding the magnetite powder used as precursor, which has a weight percentage of 12.9% and 87.1% respectively in each phase. This confirms the increasing weight percentage of the hematite phase for the samples with less ratio of magnetite powder, Figure 1S, https://www.raccefyn.co/index.php/raccefyn/article/downloadSuppFile/422/1991. The increased amount of hematite is directly related to the production stage in which several factors such as the weight of the raw materials and the extrusion temperatures, Tables 1-2, can affect the samples properties.
Magnetite to hematite transformation and vice versa is very common in nature because these two minerals are abundant sources of iron in the earth. In rocks where iron oxides are produced, mutual substitution between magnetite and hematite is carried out (Mücke & Cabral, 2005) through redox reactions and hydrothermal reactions in aqueous media (Otake, et al. , 2007). Hematite (Fe2 IIIO3) contains only iron with a FeIII oxidation state (ferric) which makes it stable in the presence of oxygen. On the other hand, magnetite (FeII Fe2 III O4) contains two oxidation states of iron in FeIII and FeII (ferric and ferrous) being more unstable in the presence of oxygen, producing its transformation to hematite through an oxidation reaction, as it is shown in the following equation (Otake, et al. , 2007):
 (1)
(1)The thermal process during the extrusion that induces the magnetite oxidation to hematite is carried out at higher rates in those samples that contain less powdered magnetite (Table 3 and Figure 1S, https://www.raccefyn.co/index.php/raccefyn/article/downloadSuppFile/422/1991). Since a fluid mixture within the extruder (M10 and M20 samples) can reach a more homogeneous heating along the screw during the process; thus, it promotes the powdered magnetite oxidation reaction. In contrast, mixtures with higher ratio of powdered magnetite (M30-M40) are less fluid due to the greater weight of solid material added, and thereby the homogeneous heating is lower.
The XRD technique is frequently used to characterize semicrystalline polymers in order to assess their crystallinity degree, defects and preferential orientations. In semicrystalline polymers two different phases are mainly distinguished: The crystalline and the amorphous phase. Thus, the X-ray diffraction is the simplest technique for measuring the polymeric materials crystalline fraction at room temperature. For the degree of crystallinity determi-nation, numbers of x-ray diffraction methods are reported and practiced. The most common method is the Wide-Angle X-ray Diffraction (WAXD) method and it is used in the present work.
The diffraction pattern of each sample is divided in two zones: Crystalline and amorphous. The intensity of the diffracted beam from crystalline part (Ic) is the area under the sharply resolved peaks, which in this case includes two HDPE main peaks (21.419° and 23.707°), as well as those peaks contributed by the hematite and magnetite phases. The intensity of the diffracted beam from amorphous part (Ia) is the remaining area under curve above background. For all diffraction patterns the amorphous region is given by the HDPE amorphous zone (2θ: 17o -21o). Finally, the %Xc or percent crystallinity is calculated as the ratio between the crystalline peaks area (Ic) in the total area of the diffraction pattern (Ic + Ia) in which the diffracted beam is more intense:
 3.1.1.
To calculate the areas under the peaks of the crystalline region, as the relief of the amorphous region in all samples, Lorentzian functions were used. Crystallinity percentages are shown in Table 4.
SEM. Images of all composite samples were taken, as well as the raw materials in order to assess the material morphology, dispersion and homogeneity of the particulate material into the polymer matrix.
Through SEM images it is not possible to distinguish the morphological differences between hematite and magnetite; both phases are present in the powder used as raw material as it was previously demonstrated by the XRD analysis. Figure 2S, https://www.raccefyn.co/index.php/raccefyn/article/downloadSuppFile/422/1990, shows the magnetite powder which is used as raw material in each composite. This magnetite has high distribution of particles sizes and shapes with low aspect ratio; these results are consistent with the works done by Weidenfeller, et al. , 2002 and Razzaq, et al. , 2007.The aggregates of magnetite particles include large particles sizes (57 μm - 40 μm), medium particles sizes (26 μm - 12 μm), and finally small particle sizes (0.8 μm - 9 μm).
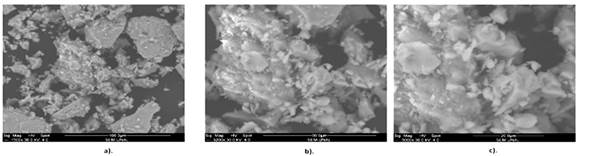
Figures 3 and 4 show micrographs of the composites samples in cross sections; they have different magnitudes (50x - 5000x). The powder crystals are bright and are embedded in an opaque polymer matrix. The filled particles size as well as its shape is not uniform. In Figures 3 and 4 a wide range of particles sizes: Large particles with sizes between 145 μm to 100 μm, medium particles with sizes from 18 μm to 39 μm, and small particles with sizes from 7 to 0.5 μm can be observed. The gap between particles decreases with increasing the filler content and modifying the composite dielectric properties (Weidenfeller, et al. , 2002; Razzaq, et al. , 2007). In Figure 4a for instance, the longest distance between particles in the M20 sample can be greater than 220 μm; although the average of distances between magnetite particles in the M40 sample is about 17 μm (Figure 4c). This suggests an increased interconnectivity of the magnetite particles within the polymeric matrix when the filler content is higher, that can explain the prolonged decrease in the volumetric resistivity for the composites with contents equal or greater than 30 vol% of magnetite powder as it is going to be shown in the next section.
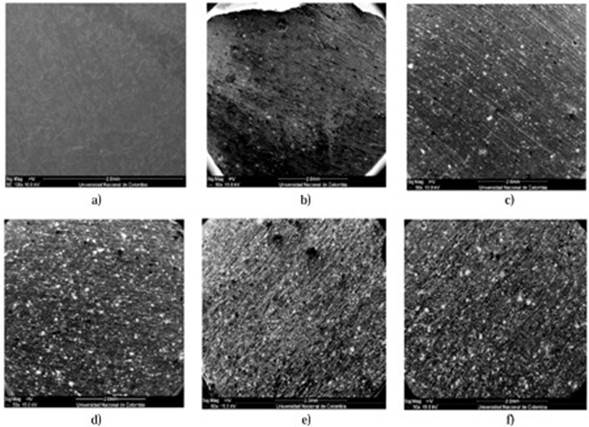
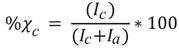
Figure 3 Composites SEM images (50x) with different magnetite ratios in %vol: a) 0% b) 10% c) 20% d) 30% e) 35% f) 40%.
Figure 4 Composites SEM images (5000x) with different magnetite ratios in %vol: a) 20% b) 30% c) 40%.
Volumetric resistivity measurements. As it is shown in Figure 5 the significant drop (eight orders of magnitude 1014 to 106) in the resistivity of composites can be observed between a filler loading of 30 vol% to 40 vol% as was pre-dicted in previous works properties (Panwar, et al. , 2007; Weidenfeller, et al. , 2002; Razzaq, et al. , 2007). In contrast, Figure 5 shows a high-volume resistivity between the pure HDPE samples and the HDPE samples filled with 20 vol% of magnetite, that is an indicative of the insulating polymeric phase and the large distances between particles. The samples resistivity can be affected by some factors like the magnetite particles distribution and its interconnectivity into the HDPE matrix, this is why the samples with a low volume fraction of magnetite (0 vol % - 20 vol%) have a high-volume resistivity, with a low magnetite particles dispersion, so the resistivity is expected to be high and no conductive paths are available between the magnetite particles.
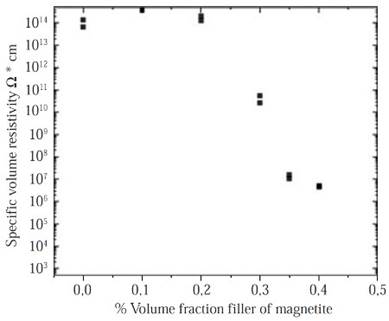
Figure 5 Comparison of the volume resistivity of composites. Samples differ in volume fraction of magnetite particles, and magnetite grades and matrix polymer.
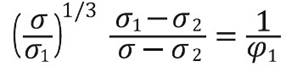
On the other hand, in the samples with the highest filler content (M30-M40) some particles seem to have contacts points among them or are separated only by very small gaps, that produces conducting paths according to the theories of Boettcher (Boettcher, 1952) and Bruggeman (Bruggeman, 1935), this indicates an ideally and homogenous dispersion of the magnetite particles in the polymeric matrix of HDPE. Therefore, charge carriers migrate from one magnetite particle to a neighboring one by hopping or tunneling (Razzaq, et al. , 2007). As the work done by Weidenfeller, et al. , 2002, who studied the thermal and electrical properties of similar composites materials, it is possible to adopt the model formulated by Boettcher and Bruggeman, in order to calculate the theoretical percolation threshold of this kind of composites. According to these, the conductivity σ in a system comprising by two phases: Phase 1 with a conductivity σ1 and a volume fraction φ1, and a phase 2 with a conductivity σ2 and a volume fraction equal to φ2=1-φ1. This can be calculated with the asymmetric Bruggeman equation:
 3.3.1.
For the special case of an ideal conductive phase 1 (σ1 = 1) and an ideal insulator phase 2 (σ2 = 0) the equation above results in a percolation threshold for a phase 1 volume fraction φ1 = 0.33, while for a ratio of conductivities σ1 / σ2 = 300 the percolation threshold is slightly lower with a phase 1 volume fraction of φ1 = 0.31 (Weidenfeller, et al. , 2003; Razzaq, et al. , 2007; Boettcher, 1952; Bruggeman, 1935).
Both theoretical percolation models were consistent with the experimental results obtained in this work, Figure 5, where the decrease in the volumetric resistivity is evident for samples that contain highest magnetite volumes (> 30 %vol).
Electric polarization measurements. The electrical polarization measurements were conducted at room temperature and a triangular wave with a period of 50 ms was used. Figure 6 shows the polarization curves for the pure HDPE sample, and the M10, M30 and M40 samples, respectively.
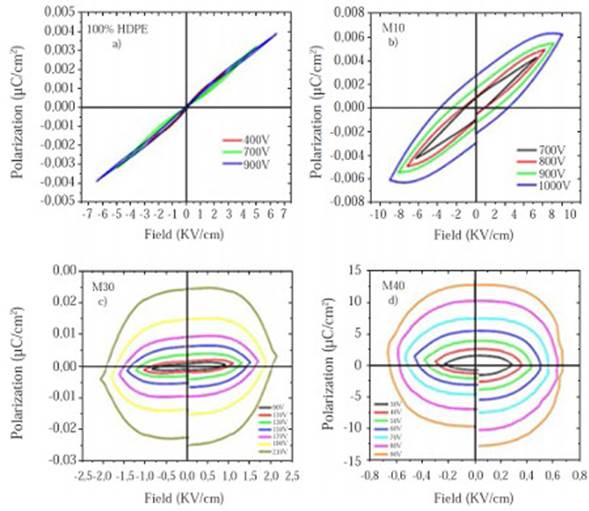
The electrical polarization curve P-E, is a plot of a polarization (P), versus the electric field (E) or voltage (V) applied to the sample at a given frequency. For an ideal linear capacitor, the polarization curve is a straight line whose slope is proportional to the capacitance, since the charge is in phase with the voltage (Stewart & Cain, 1999). For an ideal resistance, the P-E curve is a circle centered at the origin, since the current and voltage are in phase, similar to the M30 and M40 P-E curves, Figures, 6c and 6d. Figure 6 shows how the composite material undergoes a transition going from an insulating material in the M10 sample to a resistive material where the current and voltage are in phase, samples M30 and M40. If these two components are connected in parallel (resistance and linear capacitor), the obtained P-E curve is similar to Figure 6a and 6b, which relates the behavior of a capacitor with losses, where the slope is proportional to the capacitance and the area within the loop is proportional to the device loss tangent. The breakdown voltage of the HDPE will be significantly reduced when the powdered magnetite is added and its capabilities as an insulating material will be affected. That is the reason why as the magnetite percentage increases the polarization rises even in the presence of low magnitude fields, Figures 6c and 6d respectively. As it was seen in the previous section, the dielectric transition behavior matches with the percolation threshold calculated for 33 %vol of magnetite (Boettcher, 1952; Bruggeman, 1935). In the samples with high particle concentrations (< 30%vol) the electrical conductivity and the dielectric losses increased (Ramajo, et al. , 2009). However, this behavior is visible from the sample with 10% by volume of magnetite. The asymmetric behavior of the P-E curves is due to the electrodes asymmetry used in capacitive structure (Salazar, Landínez & Roa, 2009).
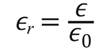
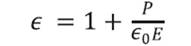
To calculate the dielectric constants of the pure HDPE and M10 samples, the equation 3.4.1. can be used. The permittivity of an insulating, or dielectric, material ϵ; the permittivity of a vacuum, or free space, ϵ0; and their ratio is called the dielectric constant ϵr:
 3.4.1.
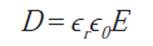
Equation 3.4.2 relates the surface charge density or electric displacement D and the electric field E applied to a dielectric in a capacitor:
 3.4.2.
The equation above could be rewritten using the equation 3.4.1, such that the surface charge density D is written in terms of the material dielectric constant, equation 3.4.3:
 3.4.3.
In the presence of a dielectric material, electric displacement can be represented as a function of the polarization P as it is shown in the Equation 3.4.4. Using the equation 3.4.5 it is possible to find the dielectric constant value of the material as a function of the applied electric field and the polarization as it is shown in equation 3.4.5:
 3.4.4
3.4.4
 3.4.5.
The values of the polarization saturation and the electric field for the different voltages applied to the pure HDPE and M10 samples were used in order to find the average electric constant value (ϵr), Tables 5 and 6. The vacuum permittivity (ϵ0) is a constant value 8.8542 x 10⁻¹² F / m.
Table 5 Dielectric constant value for each voltage used as function of the polarization saturation and the electric field measured for the 100% HDPE sample.
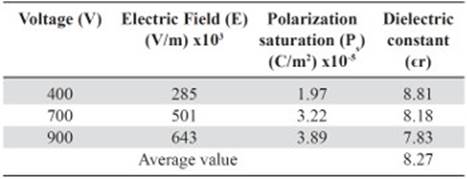
Table 6 Dielectric constant value for each voltage used as function of the polarization saturation and the electric field measured by the M10 sample
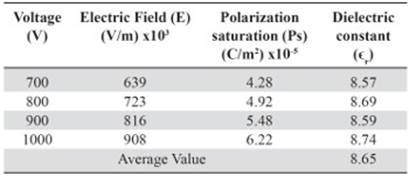
The average dielectric constant calculated for the HDPE sample is above the normal value registered by manufacturers and suppliers. Since the experimental conditions are different, for instance, the measurement frequency used for the HDPE suppliers in many cases to obtain the dielectric constant is 1 MHz, (Matweb, 2014). Resulting in εr values of 2 - 2.5. Whereas the used frequency in this work never got above the 20 Hz. Even so, the calculated dielectric constant value for the samples 100% HDPE and M10 is in the acceptable range of εr at low frequencies for nonconductive plastics such as Bakelite (Meseguer, Gómez, Olmos, Quiles & Romero, 1995). The slight increase in εr between the sample of pure polyethylene and the M10 sample is related to higher polarization values even for the same voltages (Tables 5 and 6). Thus, the addition of powdered magnetite within the plastic matrix allows reaching higher capacitance (C) to the composite.
Magnetization measurements
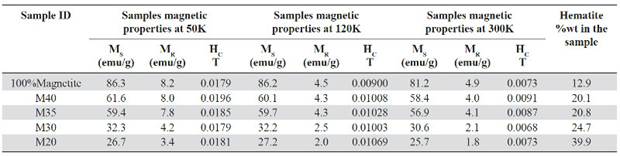
Hysteresis curves taken at different temperatures as a function of the magnetic field. Hysteresis curves for all samples are shown in Figure 7. Their properties like the saturation magnetization (MS), remanent magnetization (MR) and coercively (HC) are shown in Table 7. It is evidenced that for all curves MS and MR decrease as the magnetite proportion decreases within the matrix. These results match with those obtained by (Kong, et al. , 2010; Ramajo, et al. , 2009; Makled, et al. , 2005; Mokhtar, Abdullah & Ahmad, 2012), in which the saturation magnetization and remanent magnetization values increase as the filler percentage by weight or by volume (either magnetite or some other ferrite) increases. Meanwhile, pure magnetite used as a filler has an experimental magnetic moment of 81.22 emu/g which is slightly lower than the stoichiometric magnetite that has a magnetic moment of 90 emu/g at ≈300K (Buschow, 2014). This value is affected by the particle size, flaws in the crystalline structure that favored the spins random arrangement, and therefore, the presence of a dead layer in the particles surface.
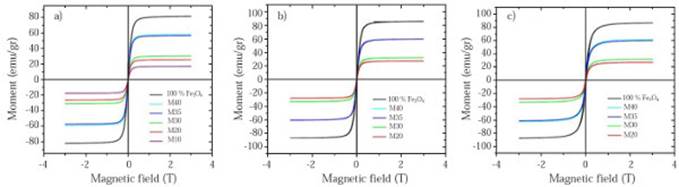
Figure 7 Hysteresis curves taken at different temperatures as a function of magnetic field for each composite sample: a) 300K, b) 120K c) 50K
Table 7 Magnetic properties of the composite samples at different temperatures: Saturation magnetization (MS), remanent magnetization (MR) and coercivity (HC).
In the previously cited works the increase of MS and MR, due to the increase of the powdered magnetite content in the composite samples, is explained through the probable interaction between the magnetic properties of the magnetite particles within the polymeric matrix (Kong, Ahmad, Abdullah & Yusoff, 2009). Also, it is determined that the composite saturation magnetization is linearly dependent of the filler mass fraction following the relationship: MS = MF x WF, where MF and WF are the filler magnetization and the filler weight fraction in the composite (Mackled, et al. , 2005; Mokhtar, et al. , 2012). An aspect to consider in this work and that is not described in previous research that used magnetite as filler in polymeric composites (Weidenfeller, et al. , 2003; Razzaq, et al. , 2007; Ramajo, et al. , 2009), is the presence of the hematite phase in the samples and that can affect the MS and the MR values in the hysteresis curves. The hematite weight content within the composites is variable and is related to the used production process (section 2.2). According to Table 7, the weight percentage of the hematite phase is higher for samples with lower percentage by magnetite volume (10% -30%). Also, this samples exhibit lower MS and MR values for all temperatures. Hematite (Fe2O3) is an iron oxide that crystallizes in a rhombohedral structure and has some particular magnetic properties since although it is classified as an antiferromagnetic material with a Neel temperature (TN = 950-960K), between 263 - 267K, it has a magnetic transformation called Morin transition (TM), temperature at which the material passes to be completely antiferromagnetic to present a weak ferromagnetism (T <TM <TN). Bellow the TM temperature the magnetically arranged spins are oriented along the trigonal axis [1 1 1] (C-axis) of the structure, this causes that the hematite behaves as a uniaxial antiferromagnet. Above the TM the spins are in the basal plane perpendicular to the axis [1 1 1] except for a slight turn of inclination of the spins outside the basal plane, which gives the material a weak ferromagnetic moment (Zysler, et al. , 2001; Stewart, Borzi, Cabanillas , Punte & Mercader, 2003; Mansilla, Zysler, Fiorani, Suber, 2002). This small magnetic moment generated within the hematite structure has an estimated value of 0.0115μB (Robinson, Harrison, McEnroe & Hargraves, 2004) which is small compared to the magnetite 4μB (Thapa, Palkar, Kurup & Malik, 2004), both given as magnetic moments per unit formula (Mpfu).
The composite magnetism is given by the Fe3O4 which contains an additional phase of Fe2O3 as it was demonstrated in the quantitative analysis by XRD (section 3.1), and whose weight percentage is modified by the thermal heating during the samples fabrication process. For the hysteresis curves taken at 120K and 50K (Figures 7b-7c) hematite behaves like an antiferromagnetic material due to the Morin transition and consequently it does not contribute to the samples magnetic moment, but for the test taken at 300K (T> TM) hematite can provide a small magnetic moment (which can be obviated if it is compared to the magnetic moment provided by magnetite) because of the parasite or weak ferromagnetism above the TM.
The coercivity (Hc) behavior is independent of the magnetite reinforcement within the matrix, similar results were presented by Ramajo, et al. , 2009 and Guo, et al. , 2007, and it’s due to the particle size and its random orien-tation (Mokhtar, et al. , 2012). For the hysteresis curves taken at 50K and 120K the value of the coercive field increases in the samples with lower magnetite content (Table 7), indicating that the plastic matrix of HDPE is resistive against the alignment of the magnetic moments of magnetite particles exposed to an external magnetic field (Kong, et al. , 2010). In these samples, the distance between the particles also increased and it reduces their interaction, this is an indicator of the material anisotropy that increases with the HDPE matrix increasing (Kong, et al. , 2009).
Some properties in ferro and ferrimagnetic materials as spontaneous magnetization vary with temperature reaching their maximum at T = 0K, and have a continuous decrease until they reach 0 in TC or Curie temperature. Magnetite TC is 853K, in that point the material becomes completely paramagnetic. According to Figure 7 and Table 7, it is possible to observe the saturation magnetization, remanence magnetization and the coercive field tendency decreasing as the temperature increases (Kong, et al. , 2009; Donescu, et al. , 2012; Demir, Baykal, Sözeri & Topkaya, 2014; Costa, Ballarin, Spegni, Casoli & Gardin, 2012; Gu L, He X & Wu Z, 2014). Using as reference the M40 sample measured at 300K, the parameters MS, MR and HC decrease by 5.2%, 50% and 60% respectively, compared to the same values measured at a 50K. This is caused by the magnetite thermal spin fluctuations that increase at high temperatures.
Contrary to the low dependence of the coercive field HC, relative to the magnetite content in the samples, the HC decreases as the temperature increases (HC50> HC120 > HC300). Table 7 shows a decrease for all samples in the HC values up to an order of magnitude for the measurements taken at 300K relative to the measurements taken at 50K. This remarkable fluctuation in the HC values can be related to the TV temperature (≈120K) where the Verwey transition takes place. Below the TV, the coercivity has much higher values, this is attributed to the discontinuous change in the magnetite anisotropy, going from a symmetrical structural phase as the cubic to a less symmetrical phase like the monoclinic (Bohra, et al. , 2009).
Magnetite is considered a superparamagnetic material at room temperature with zero coercive field strength and remanence magnetization, but with a high saturation magnetization value (Costa, 2012; Demir, et al. , 2014; Gu, et al. , 2014) which makes it desirable for biomedical applications such as targeted drug delivery. This superparamagnetic behavior is partially evidenced by the curves taken at 300K (Figure 7a), which clearly show the reduction in the material hysteresis in response to the applied field with a substantial decrease in the HC and MR values. For instance, at 300K M20 sample, it has a HC and MR value of 0.0073 T and 1.81 emu/g respectively, but at 50K, the same one has a HC value of 0.017 and MR value of 3.42 emu/g.
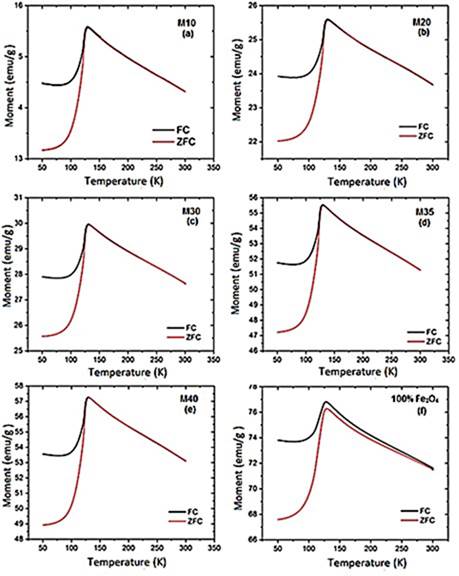
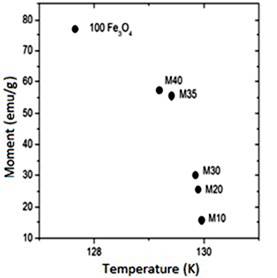
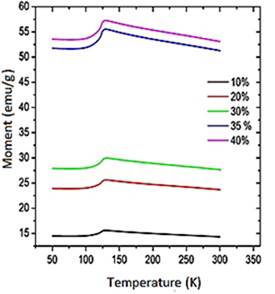
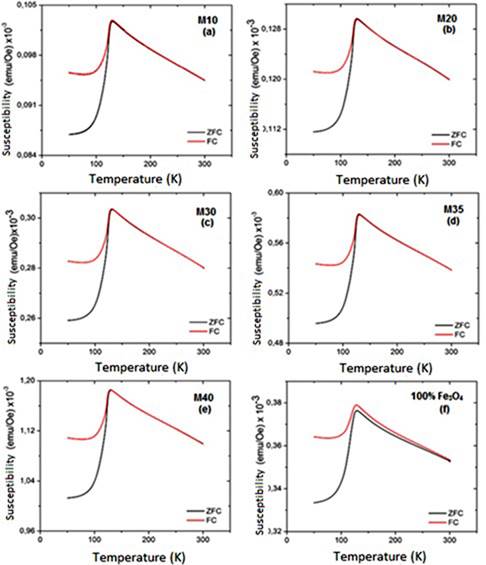
Magnetization and susceptibility curves as a function of the temperature. Figure 3S, https://www.raccefyn.co/index.php/raccefyn/article/downloadSuppFile/422/1992, shows the samples magnetic moment as a function of the temperature (50K - 300K) exposed to a constant magnetic field of 0.3T. An increase in the material magnetic moment increase as the filler content increase within the HDPE matrix as can be seen, it follows the same trend as the hysteresis curves. The pure magnetite has the greatest magnetic moment and the M10 sample has the lowest magnetic moment, Figure 3S, https://www.raccefyn.co/index.php/raccefyn/article/downloadSuppFile/422/1992. The information about the maximum magnetic moment of each sample (M), temperatures (T) at which these maximum take place (normally associated with the Verwey transition), and the maximum volumetric susceptibilities (χV) are summarized in table 8. The depen-dence of magnetization as a function of the temperature for all samples between 50K and 300K under ZFC (zero-field-cooled) and FC (field cooled) conditions, is also showed in Figure 3S, https://www.raccefyn.co/index.php/raccefyn/article/downloadSuppFile/422/1992. During FC measurements, a magnetic field of 0.3 T was applied while the sample was cooled to 50K, then the magnetization was measured while the sample was heated up to 300K. In the ZFC measurements the sample was cooled to 50K without the application of an external magnetic field, and then the magnetization was measured as the temperature increased up to 300K under the influence of a magnetic field of 0.3T. Figure 3S, https://www.raccefyn.co/index.php/raccefyn/article/downloadSuppFile/422/1992, and Table 8 provide relevant information about the composite and magnetite magnetic behavior, before and after the Verwey temperature (TV), which was registered from 119K to 124K (Jackson, Bowles & Banerjee, 2011). This value can be affected by some factors such as the particle size (Thapa, et al. , 2004) or the presence of other phases. The magnetite used in the current study has an irregular particle size (section 3.2) and it contains additional phases as hematite (section 3.1).
Table 8 Magnetic moment and magnetic susceptibility for each sample as a function of the temperature. M is the magnetic moment; χV is the magnetic susceptibility and T the temperature at which the maximum M is reached.
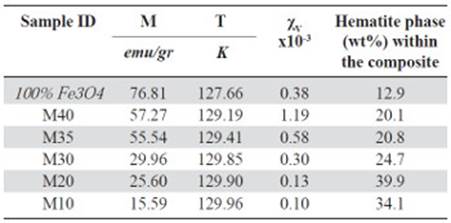
Figure 3S, https://www.raccefyn.co/index.php/raccefyn/article/downloadSuppFile/422/1992, shows how for all samples, the magnetic moment (M) was low at 50K and grew slightly to 100K, then at approximately 120K it increased drastically until it reached its maximum value due to the magnetic domains alignment relative to the external field. The magnetite used as precursor in the samples achieved the maximum magnetic moment at 127.66K, Table 8. The spontaneous reduction in M below the 120K was an indicator of the Verwey transition and was caused by the material structural system transition going from cubic to monoclinic.
Figure 4S, https://www.raccefyn.co/index.php/raccefyn/article/downloadSuppFile/422/1993, and table 8 show how M10-M40 samples achieved the M maximum value at 129K approximately, and it is a result of the irregular particle size (Figure 2S, https://www.raccefyn.co/index.php/raccefyn/article/downloadSuppFile/422/1990), a growing presence of the hematite phase and the resistive effect of the HDPE matrix which hinders the magnetic moments alignment of the magnetite particles exposed to an external magnetic field (Kong, et al. , 2010). After reaching the maximum value, the samples of the magnetic moment began to drop slightly due to the magnetic moments thermal fluctuations until it reached the Curie temperature TC at ≈853K.
The decrease in M vs. T curves for temperatures above the TV has a greater slope in samples with higher content of magnetite (Figure 5S, https://www.raccefyn.co/index.php/raccefyn/article/downloadSuppFile/422/1994), confirming the retarding effect of the HDPE matrix on the magnetic moments alignment. Furthermore, a dramatic growth in the samples magnetization was evidenced, especially for composites with filler contents up to 30% in magnetite volume. Aspect that was clearly related to the insulator-conductor transition in which the composite undergoes at this filler contents, and that was confirmed through polarization and volume resistivity characterizations (sections 3.3 and 3.4). This jump between the samples magnetic moments as a function of the temperature is associated with the increased proliferation and interaction among the particles as the percentage of magnetite increase within the matrix.
Hematite transitions like the Morin transition unlike magnetite Verwey transition is not easily distinguishable in any of the curves since the hematite magnetization is negligible compared to that provided by the magnetite. The temperature at which the ZFC magnetization curve is detached from the FC curve is known as irreversibility temperature. The taken measurements show discrepancies between the ZFC and FC curves at low temperatures until it joins at the point where the material reaches the maximum M value, Figure 3S, https://www.raccefyn.co/index.php/raccefyn/article/downloadSuppFile/422/1992. In the ZFC measures the samples were cooled in absence of an external magnetic field and the interactions between particles were reduced. In addition, the random orientation of the magnetic moments resulted in lower magnetization values, that is why the ZFC curve starts with lower magnetization values, but once the external field is applied and the temperature is increased, it is observed that the magnetization starts to growth because the thermal energy released the spins and it allows them to align with the applied field. On the other hand, when the samples were cooled under the magnetic field influence the particles magnetic moment became stabilized under a preferential orientation between them, and impeded the initial alignment with the external field.
The irreversibility temperature is higher for the pure magnetite sample, Figure 3S-f, https://www.raccefyn.co/index.php/raccefyn/article/downloadSuppFile/422/1992, since the ZFC and FC curves never met among them. Generally, the curves separation at high temperatures is the result of the particles large size distribution (Zhang, et al. , 2001), such is the case of the filler material used in this study. Even though all samples have the same filler with the same large size particles distribution, the proximity of these due to the plastic matrix improves the magnetic dipoles interaction and cooperates with its preferential orientation relative to an applied external field (Kong, et al. , 2009). This close interaction among particles, due to the plastic matrix adhesion, reduces the irreversibility temperature among them, and also promotes the composite magnetization and the magnetic susceptibility.
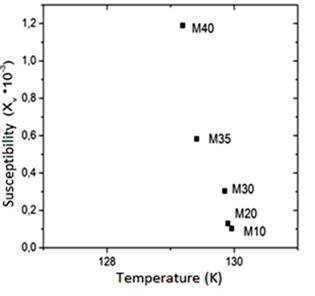
The samples magnetic susceptibility (χ), as a function of the temperature, is shown in the Figure 6S, https://www.raccefyn.co/index.php/raccefyn/article/downloadSuppFile/422/1995, and in the Figure 7S, https://www.raccefyn.co/index.php/raccefyn/article/downloadSuppFile/422/1996. Small and positive values according to the ferrimagnetic materials behavior are observed (10-3). All samples reach the magnetic susceptibility maximum value at 125K approxi-mately and it is attributed to the magnetite Verwey transition (Zhang, et al. , 2001). Like the saturation magnetization, χ is linearly dependent of the magnetite content within the composite.
The drop in the composites susceptibility at low temperatures is related to the magnetic domains decrease within the magnetite due to its structural change into a monoclinic structure. The boundaries domains movement is responsible for the susceptibility signal, for this reason the large decrease in these domains results in the susceptibility drop as a function of time (Tabiś, et al. , 2007).
At the susceptibility, maximum value near to the magnetite TV, each magnetite spin should be parallel to the applied field (blocking temperature). This agrees with previous studies that found that by heating the magnetite through the TV, the magnetic susceptibility may be increased from 20% up to 80% (Carporzen Gilder & Hart, 2006). After reaching the maximum value of χ and below the magnetite Curie temperature, the χ as a temperature function follows the relationship: χ(T) ∝ MS(T)/K(T), where MS is the spontaneous magnetization and K the magnetic anisotropy. Both MS and K(T) decreased as the temperature increased, so when T approaches to TC both of these factors tend to go to 0 (Harrison & Putnis, 1996). For this reason, Figure 6S, https://www.raccefyn.co/index.php/raccefyn/article/downloadSuppFile/422/1995, shows how the curves that represent the magnetic susceptibility, after reaching the maximum value, decrease slightly as the samples are heated. At low temperatures, these two effects cancel and χ remains roughly constant. If K decreases at a faster rate than MS, thermal fluctuations at T close to Tc lead to enhance susceptibility. This is known as the Hopkinson effect. Above Tc, MS. is zero and the material displays only paramagnetic susceptibility, which falls to zero rapidly as χ ∝ 1/(T-TC).
The pure magnetite sample (100% Fe3O4) has the lowest susceptibility value due to factors such as the large particles sizes, wide particles sizes distribution and the lack of interactions between magnetite particles as a result of the no adherence among them. The HDPE plastic matrix within the composites promotes the adhesion and therefore the magnetic dipoles interaction and their orientation to an applied magnetic field (Kong, et al. , 2009).
The χ vs T and the M vs T curves for all samples (Figures 3S, https://www.raccefyn.co/index.php/raccefyn/article/downloadSuppFile/422/1992, 6S, https://www.raccefyn.co/index.php/raccefyn/article/downloadSuppFile/422/1995), followed the same pattern, the composites susceptibility growths as the magnetite proportion added within the plastic matrix increases due to the augmented interaction between particles. Meanwhile Figure 7S, https://www.raccefyn.co/index.php/raccefyn/article/downloadSuppFile/422/1996, evidences how the M10-M30 samples achieve the χ maxi-mum value at higher temperatures than the M35 and M40 samples as a result of the irregular particle size, the hematite phase growing presence and the HDPE plastic matrix resistive effect which impede the magnetic moments alignment to the external applied field (Kong, et al. , 2010).
Conclusions
Become Composite samples with different volume ratios of HDPE and magnetite were produced using a single screw extruder machine with three heating zones. The structural and semiquantitative analysis by XRD of the magnetite used as precursor allowed to detecting an additional phase of hematite with a weight percentage of 12.9%. Moreover, the XRD analysis proved the HDPE high degree of crystallinity. Moreover, the composites XRD analysis showed an increased content of hematite phase due to the magnetite unstable nature which readily react with oxygen to become other phases such as hematite at high temperatures. The XRD semiquantitative analysis showed that the samples with high hematite content were those with magnetite contents less than 30 vol%. Since the material flowability and homogeneity along the extrusion screw is higher allowing greater heat transfer to the powder material that promoting the oxidation reaction. It is also confirmed by XRD that there is no chemical reaction between the filler and the HDPE, but rather a mechanical adhesion of the magnetite particles with the polymer matrix, because the characteristic peaks of each material remain constant in every sample diffractogram. The samples peaks intensity reduction or increase as well as its width determined its crystallinity degree (% χC). It was found that the M10 sample is the sample with the lowest crystallinity and the M40 sample has the highest χC. Thus, the samples crystallinity degree increases as the magnetite increases within the plastic matrix. Morphological characterization carried out by SEM determined that the magnetite used as precursor has different particle sizes with a low aspect ratio. The composites SEM images showed that as the magnetite content increase within the polymeric matrix the particles are closer to each other. This proximity increased the particles interconnectivity being separated only by small gaps in the HDPE matrix affecting the composites electric and magnetic behavior.
Composites hysteresis curves, as a function of the applied field taken at different temperatures, showed how the saturation magnetization (MS), remanence magnetization (MR) were linearly dependent of the magnetite content within the HDPE matrix, due to the interaction between the particles magnetic properties, even though the MR and MS values in the hysteresis curves were also affected by the hematite phase in the samples. M10 and M20 samples which have the highest hematite content showed for all temperatures (50K, 120K and 300K) the MS and MR lowest values. The coercivity (HC) has an independent behavior of the samples magnetite content due to the particle size wide distribution and the magnetic moments random orientation. Regarding the temperature effect on the MS, MR, and HC values, these tend to decrease as the temperature increases, because of the magnetite spins thermal fluctuations, for instance (HC50> HC120> HC300). The HC fluctuations values is related to the magnetite Verwey transition (≈120K), below this temperature the coercivity higher values are attributed to the magnetite discontinuous anisotropy change going from a symmetrical phase like the cubic structure to a less symmetrical phase as the monoclinic phase. The susceptibility curves (χ) as a function of the temperature showed small but positive values according to the ferrimagnetic materials behavior. The magnetic susceptibility is higher at 125K approximately and it is attributed to the magnetite Verwey transition. Like the saturation magnetization, χ is linearly dependent of the magnetite content within the HDPE matrix. The composites susceptibility drops at low temperatures before reaching its maximum values and it’s related to the magnetic domains decrease due to the monoclinic magnetite structure at these temperatures. At the highest point of the susceptibility curve near to the magnetite TV, all the spins that might be aligned parallel to the external applied field were already aligned (blocking temperature). After reaching the susceptibility maximum value and before the magnetite Curie tem-perature, χ depends on the spontaneous magnetization and the magnetic anisotropy, both of the decreases as the temperature increase.
The composites electrical characterizations by electrical polarization and volume resistivity measurements showed the composite insulating-conductive transition as the magnetite content increases. The P-E curves evidenced the change the composite had from being an ideal dielectric material (pure HDPE sample) to be a resistor (M40 sample), Meanwhile, the volume resistivity measurements showed a drop of up to eight orders of magnitude from the pure HDPE sample to the M40 sample. The composites electrical properties may be affected by factors such as the wide particle size distribution and the interconnectivity among them. The low dispersion of particles in the magnetite filled HDPE samples between 0% vol. and 20% vol. can be the reason for its highs resistivity.
The development of this work confirmed that it is possible to produce a composite material with technological perspectives using abundant and mineral raw materials from Colombia which normally are not used for local technical applications. The versatility of the developed composite is such that its own electrical and magnetic properties can fluctuate according to the filler ratio within the polymeric matrix. Thereby, this composite could be used for manufacturing devices where the polymers mechanical properties are required along with variable magnetic and electric characteristics. Materials with these particular specifications are used for transducers, biomedical or electro-magnetic shielding devices production.