English (pdf)
 Article in xml format
 Article references
 Send this article by e-mail
 Cited by SciELO
  Cited by Google
  Similars in
SciELO
Similars in
SciELO  Similars in Google
 Permalink
Introduction
Diameter of nanobubbles is usually less than 10 µm (Prosperetti A., 1982) and their physical properties are unique because they differ from one type of bubble to another, whereby, nanobubbles allows being applied in multiple fields. In recent years the concept of ultrafine bubbles has been introduced, literally meaning extremely small bubbles. In this work, both terms are treated indistinctly. Bubbles with a diameter smaller than 50 µm are compressed by the ions at the gas-liquid interface to a critical diameter, while those having values below their critical diameter increase. As a result of the above, the concentration of ions at the gas-liquid interface, the internal pressure and the system temperature increase, which leads to various types of phenomena. Ultrafine bubbles have been known since 1894, when the violent vibration of the propeller of a high-speed torpedo boat owned to the Royal Navy in test period significantly rusted its surface because the propeller in motion generated a large number of bubbles that completely covered its surface. Also, it was found that the hot water noise in the boilers directly before the boiling point reaches levels in the ultrasound range generated by the microbubbles (Prosperetti A., 1982). Technology based on ultrafine bubble can be applied in several new types of medical treatments (Azevedo A., Etchepare R., Calgaroto S. & Rubio J., 2016) and in the process of concentrating and collapsing ultrafine bubbles where oxygen is activated in the air molecules, forming products such as OH- and O , which has sterilizing properties (Kim J.-G., Yousef A. & Dave S., 1999). Also, nanobubbles are applicable in a wide range of industries, in waste disposal processes (Paraskeva P. & Graham N., 2002), pharmaceuticals and cosmetics (Agarwal A., Ng W. & Liu Y., 2011), hydroponic (Khasnavis S., Jana A., Roy A., Mazumder M., Bhushan B., Wood T., Ghosh S., Watson R. & Pahan K., 2012) and in the food production and filtration systems (Greenstein G. & Tonetti M., 2000). By introducing nanobubbles with oxygen into a determined area, marine bacteria can perform improvements in their waste and reuse process, which results in a biological chain reaction that can significantly increase the biodiversity and population of organisms in the local environment. Furthermore, nanobubble technology can be useful for nature restoration and environmental sustainability projects (Michioku K., Minagawa H., Yamada S., Ikeguchi T. & Ohkawa N., 2012). Other of many applications for nanobubbles, as a microorganism growth agent, is being used in several physical human illness like oesophageal cancer, laryngeal cancer, skin cancer, gum disease, arterial sclerosis, infections, artificial dialysis and diseases like asthma, Alzheimer’s and Parkinson’s disease (Choi S., Yu E., Rabello G., Merlo S., Zemmar A., Walton K.D., Moreno H., Moreira J.E., Sugimori M. & Llinás R.R., 2014). Since applications depends on each property, in the present work, characterization of nanobubbles is carried out in a saline solution, with the main interest to analyze the size and stability as a function of different parameters such as temperature, time of revolution (energy supplied to the system), evolution time, solution concentration, pH and ζ potential.
Experimental setup
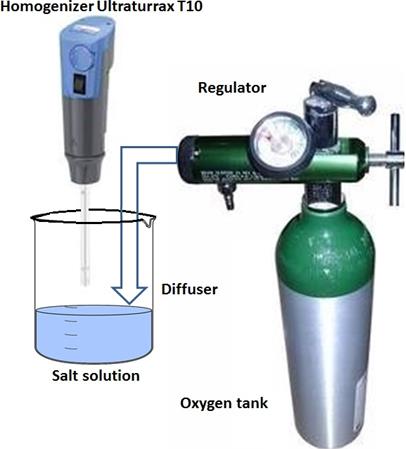
The production of the nanobubbles was carried out through an oxygen tank with regulator, a bicker, an Ultraturrax T10 homogeniser and a ceramic diffuser, as shown in Figure 1S, https://www.raccefyn.co/index.php/raccefyn/article/downloadSuppFile/543/2569.
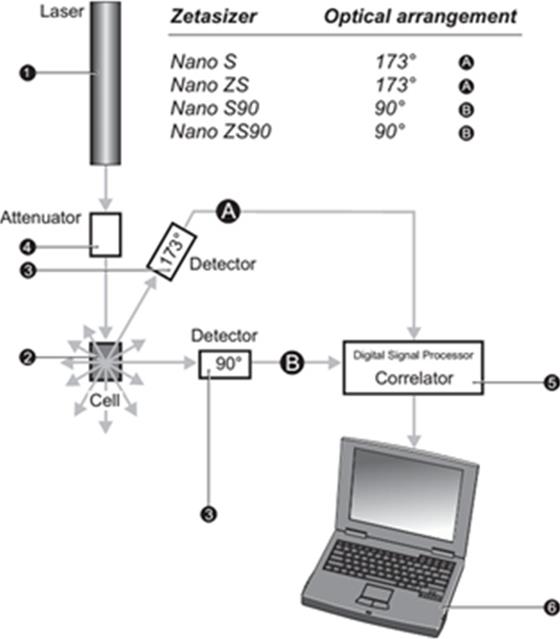
The experimental measurements were made using a Zetasizer Nano ZS that performs the analyses of samples via processes of dynamic light scattering. This device allows measurements of both molecular and particle size. It also has a potential ζ analyser, which uses the electrophoretic light scattering of particles, molecules and surfaces. Finally, it contains a molecular mass analyser by means of static light scattering. In addition, it has the option of micro-rheology to measure the viscosity of the sample and viscoelastic properties, as well as the option of measuring protein mobility. The Zetasizer Nano ZS has three techniques in a single unit and a variety of options and accessories to optimize and simplify the measurement of different types of samples (Malvern Instruments Ltd., 2004). Dynamic light scattering is used to measure the size of particles and molecules. This technique measures the particles in diffusion that move under Brownian motion and converts this measure to the size and distribution of the dimensions using the Stokes-Einstein relation. Doppler laser microelectrophoresis is used for potential ζ measurements. External electric field is applied to a dispersion of particles whose speed will be related to its potential. This velocity is measured by a patented laser interferometric technique named M3 (PALS light scattering with phase analysis). Thus it is possible to calculate the electrophoretic mobility, which serves as a starting point in obtaining the potential ζ. Static light scattering is used to determine molecular weight in proteins and polymers. In this technique the dispersion intensity measures the samples at different concentrations in order to create a Debye graph. Thereafter, it is possible to calculate the average molecular weight and the second virial coefficient, which provides a measure of the solubility of the molecules. The experimental setup used by the Zetasizer Nano ZS is shown in Figure 2S, https://www.raccefyn.co/index.php/raccefyn/article/downloadSuppFile/543/2570.
In the assembly of figure 2S, a laser 1 is used to pro- vide a light source for illuminating the sample particles within the cell 2. Most part of the laser beam passes directly through the sample, remaining part is dispersed by the particles within the sample. Detector 3 is used to measure the intensity of the scattered light. Since light is dispersed by these particles in all directions, it is possible any random setting of the detector. With the Zetasizer Nano series, depending on the particular model, position of the detector will be anywhere at 173° or 90°. Intensity of the scattered light must be within a specific range for the right operation of the detector. If excess light is detected then the detector will be overloaded. To overcome this an attenuator 4 is used to reduce the intensity of the laser and therefore reduce the intensity of the dispersion. For samples that disperse low light, such as very small particles or samples of low concentration, the amount of scattered light must be increased. In this situation, the attenuator will allow more laser light through the sample. For samples that disperse more light, such as large particles or samples of higher concentration, the amount of scattered light must be decreased. This is achieved by using the attenuator to reduce the amount of laser light passing through the sample. The Zetasizer determines the proper position of the attenuator during the measurement sequence automatically. The scatter intensity signal for the detector is transferred to a digital signal processing plate called correlator 5. The correlator compares the scattering intensity at successive time intervals to derive the rate at which the intensity is variable. The correlator information is then transferred to computer 6, where software specialist Zetasizer will analyze the data and obtain the information.
Theoretical requirements
Dynamic light scattering. This technique is also known as photon correlation spectroscopy and is currently one of the most popular methods used to determine particle size. A monochromatic light beam, such as a laser, on a solution with spherical particles in the Brownian motion causes a Doppler shift when the light reaches the moving particle, changing the wavelength of the incoming light. This change is related to the size of the particle. It is possible to calculate the sphere size distribution and give a description of the movement of the particle in the medium, by measuring the diffusion coefficient of the particle and the use of the autocorrelation function (Schmitz J.-G., 1990).
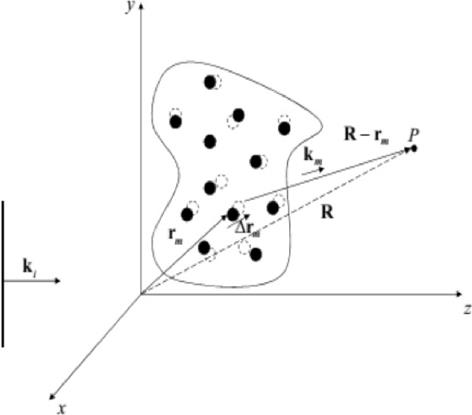
Temporal first order autocorrelation function. Dynamic light scattering (DLS) studies properties of dynamic and non-homogeneous media. A generic situation is illustrated in Figure 3S, https://www.raccefyn.co/index.php/raccefyn/article/downloadSuppFile/543/2571, where a flat wave is dispersed in a randomly moving particle system. In that figure, R is the position vector from P, with the fluctuating dispersion position r m (t) along the direction R- r m (t).
For the weak dispersion media, the problem can be described by the Born approximation. If we consider the dispersion medium as a discrete and positions of particles fluctuate over time, we can define a dynamic dispersion potential as a collection of point scatters given by a function
F(r,t)
with amplitude f
o
, which represents the dispersion potential of a single particle, and phase  , where the sum extends to all particles. The variable t is due to the fluctuations of the particles around their positions and should not be confused with the reciprocal variable of frequency in optics ω. The dispersion potential lies in the frequency domain
F(r, ω)
; then, for simplicity, the explicit argument ω is ignored. The dynamic scattering amplitude is given by the Fourier transform of this function,
, where the sum extends to all particles. The variable t is due to the fluctuations of the particles around their positions and should not be confused with the reciprocal variable of frequency in optics ω. The dispersion potential lies in the frequency domain
F(r, ω)
; then, for simplicity, the explicit argument ω is ignored. The dynamic scattering amplitude is given by the Fourier transform of this function,
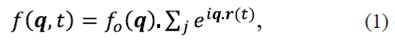
Where q= k s - k j . The dynamic signal is originated by the overlap of dispersed fields with fluctuating phases. To characterize these fluctuations the temporal autocorrelation of the dispersed field along K s can be calculated by using
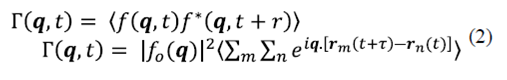
In equation (2) Γ represents the first order correlation function, which must be distinguished from the correlation intensity, and ⟨ ⟩ denotes average time that is given by 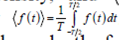 . It is assumed that the particles move independently from each other. It is valid for a dispersed distribution of particles. Under these circumstances the correlations between the displacements of different particles fade, therefore

Combining equations (2) and (3), gives

Where 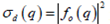 the differential cross-section associated with a single particle and N is is the total number of particles in the dispersion volume (Schmitz J.-G., 1990).
It is considered that all the terms of the sum are equal, i.e., all particles are governed by the same statistics. Temporal autocorrelation Γ is normalized to give
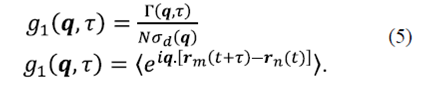
Here, g1 is the first order correlation function.
Second order correlation function (Siegert relation). In practice, only dispersed intensity is accessed along the direction ks . The measurable physical variable is the autocorrelation intensity function that is defined as
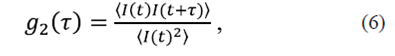
Where

The double sum is applied to the assembly on the set of scattered fields. Combining equations (6) and (7), we have
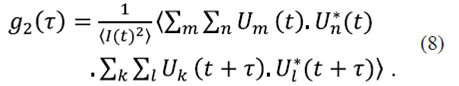
In equation (8), two different contributions appears: for m=n=k=l, the sum results  ; for the case m=l, n=k and m≠n, terms are obtained with the form
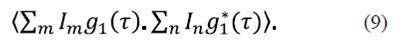
Because the particles are dispersed independently of one another, all other terms vanish. Hence, equation (8) becomes

Simplifying,

This result connects the second and first order correlation functions and is known as the Siegert relation. To evaluate the average  , being Δ
r
the displacement of a single particle, information about the physical phenomenon that generates fluctuations in the particle positions is required. This gives the probability density of the displacement to evaluate the average.
, being Δ
r
the displacement of a single particle, information about the physical phenomenon that generates fluctuations in the particle positions is required. This gives the probability density of the displacement to evaluate the average.
Assuming that this probability density is ψ(r,t) , the average interest can be calculated as an average of the assemblage,

The average is nothing other than the 3D spatial Fourier transform of the probability density
ψ(r,t)
. In the next section we determine
ψ(r,t)
and the mean  for diffusion particles, which is a situation widely found in practice.
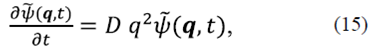
Particles under Brownian motion. For fluctuating particles in thermal equilibrium under Brownian motion, the probability density associated with a particle at position r and time t undergoes the homogeneous diffusion process given by equation
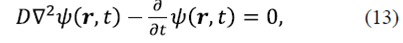
where D is the diffusion coefficient for a spherical particle of radius a is given by the Stokes-Einstein equation (Schmitz J.-G., 1990),
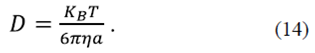
Here, K B =1,38x10 -23 J/K is the Boltzmann constant, T=298°K is the room temperature, and η represents the viscosity of the fluid at room temperature. Taking the spatial Fourier transform of equation (13), we obtain
where the solution is
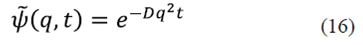
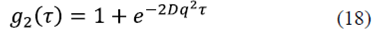
From equations (5), (13) and (16) we have that the firstorder correlation function for a particle under Brownian motion is of the form

Equation (17) is commonly used in dynamic light scattering. It is established by measurements that 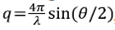 , for a fixed scattering angle θ, where the correlation function has a characteristic time given by
  . For higher dispersion angle, it becomes the diffusion coefficient; for shorter dispersion angle, it becomes the correlation time τo.
For example, a particle with diameter of 1 μm, suspended in water at room temperature, will have a characteristic τ o=2.5 ms. Experimentally, we have direct access to the second-order correlation function and, using the Siegert relation, information about the diffusion coefficient can be obtained through
where, the correlation time approaches to the form
which relates the correlation time to the radius of the particles.
Results and discussion
Because one of the main applications is related to medicine, the characterization was performed considering the ranges in which a solution can be administered intravenously to humans. For this reason studies were conducted in the ranges in which water or 0.9% NaCl saline can be injected into a human (United States Pharmacopeia, 2012). Likewise, the different pH values were established in the range of 5 to 7. The pH was changed through an electrochemical process, based on the protocol of Kikuchi et al (Kikuchi K., Takeda H., Rabolt B., Okaya T., Ogumi Z., Saihara Y. & Noguchi H., 2001), according to which the electrical decomposition of water is carried out in an electrolytic cell divided by an ion exchange membrane or diaphragm in compartments of an anode and a platinum cathode. Although theoretically the minimum voltage necessary to decompose the water is 1.23 V at 25 °C, in our case the application of 1.73 V was necessary. The elevation of the pH took place through the control of the cathodic reaction, in which the addition of electrons breaks the water molecules, giving rise to H2 ions and OH- anions. The study was performed at storage temperatures of 25 °C and 4 °C, because they are temperatures in which solutions are normally stored. It should be noted that the temperature from 4 °C to 1 atm pressure is the temperature at which the liquid water shows its highest density, which, as we will see in the development of the work, will help to stabilize the nanobubbles. Finally, a filtration study was carried out, emulating the process that occurs in the lungs, which constitute a natural filter of living beings. It is indicated that no surfactant (detergent) was added to generate stability to the nanobubbles, since these can be dangerous when supplied intravenously.
For the filtration of the different solutions, 100 nm filters were the smallest ones used, since the DLS does not distinguish between a particle and a bubble. Then the first study was carried out in distilled and deionized water, supplying oxygen between 0.5-1 L/s to water for the creation of nanobubbles in a cavitation process of Ultrasound, through a Sonicator (Qsonica Q125), with diffusion in porous medium (ceramic material) and rotation by means a Homogenizer (Ika Ultraturrax T10), in regimes of 8000-30000 rpm and at different exposure times. In addition, a combination of all of the aforementioned cavitative processes was performed, none of which gave appreciable results in the range of the nanobubbles. In addition, a combination of all of the aforementioned cavitative processes was performed, none of which gave appreciable results in the range of the nanobubbles (Khasnavis S., Jana A., Roy A., Mazumder M., Bhushan B., Wood T., Ghosh S., Watson R. & Pahan K., 2012). Subsequently, the same study was performed with a 0,9% NaCl saline solution using the above processes, finding bubbles of nanometric sizes. The nanobubbles were obtained with a combination of diffusion and rotation by determining the speed limit for which the highest density of bubbles per unit volume (more than 106 bubbles/mL) was obtained. Once the nanobubbles were found the procedure was configured with a supply of 1,0 L/s of oxygen. The speed of creation of the nanobubbles was 30000 rpm for volumes of 500 mL with exposures of rotation of 1-7 min. Initially, the creation of nanobubbles was attempted, by means of an ultrasonic process with the sonicator. The goal was to obtain nanobubbles from the order of microns or larger, which are generated through the rotating medium. However, this method was discarded because of rotation process generated the expected nanobubbles but the application of the ultrasound eliminated them.
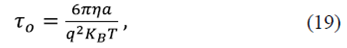
In the analysis, the first relation treated was the evolution of the nanobubble diameter as a function of time. It consists in measuring the size of the nanobubbles at different evolution times: 1, 2, 3, 24 and 192 hours. The measurement was performed at a temperature of 25 oC, which is standard for most of the tests, except when analyzing the behavior against a temperature change.
The objective of this measurement was to observe the evolution of the diameter for the first hours of creation and in the long term. As we expected from the nucleation theory (model by which the critical diameter of the bubbles can be established, from which they lose their stability), a critical diameter was found to exist (Fang C-K., Ko H-C., Yang C-W., Lu Y-H., Hwang I-S., 2016). This can be seen in Figure 1, whose graph fits to an exponential curve that tends to a constant value that corresponds to the critical diameter. The result is performed for a pH = 5. For other pHs the trend of the curve was similar.
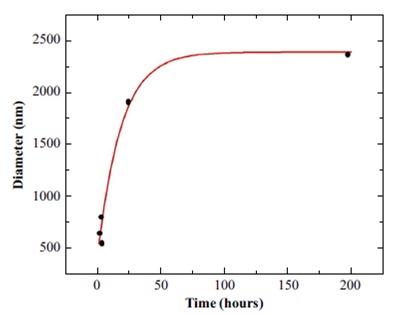
Figure 1 Experimental data of nanobubble diameter as a function of time, for a salt solution with pH=5 and 3 min of revolution time.
The critical diameter as a function of the revolution time of the Ultraturrax T10 equipment was also analyzed for a speed of 30000 rpm. It is observed that the critical diameter is maintained in a range between 1000 and 2000 nm. In Figure 2 this result is exemplified for a pH = 5 but the results were essentially identical when other pHs were considered.
Figure 2 Critical diameter of nanobubbles as a function of revolution time for a salt solution with pH=5.
Measure of the nanobubbles diameter as a function of the time of revolution was carried out, at a time of evolution of 1 hour, maintaining the pH invariant. For each time of revolution, 5 measurements were taken in order to calculate an average value and a standard deviation. Results are shown in Figure 3 for three different pHs, 7, 6 and 5. Here we have a linear trend between the diameter and the energy supplied to the system (time of revolution), and occurs for all the studied pHs. This apparently linear behavior is due to the small ranges of revolution time. On the other hand, from the correlation coefficients of the adjustments, it is clear in Figure 3 that the tendency to a linear behavior is more evident for the higher pH values.
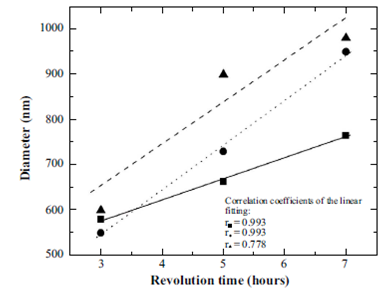
Figure 3 Diameter of nanobubbles as a function of revolution time at 25 ºC, evolution time 1 hour and pHs of 5 (triangles and dashed line), 6 (squares and continuous line) and 7 (circles and dots line).
Next, the diameter of nanobubbles was measured as a function of pH for a time of evolution of 1 hour. The revolution time for the measurement exemplified in Figure 4a was 3 minutes (for other revolution times the result was similar).
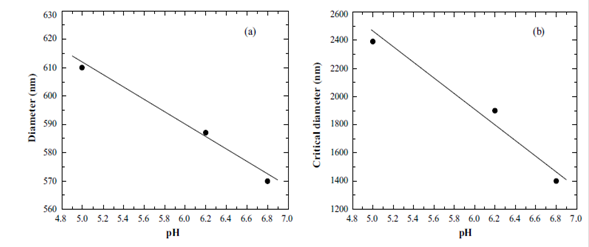
Figure 4 (a) Diameter of nanobubbles as a function of pH, for revolution time of 3 min at 25 oC, 1 hour evolution time and (b) Critical diameter as a function of pH at 25 o C and revolution time 3 min.
From this result it can be concluded that the diameter of the nanobubbles presents behavior with a negative slope of -21.835, i.e., it decreases very slowly. This result was expected from previously reported measurements, for which the pH does not affect substantially (Azevedo A., Etchepare R., Calgaroto S. & Rubio J., 2016).
Measurements of critical diameter as a function of pH are shown in Figure 4b for revolution time of 3 min. It was found that the critical diameter decreases linearly respect to the pH. As we predicted regarding the revolution time, the linear behavior may be due to the small range of pH values.
Following suggestions of literature [Khasnavis S., Jana A., Roy A., Mazumder M., Bhushan B., Wood T., Ghosh S., Watson R. & Pahan K., 2012;Kirby B., 2010], the temperature value was modified to 4 ºC and the diameter was measured as a function of time for the pH values 5, 6 and 7, considering a revolution time of 3 min. It was also observed at room temperature, the diameter remains approximately constant for any evolution time, as shown in Figure 5.
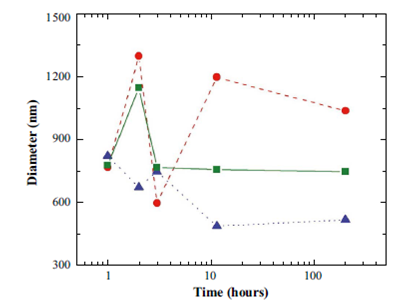
Figure 5 Measures of diameter as a function of time at 4 o C, for the pH values 5 (circles), 6 (tringles) and 7 (squares), with a revolution time of 3 min.
Analyzing the deviation of the measurements taken can be noted for the pH of 5 the dynamicity of the process is high, but the system tends to stabilize at higher pHs. From the Figure 5 it is clear that the particular value of pH = 7 is quite stable at T=4 o C. On the other hand, the diameter as a function of revolution time is more stable for the highest evolution times, above t=24 hours, compared to the first 3 hours.
A measurement of great interest in the processes related to nanobubbles corresponds to the analysis of the potential ζ, since this gives a measure of the stability of nanoparticles. In the literature it is found that the particles are more stable for potentials with magnitudes greater than 20 mV (Kirby B., 2010). The potential was measured as a function of the evolution time for two pH values (6 and 7), as is shown in the Figure 6. The two curves show that the potential is constant during the last 24 hours. This independence of time agrees with other reports (Wu C., Nesset K., Masliyah J. & Xu Z., 2012;Kirby B., 2010). Values for the potential ζ as a function of pH are shown in Table 1. It can be seen how the magnitude of the potential increases as the pH becomes higher. This result corroborates that the stability of nanobubbles improves with increasing pH.
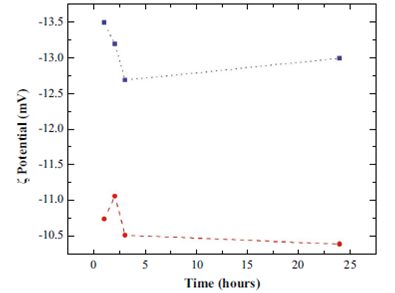
Figure 6 Results of measurements of potential ζ as a function of evolution time by considering two pH values, 6 (circles) and 7 (squares).
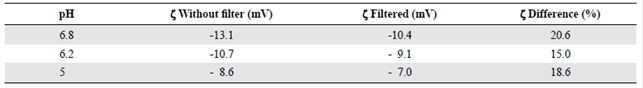
In order to emulate the filtration process that occurs in organs of living organisms such as the lung, a 1 μm filter was applied to the solution with nanobubbles and the potential ζ was measured as a function of time for different pH values. In Table 1 it can be seen that the effect of the filter is a decrease between 14-20% of the ζ potential values. This result suggests that the stability of the bubbles is greater for the higher pH value and diminishes when the pH is decreased. Similarly, the effect of filtering affects the stability of the bubbles, which could limit biomedical application in the transport of substances through organic membranes. However, this limitation is controllable through potential monitoring.
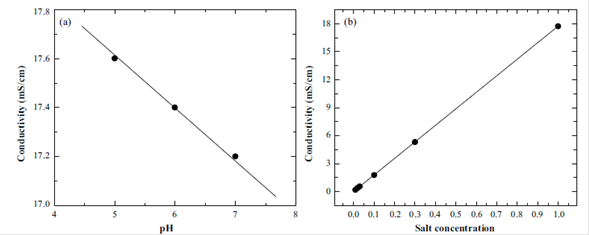
With the objective of determining the concentration of the solution at different pH values, a conductivity measurement was performed as a function of pH at room temperature, as shown in Figure 7a, with conductivity values between 17,22 and 17,59 mS/cm (mS=1/mΩ) for 5, 6 and 7 pH values. From this result the graph of the conductivity as a function of the concentration was elaborated as is shown in the Figure 7b, where it is clear that the conductivity response grows linearly with the salt concentration in the solution. From the linearization of the data we obtained that the concentration of the solution is between 0,90-0,99 %.
Conclusions
It is possible to obtain nanobubbles in a NaCl solution from diffusion and rotation, keeping them stable for concentration ranges for concentration ranges, pH and storage temperatures, typical in the administration and preservation of solutions applied intravenously to humans. From the analysis of the performed measurements, it is possible to conclude that the diameter of the nanobubbles grows with the evolution time and tends to stabilize, reaching a critical diameter, for a temperature of 25 °C. The critical diameter measured with respect to the revolution time is maintained in a range between 1000 to 2000 nm whereby, it is still in the nanometric range of the nanobubbles. The diameter of the nanobubble grows linearly with the revolution time, for measurements with evolution time of 1 hour. A linear relationship between the diameter and the energy supplied to the system can also be derived. The diameter of the nanobubble remains approximately constant, shows slowly decreases with respect to pH, for measurements at 1 hour of evolution time. The process is highly dynamic for pH=5 but this stabilizes for 6 and 7. The critical diameter decreases linearly with respect to pH. When the temperature is changed to 4 °C the diameter is approximately constant with respect to the evolution time and the different pH. Also for the temperature of 4 °C it can be seen that the process stabilizes for higher pH. The process is also more stable as a function of evolution time for the 4 °C temperature increases. The potential ζ grows with pH. This result is consistent with the stability of the nanobubble as the pH increases. Applying a filter to the solution with nanobubbles produces a decrease in potential ζ of 10-20 %. The concentration of the solution oscillated between 0.90 to 0.99 % with respect to pH when it is modified. This is interesting to note that, although the literature suggests preserving the solutions at 4 oC without explaining the reason, the results of this study allow to establish that nanobubbles have a great stability at that temperature, so the suggestion is not only concordant but can offer a meaningful explanation. It is important to note that the production of nanobubbles and their respective characterization involves rather complicated procedures, which is why systematic measurements with more sophisticated equipment are advisable. However, our conclusions can be considered as an initial contribution to the study of the physical properties of nanobubbles in order to infer possible applications in medicine.