


 English (pdf)
 Article in xml format
 Article references
 Send this article by e-mail
 Cited by SciELO
  Cited by Google
  Similars in
SciELO
Similars in
SciELO  Similars in Google
 Permalink
Introduction
Electrical impedance spectroscopy (EIS) in biological materials has allowed for the differentiation between normal and carcinogenic tissues and cells in various organs (Brown, et al., 2005). This technique is based on the characterization of the electrical properties of materials at different frequencies (Dean, et al., 2008). According to Schwan (1994), the electrical properties of tissues and cells are characterized by three major dielectric dispersions named α, β and γ in the frequency ranges of mHz-kHz, 10 kHz-10 MHz, and 10MHz-100 GHz, respectively. Each dispersion provides information about different mechanisms of physiological states. In biological cells, the α dispersion provides information about the extracellular medium and the diffusion processes through the membrane (Schwan, 1994). It is noteworthy that cancer cells undergo degeneration of the membrane in the initial phase of carcinogenesis, which causes changes in normal ionic concentrations between extracellular and intracellular media (Yúfera, et al., 2010).
Cervical cancer has one of the highest mortality rates of any of the major cancers. Luckily, early detection of this disease increases life expectancy in women who have been diagnosed (Minion & Tewari, 2018). Currently, cervical cancer screening is based on exfoliative cytology. However, the result depends on the interpretation of the morphological cellular changes, which can lead to false negative cytology (Cuzick, et al., 2006). EIS is a non-invasive technique that allows for the monitoring of the cellular state without altering the natural condition (Prodan, et al., 2008).
HeLa human cervical carcinoma cells have been used as a biological model to differentiate normal and carcinogenic cells (Das, et al., 2012). Among the reported EIS methods for HeLa measurements are the two and three electrodes biosensors to measure cells in suspension (Das, et al., 2015). The four-point Van der Paw method created for solid state measurements can also be applied in the measurement of electrical properties of electrolytic solutions. Thus, HeLa cells suspended in phosphate buffer solution (PBS medium) can be studied with this method. One of the advantages of this type of measurement is the diminution of the polarization effects because the excitation is supplied by two electrodes while the voltage is measured by the other two (Chaparro, et al., 2016). However, the electric field produced by the excitation signal generates a rearrangement of charges at the electrode/electrolyte interface. This is known as the induced polarization phenomenon (IP). The effects of this phenomenon are more evident at low frequencies, and it also depends on the surface condition of the measurement electrodes (Schwan, et al., 1966; Schwan, et al., 1968; Schwan, et al., 2002).
Gold is conventionally used as an electrode material because it is considered inert and has high thermodynamic stability (Lim, et al., 2007). Different gold cleaning processes have been reported in preexisting literature including chemical cleaning and electrochemical cleaning. In chemical cleaning, an oxidizing agent is used (a combination of hydrogen peroxide and sulfuric acid) to remove environmental contaminants from the gold surface (Chen, et al., 2015). On the other hand, electrochemical cleaning consists of the application of several oxidation/reduction cycles by voltammetry in an acid medium (Carvalhal, et al., 2005). In electrochemical measurements, the surface state of the electrode influences the process of charge transfer at the interface. On the contrary, in EIS measurements, the properties of bulk are evaluated instead of the interface (Chaparro, et al., 2016).
Usually, in the interpretation of the EIS data, a Cole-Cole or circuital model is used. The Cole-Cole model allows for the modeling of the electrical properties of heterogeneous media by four parameters: The low-frequency resistivity, the high-frequency resistivity, the medium relaxation time, and the heterogeneity parameter. With the Cole-Cole model, we can describe heterogeneous media with a statistical distribution of the relaxation time. Another possible way to analyze EIS data is by a circuital model that fits with the experimental data.
In this work, we focused on the electrode-media interface effect instead of the electrical properties of the material. As a result, the use of the Cole-Cole model is not appropriate because the target effect occurs at the interface rather than the material. As we have shown before, the ideal effect of the electrode-media interface is null, but experimental data obtained with four electrodes suggest an unexpected induced polarization effect.
No passive behavior can explain the experimental data presented in this work. Therefore, a model with an active component is proposed to explain the experimental observations. Hence, herein we studied the effect of the surface conditions of the measurement electrodes (cleaned or uncleaned) on the electrical impedance spectra of HeLa cells in suspension using an active model.
The effect of polarization impedance in a tetrapolar electrical impedance measurement
We showed that the impedance measurement using four electrodes prevented the polarization impedance effect as follows: Polarization impedance means, in this context, a passive impedance that can be represented by circuital passive elements, such as resistance, capacitance, inductance, constant phase elements, or a combination of these.
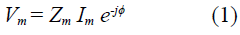
To understand the importance of a tetrapolar setup, the circuital model is described as follows: Figure 1 shows a linear time-invariant (LTI) medium with electrical impedance Z m , which is described by a four-terminal box with two input and two output terminals. The four-terminal box represents the medium satisfied by the equation (1), where Vm is the amplitude of the potential difference between the two output terminals, I m , the amplitude of electrical current, and <j> is the phase between output potential and input current.
A current source introduced a sinusoidal current to the medium i = I sin(2ϖft) and an electrometer measured the potential difference, v
e
= V
e
sin(2ϖft + φ). Four polarization impedances (Z
p1
, Zp2, Zp3, Z
P4
) represent the polarization induction effect established by the contact between measurement instruments and the medium. Kirchhoff laws imply that im = i = I
m
sin(2ϖft) and given that the current flow through the electrometer is negligible, (i
e
≈ 0), then v
m
= v
e
= V
m
sin(2ϖft + φ). The measured impedance is the quotient between the amplitude of voltage in the electrometer V
e
and the amplitude of current introduced by the current source I plus the phase of current and voltage, 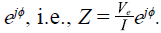
Note that V e = V m and I=Im, then, using equation (1) we have shown that the measured impedance is equal to the medium impedance no matter the polarization impedances. This means that no effects in tetrapolar measurements are due to polarization impedances.
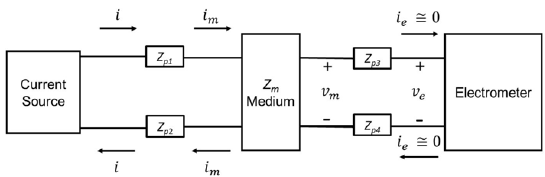
Figure 1 Circuital model of a tetrapolar electrical impedance experiment. A linear medium with impedance Z m (central box) is represented by a box with four terminals: two input and two output. The medium is perturbed by an alternating current source (I m ) through the two input terminals. The potential difference (Vm) between the two output terminals is measured by a high impedance electrometer (ie ≅ 0). Four polarization impedances (Zp1, Zp2, Zp3, Zp4) represent the polarization induction effect due to the contact between measurement instruments and the medium.
Materials, methods and experimental setups
Chemicals and solutions
All chemical reagents used were analytical grade. NaC1, KC1, Na2HPO4, NaH2PO4, H2SO4, and H2O2 were purchased from Merck. K2HPO4 and KH2PO4 were purchased from Sigma-Aldrich. Aqueous solutions were prepared in deionized water from a Milli-Q ultra-pure water system (18.2 MΩ). The standard medium was a PBS solution containing (mM): NaC1 (138.0), KC1 (3.0), Na2HPO4 (8.1) and KH2PO4 (1.5) adjusted to pH 7.4 with NaOH.
Cell preparation
HeLa cells were cultured in Essential Minimal Eagle medium (EMEM) supplemented with 7% fetal bovine serum and gentamicin (50 mg/L). The cells were grown in an atmosphere containing 5% CO2 at 37°C until cellular confluence. The release of cells was performed by treatment with trypsin (0.5 %) and 1mM EDTA. Cells were centrifuged at 3000xg for 5 minutes and a population size of 1.2x10⁶ was suspended in 1 mL of PBS (pH 7.4). The impedance spectrum measurements of cells were performed at room temperature.
Elaboration of the four-electrode cell
The four-electrode cell was fabricated with two parts: a cylindrical Teflon container and the gold electrodes. The gold electrodes were made by welding four gold wires (18 carats, 1 mm in diameter and 15 mm long), each one welded to a silver wire with the same dimensions at an angle of 90°.
Electrode cleaning process
The gold electrodes were chemically cleaned by immersion in a 1:3 v/v H2O2(9,8 M)/ H2SO4(11,8M) solution for 1 minute to remove the organic compounds present on their surface. Then, the electrodes were electrochemically cleaned by cyclic voltammetry and rinsed with deionized water. Cyclic voltammetry measurements were performed in a conventional three-electrode cell at room temperature. The oxidation-reduction cycling in 0.5M H2SO4 was completed for each electrode by scanning the potential between -0.1 and 1.6 V at a scan rate of 0.1 Vs-1 and it ceased when the characteristic electrochemical behavior of the gold was obtained. The dissolved oxygen was removed from all solutions by bubbling nitrogen for 15 min. The working electrode was one of the prepared gold electrodes. The counter electrode was a high purity graphite rod (99.9995%, 5 mm in diameter) and an Ag/AgCl/3.0M KCl electrode was used as reference. All electrochemical measurements were performed with a potentiostat/galvanostat Autolab PGSTAT302N and the Nova 1.10.4 software.
Electrical measurement setups
We performed three types of electrical measurements: Cyclic voltammetry (CV), direct current (DC), and alternating current (AC). The DC and AC electrical measurements were carried out with two Autolab PGSTAT204 potentiostat/galvanostats with an impedance analyzer, a four-electrode cell with gold electrodes, an Ag/AgCl (3.0M KCl) reference electrode, and PBS as aqueous electrolyte medium. Electrometers from two potentiostats were used.
In the DC and AC experiments, a current source and two electrometers (impedance analyzers) were used as shown in figure 2. The current was supplied through the working electrode (WE) and the counter electrode (CE). The Ag/AgCl electrode was placed in the center of the cell and the electrical potential difference between it and a sensor electrode (SE) was recorded using a high impedance electrometer.
In both the DC and AC setups, a sinusoidal current excitation with an amplitude of 10 µA and frequencies between 10 mHz and 100 kHz was selected; 500 µL of PBS both with and without cells were used in each measurement. The contact time of the cells with the electrode during the electrical characterization was 3 minutes.
Figure 2 Experimental setup for the DC and AC electrical measurements using three potentiostats. Abbreviations: WE (working electrode), CE (counter electrode), SE 1 and SE 2 (sensor electrodes).
We carried out each electrical impedance measurement of the PBS solution with and without cells in triplicate and we determined the standard deviation for each of them.
In both the DC and AC experiments, we used a sinusoidal current excitation instead of DC excitation. However, we performed DC measurements on electrodes to study the offset effect and AC measurements to explore the alternating current effects.
DC electrical measurement
The DC effect of induced polarization, i.e., the offset contribution of the electrical potential difference due to the sinusoidal current excitation, was recorded with electrometers by SE1 and SE2 electrodes from the potentiostat as shown in figure 2.
AC electrical measurements
We performed two types of AC electrical measurements: First, a traditional four-electrode electrical impedance and second, a potential difference with sinusoidal excitation to study the AC effect of induced polarization.
The first setup is well reported in the literature (Chaparro, et al., 2016). The second setup was proposed for studying the AC effect of induced polarization due to the excitation signal. Electrical impedance measurements were performed simultaneously in PBS medium using two impedance analyzers as shown in figure 2. The amplitudes of the sinusoidal potential differences were recorded by two electrometers using SE and RE electrodes.
In the second setup, it is important to note that each impedance analyzer had a current source and an electrometer. Thus, to perform the AC measurements, we used both electrometers of the two impedance analyzers but only one current source (from the first impedance analyzer). To avoid damaging the second impedance analyzer and taking into account that the current injected by this impedance analyzer has no effect in the measurements recorded, we used a second cell with PBS to connect the current source of this impedance analyzer (this second cell is not shown in figure 2).
Results and discussion
To study the effect of the surface condition of the gold electrodes on four-points electrical measurements, we measured impedance spectra either in PBS medium with or without HeLa cells before and after electrochemical cleaning of the electrodes as shown in figure 3. Owing to the electrical nature of impedance measurements and the low current used, oxidation-reduction processes did not occur. The main effect of the electrochemical pretreatment is the decrease of standard deviation values at frequencies lower than 10 Hz with respect to untreated electrodes. This behavior is more evident at frequencies below 1 Hz.
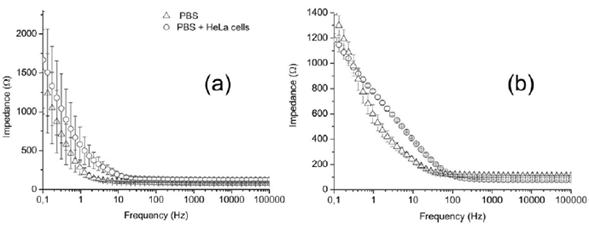
Figure 3 Electrical impedance spectra of PBS medium (triangles) and HeLa cells in PBS (circles): (a) without electrochemical pretreatment of electrodes and (b) after electrochemical treatment of the gold electrodes. The error bars indicate the standard deviation of three or more independent experiments.
The accuracy of the impedance magnitude can be associated with the induced polarization phenomenon (IP) of the electrodes caused by the excitation current (Ragheb & Geddes, 1991). Although the IP depends on the excitation frequency and the surface conditions of the electrodes (Tarasov & Titov, 2013), we observed nonsignificant variations at frequencies below 1 Hz as discussed below. The following sections present an experimental study of the effect of the IP phenomenon on the EIS measurements.
Electrochemical cleaning process and surface conditions of gold electrodes
Cyclic voltammetry experiments were performed to clean and study the surface of gold electrodes. Figure 4 shows the typical voltammetry curves of fouled gold electrodes. Since the geometric area of each electrode submerged in the solution was the same, variations in peak currents indicate the variation in either roughness or oxidation degree. It is noteworthy that after initiating the scan in the positive direction, at least two oxidation peaks were observed (inset of figure 4). Voltammetric peaks in this region are not characteristic of gold surfaces, which indicates different surface chemistry among them. This can be related to the fouling of the electrode ascribed to the nonspecific protein adsorption and cell adhesion. In analytical electrochemistry, cell biofouling is a well-known phenomenon that has a harmful effect on the functioning of the electrochemical sensing interface when exposed to a biofluid (Liu, et al., 2019). Different open-circuit values were obtained for each electrode mentioned above. Thus, it is possible to relate the accuracy in impedance to the different surface conditions of the electrodes.
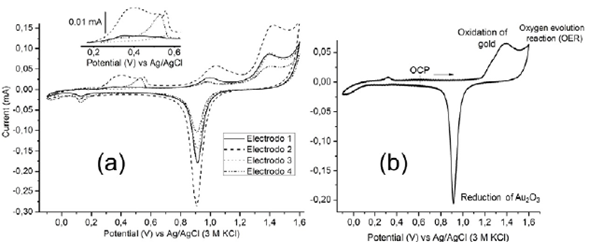
Figure 4 Cyclic voltammograms (v = 100 mVs-1) obtained on (a) different gold electrodes in 0.5 M H2SO4, as indicated in the figure legends and (b) after the cleaning process.
To guarantee a similar superficial condition of the gold electrodes (electrochemical pretreatment), several oxidation/reduction cycles were applied on the gold electrodes by voltammetry in an acid medium. This process was carried out until the characteristic electrochemical behavior of the gold for each electrode could be observed (Figure 4b). The above guaranteed similar superficial conditions of the gold electrodes (Fischer, et al., 2009).
Polarization induction effects
The polarization induction effects occur by an external excitation (current source in figure 2) in a medium where interfaces exist. In tetrapolar EIS experiments, four interfaces appear, one for each electrode. In typical electrical measurements, the polarization induction effects can be modeled by polarization impedances as described above. However, when solid electrodes are in contact with an electrolyte solution, an electrical double layer is formed near the surface of the electrode. The double layer is represented in the dashed line box of figure 5 by two oppositely charged layers at the interface. Due to the rearrangement of electric charges caused by the excitation current, an accumulation of charge occurs at low frequencies, which contributes to the electric potential. At higher frequencies, the rapid change of the electric field direction produces a very fast charge and discharge of the double layer, thus preventing charge accumulation and generating displacement currents (Qu & Shi, 1998). The effect of introducing the electrode in the electrolyte solution can be modeled by an electrical potential difference q> in series with a passive polarization impedance Zp (Figure 5) where the potential difference has two contributions (DC and AC) as follows:

The proposed model suggests that when a tetrapolar EIS experiment is carried out in an electrolyte solution, a potential φ appears due to the impedance polarization as shown in figure 5. Based on the arguments described above, the input currents are equal, i.e., i = im. Indeed, the voltage in the electrometer v e must be different from the voltage in the medium vm. Both the current through the electrometer and the effect of polarization impedances Zp3 and Zp4 are negligible. Assuming the above, the relation of voltages is given by equation (3).

Combining equations (2) and (3) and simplifying the expression, we obtained the equation (4) where


This implies that the impedance measured is given by equation (5):

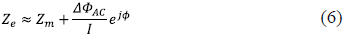
If the ∆фDC contribution is negligible, then the measured impedance is given by
We conducted two types of experiments to study the effect of induced polarization: DC and AC electrical potential of the gold electrode with respect to a nonpolarizable electrode as described in the following section.
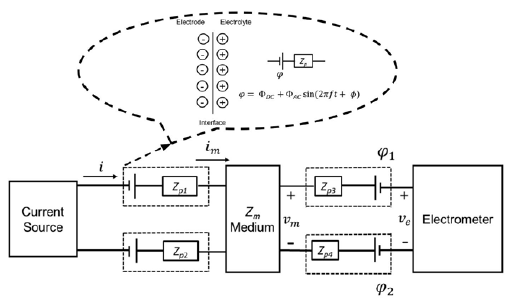
Figure 5 Circuital model of a tetrapolar electrical impedance experiment performed in a liquid electrolyte media, where the central box represents a linear medium with impedance Zm. The dashed lines box illustrate the Helmholtz double layer model and the corresponding circuital model, where φ is the potential difference, ΦDC and ΦAC, DC and AC potential difference contributions, f frequency, t, time, Φ, phase, and Z p the polarization impedance.
DC electrical potential of the gold electrode with respect to a nonpolarizable electrode
To verify the effect of the surface condition of gold electrodes during EIS measurements at four points, the DC electrical potential Φ DC of the two gold electrodes (SE1 and SE2 in figure 2) was measured simultaneously with respect to the Ag/AgCl reference electrode (3.0 M KCl). For that measurement, we used the electrometer with the low-pass filter setup that measures only the DC contribution. The DC contribution of the electrical potential difference of each SE before and after (cleaning) the electrochemical cleaning (Figure 6) showed differences that can be associated with the IP phenomenon. The excitation current produced a progressive reorganization of the electrical charges at the interface until reaching a steady-state potential value in the range of seconds (Shi, et al., 2016). It is worth noting that the potential values closed when they were clean.
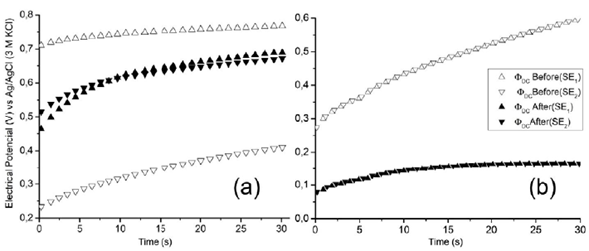
Figure 6 Comparison between the direct current (DC) electrical potential difference 0 DC of gold electrodes (SE1 and SE2) with respect to a reference electrode of Ag/AgCl (3.0 M KCl) measured for (a) an electrode and after for the other (not simultaneously), and (b) performed simultaneously for both electrodes.
The cleaning process carried out on the electrodes guaranteed similar surface conditions, which caused the electrical dynamics to be the same in the process of polarization of the electrode. Thus, the accuracy in the EIS measurements was achieved as shown in figure 4.
Additionally, it is important to consider the effect of the ions at the electrode interface. Both SE1 and SE2 electrodes are polarized by attracting opposite-charge and different-sized ions around them during ESI measurements. Therefore, the electrical dynamic is different around each electrode as a consequence of the effect of the size of the ions (Largeot, et al, 2008). This phenomenon generates different contributions of potential in each electrode. When the electrical measurements are performed separately for each electrode as in figure 6 (a), experimental conditions are not identical. However, if the measurements are performed simultaneously as in figure 6 (b), it is possible to compare the condition of both electrodes. Figure 6 (b) shows the DC contribution of the electric potential difference of the SE1 and SE2 electrodes with respect to the Ag/AgCl reference electrode obtained simultaneously during EIS measurements (Figure 2). In these results, we observed the superposition of the electrical potential curves of the two electrodes for both surface conditions. Note that the potential at both electrodes is equal (ΦDC1= ΦDC2), therefore, the contribution ΔΦDC = Φ DC2 - Φ DC1 due to the net effect of induced polarization was not observed in DC measurements performed simultaneously. This suggests that differences observed in the EIS (Figure 3) were not due to a DC contribution and that an AC contribution could explain such differences.
AC electrical potential of the gold electrode with respect to a nonpolarizable electrode
Considering that the IP phenomenon is not observed in direct current measurements, we performed indirect measurements of the amplitude ΦAC of the AC electrical potential ΦAC = ΦAC sin(2ϖft). In these measurements, we observed different contributions of electric potential in each measuring electrode for both surface conditions (Figure 7).
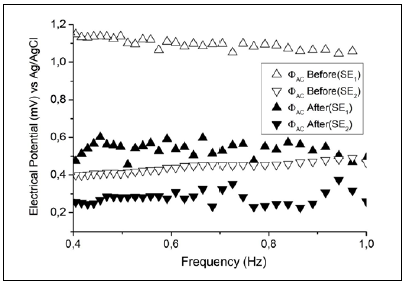
Figure 7 Indirect measurement of AC electric potential amplitude ΦAC in two gold electrodes (SE1 and SE2) using two cells and an Ag/AgCl reference electrode (3.0 M KCl).
The experimental EIS results shown in figure 7 demonstrate that the AC contribution ΔΦAC was different from zero and, given that the DC contribution was negligible, equation (6) could be used to describe the experimental EIS results.
We found that performing the electrochemical cleaning decreased the value of the contribution of electrical potential in each electrode and ΔΦAC was smaller than in the case of an unclean surface, which agrees with the EIS experiments (figure 3).
Since the conditions of the medium and the dimensions of the electrodes and cell were the same, the observed decrease of potentials can be associated with a similar surface state at the measurement electrodes. Thus, the contribution of potential due to the induced polarization of the interface (φ 2 - φ 1 ) decreased because it mainly depended on a single factor: The electrical dynamics around each electrode.
The effect ofgold electrodes surface states in the measurement of electrical properties of HeLa cells in aqueous suspension
EIS allows relating the electrical properties of HeLa cells in aqueous suspension to their physiological states (Mondal & Roychaudhuri, 2013; Dean, et al., 2008; Das, et al., 2012; Das, et al., 2015). According to Schwan (1983), the frequency range between 100 Hz- 1 MHz (β zone) provides information about the Maxwell-Warner effects and allows for the study of the protein molecule response (Thu, et al., 2017). The impedance spectrum of cells in suspension in this frequency range has been well studied including its use to detect cancer cells (Das, et al., 2012). In the study by Das, et al. (2012) on cells in a solution with a two-electrode setup a passive behavior of electrode media interface was observed. However, in our work, we observed an active (not passive) behavior in the measurements performed with four electrodes in a frequency range that includes the β zone and a part of the a zone.
The Das, et al. (2012) study with cancer cells showed the effects of the cell membrane on the electrical impedance measurement. Hence, it is possible to obtain information about ionic diffusion processes across the cellular membrane allowing for the analysis of membrane potential changes (Clarence, 1970). Cancer cells have altered membrane potential while depolarization of membrane is necessary for their maintenance and proliferation (Yang & Brackenbury, 2013; Berzingi, et al., 2016), therefore, measuring precise changes in membrane potential can contribute to cancer detection.
With two and three-electrode measurements, the electrode media interface effect appears to be passive (Das, et al., 2012) instead of the active effect we observed in the four electrode experiments. The interface effect can negatively affect the capability to detect anomalies of cells or tissue, especially at lower frequencies. Therefore, improving the reproducibility of measurements in this frequency range could provide useful information for the detection of cervical cancer. Because the induced polarization phenomena are more evident at lower frequencies, it is necessary to guarantee similar surface conditions in the electrodes measured to obtain more accuracy.
Conclusions
We studied the effect of the surface condition of gold electrodes on electrical properties of HeLa cells in suspension using electrical measurements and a circuital model, which led us to the following conclusions: First, the phenomena of induced polarization at the electrode/electrolyte interface at low frequencies generated contributions of electric potential which were not expected in the tetrapolar EIS measurements; second, this effect was due to an AC induced polarization contribution instead of a DC contribution. Thus, voltammetry treatment of gold electrodes minimized undesirable polarization effects, which enhanced the accuracy of EIS measurements.

