SciELO - Scientific Electronic Library Online

 
vol.44 issue172Selective gold extraction using membranes based on a new polymeric material with complex active sitesRapid electrochemical detection of Staphylococcus aureus based on screen-printed gold electrodes modified with cysteine and Guinea grass (Panicum maximum) peroxidase author indexsubject indexarticles search
Home Pagealphabetic serial listing  

Services on Demand

Journal

Article

Indicators

Related links

  • On index processCited by Google
  • Have no similar articlesSimilars in SciELO
  • On index processSimilars in Google

Share


Revista de la Academia Colombiana de Ciencias Exactas, Físicas y Naturales

Print version ISSN 0370-3908

Rev. acad. colomb. cienc. exact. fis. nat. vol.44 no.172 Bogotá July/Sept. 2020  Epub July 24, 2021

https://doi.org/10.18257/raccefyn.1021 

Ciencias químicas

Validation of an analytical method by GC-FID for the quantification of styrene and α-methylstyrene

Validación de un método analítico por GC-FID para la cuantificación de estireno y α-metilestireno

Brayan David Verdugo-Torresa  * 
http://orcid.org/0000-0002-0326-6221

Jairo Antonio Cubillo-Loboa 
http://orcid.org/0000-0002-0700-5942

Hugo Alfonso Rojas Sarmientoa 
http://orcid.org/0000-0003-3906-4522

a Grupo de Catálisis (GC-UPTC), Escuela de Ciencias Químicas, Universidad Pedagógica y Tecnológica de Colombia, Tunja, Colombia


Abstract

Styrene and α-methylstyrene are substrates of great interest in asymmetric catalysis. Although they have been widely used, known quantification methodologies are restricted to the use of mass spectrometry detectors and are not validated. In the present work, we developed and validated a reliable method by gas chromatography with a flame ionization detector (GC-FID) for the analysis of non-functionalized olefins (styrene and α-methylstyrene) in a liquid matrix using toluene as the internal standard. We explored validation parameters such as selectivity, linearity, detection limit, quantification limit, precision, and accuracy. The results showed an adequate separation of each olefin under the conditions and range of work implemented (6.83x10⁻⁴ mol/L - 4.059x10⁻³ mol/L). The parameters evaluated are within acceptable values indicating that the validated method is selective, linear, precise, and accurate. This work represents an effort to develop a highly safe, efficient, and validated chromatographic method for the quantification of styrene and α-methylstyrene in liquid matrices for their possible application in the field of resins, plasticizers, and polymers where they are mainly involved.

Keywords: Validation; Method; Styrene; α-methylstyrene; GC-FID

Resumen

Estireno y α-metilestireno son sustratos de gran interés en catálisis asimétrica. Aunque han sido ampliamente usados, las metodologías de cuantificación conocidas se restringen al uso de detectores de espectrometría de masas y no se encuentran validadas. En el presente trabajo se desarrolló y validó un método confiable mediante cromatografía de gases con detector de ionización de llama (GC-FID) para el análisis de olefinas no funcionalizadas (estireno y α-metilestireno) en matrices líquidas utilizando el tolueno como patrón interno. Los parámetros de validación evaluados incluyeron selectividad, linealidad, límite de detección, límite de cuantificación, precisión y exactitud. El análisis evidenció una separación adecuada de cada analito de interés bajo las condiciones y el rango de trabajo implementado (6,83x10⁻⁴ mol/L - 4,059x10-3 mol/L). Los parámetros evaluados registraron valores dentro de los rangos de aceptación, lo que confirmó que el método validado es selectivo, lineal, preciso y exacto. Este trabajo representa un esfuerzo por desarrollar un método cromatográfico validado seguro y eficiente para la cuantificación de estireno y α-metilestireno en matrices líquidas, y su posible aplicación en el campo de las resinas, plastificantes y polímeros.

Palabras clave: Validación; Método; Estireno; α-metilestireno; GC-FID

Introduction

Within asymmetric catalysis, styrene and α-methylstyrene are found as substrates of great interest since their enantiomeric epoxides have highly desirable properties due to their reactive versatility for which they are involved in the synthesis of medicines and agrochemicals (Wong & Shi, 2008; Xia, et al., 2005). Although these substrates have been widely used (Huang, et al., 2019; Tang, et al., 2008) the chromatographic methods for the quantification of styrene and α-methylstyrene in this type of reaction have not been validated (Berijani, et al., 2019; Hadian & Hosseini, 2016) and, therefore, the results have not been supported. In this context, the objective of the present study was to report the results of the validation of a chromatographic method for the quantification of these olefins in samples and/or enantioselective epoxidation tests. The method we describe here for styrene has comparable results with those reported in other areas (Gennari, et al., 2012) as regards the limits of detection (LOD) and quantification (LOQ) and it is the only validated method of GC-FID quantification of α-methylstyrene. Additionally, the method also works with an FID detector, which was not the case with a previously reported MS detector (Bubeníková, et al., 2019; Even, et al., 2019; Hwang, et al., 2019), and it allows simultaneous quantification of the two substrates thus expanding the possible fields of application.

Materials and methods

Materials

We developed and verified the method using commercial samples of styrene and α-methylstyrene (Sigma-Aldrich, St. Louis, United States) and toluene (Merck, Darmstadt, Germany). We separated the analytes on a chiral capillary column (β-DEX, Sigma-Aldrich, St. Louis, United States) of 30 m in length, 0.25 mm of internal diameter, and a 0.25 film thickness, located on a Varian-CP 3800 gas chromatograph (Palo Alto, United States) with a flame ionization detector (FID). The method was developed under the following conditions: injector temperature, 280°C; split ratio, 1/100; injection volume, 0.2 µL; oven heating program, 50°C for 1 min at 2°C/min, 80°C for 2 min at 10°C/min, and 200°C for 12 min; FID detector temperature, 280°C. We used helium as the carrier gas at a flow and head pressure of 30 ml/min and 33 psi and the analysis time was 30 min.

We estimated the areas under the curve using the Interactive Graphics software of the Varian MS Workstation version 6.6®.

Verification of the chromatographic method

To verify the chromatographic method we validated the quality parameters of selectivity, linearity, LOD, LOQ, precision, and accuracy. Following the steps of a typical experiment, we added 2 ml of dichloromethane to the amount required according to the calibration curve under evaluation (3.3 - 19.6 µl styrene and 3.7 - 22.1 µl α-methylstyrene); then we diluted an aliquot of 100 µl in 2 ml with the same solvent, and, finally, we added 15 µl of toluene as the internal standard. We injected the resulting sample under the conditions previously mentioned (Table 1) and we collected the chromatographic area and elution time data.

Table 1 Linearity values of the chromatographic method 

Selectivity. Selectivity refers to the ability of the method to measure and/or identify simultaneously or separately the analytes of interest (Aguirre, et al., 2001; Nageswara, 2018). Using the selectivity factor α as in Ec. 1, we determined if the compounds evaluated were chemically distinct under the proposed method:

where t r A and t r B are the retention times of styrene and α-methylstyrene, respectively, and t m is the dead time of the analysis.

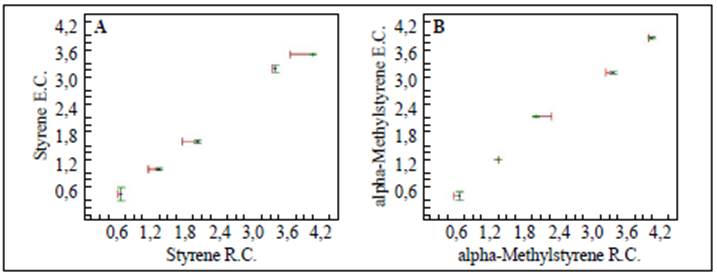
Linearity. The linearity defines the ability of a method to obtain test results propor tional to the analyte concentration in a sample (UNODC, 2009). In gas chromatography, the calibration with an internal standard is very often used (Poole, 2012). Here we deter mined the linearity of the method by constructing a calibration curve with five levels of concentration of the commercial sample injected in triplicate. As acceptance criteria, we used various parameters of linear regression: A correlation coefficient (r) ≥ 0.99, a determination coefficient (r2) ≥ 0.98, a slope significantly different from 0 (texp > tcal), and a Cochran test (Gexp < Gtab) as proof of the homogeneity of variances.

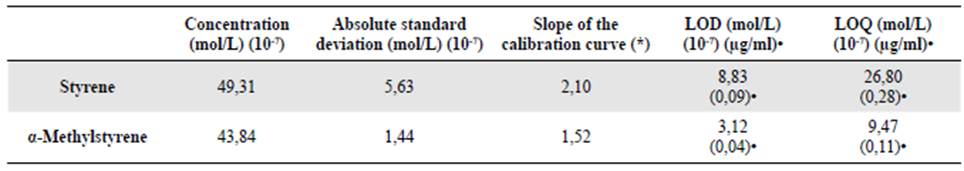
Limits of detection and quantification. The LOD of an analytical procedure is defined as the lowest detectable amount of analyte in a sample, that may not necessarily be quantifiable as an exact value (ICH, 2005; Gabhe, 2015). On the other hand, the LOQ is the lowest amount of analyte in a sample that can be quantitatively determined with the appropriate precision and accuracy (ICH, 2005; Gabhe, 2015). According to the ICH and IUPAC guidelines, the detection limit can be determined from the standard deviation of the replicated blank measurements and the slope of the calibration curve. However, when it is difficult to determine them due to instrumental noise, they can be calculated from enriched samples with a concentration close to zero.

We calculated LOD (X d ) and LOQ (X c ) using Ec. 2, 3, and 4 (Poole, 2012), where b 1 is the slope of the calibration curve, σ bl is the standard deviation of the concentration sample close to 0, and k c , k d y k q are statistics constants that depend on the level of significance (α) and the degrees of freedom (gl = n-1). In this case, α = 0.05 y gl = 9, so that k c = k d = 1.83, y k q = 10.

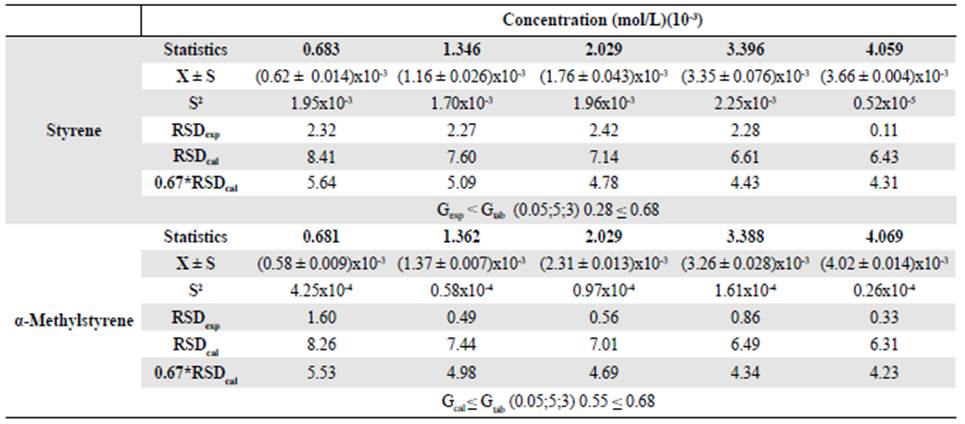
Precision. The precision of an analytical method represents the proximity between the series of measurements obtained from the same sample under the prescribed conditions (FDA, 2001). Repeatability is the estimated precision in the most optimal operating conditions: The same laboratory, the same analyst, the same instrument, and a short time interval. To assess the precision of the method, we injected each level of the calibration curve three times. We determined the experimental relative standard deviation (RSDexp) and we compared the value obtained to that of the standard deviation (RSDcal) in Horwitzs equation (Ec. 5).

Where C is the concentration of compound expressed as a dimensionless mass fraction at each level of the calibration curve. The precision is considered acceptable when the RSDexp is less than 0.67*RSDcal (Zuas, et al., 2016). We used a Cochran test, where the calculated statistic should be less than the tabulated one, to determine if the concentration had an effect on precision.

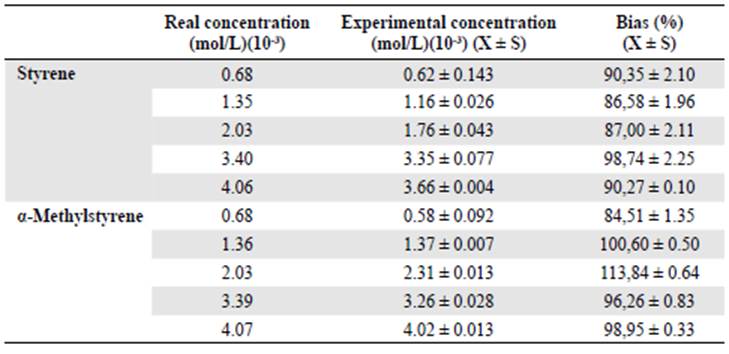
Accuracy. Accuracy is the proximity between the average value of a number of test results and the accepted reference value (Poole, 2012). We evaluated this parameter through the percentage of recovery or bias (Ec. 6).

where x is the average of the experimental concentrations of three injections for each level of the calibration curve found through the equation and x ref is the real concentration used. Commonly accepted values are between 100±20% (FDA, 2001, Gomes, et al., 2010).

Results and discussion

Selectivity

Given the retention times of 5.47 min for styrene (A) and 9.38 min for α-methylstyrene (B) and a dead time of 1.02 min, the selectivity factor of B with respect to A equaled 1.87 indicating that under the working conditions the chromatographic method exhibited selectivity towards the two compounds.

Linearity

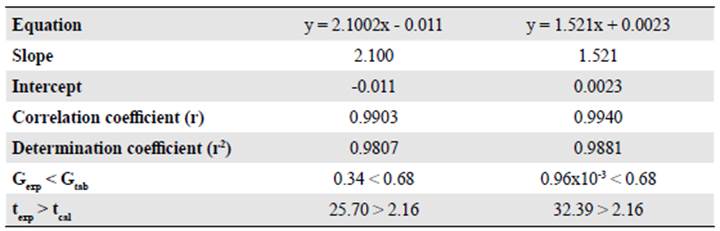
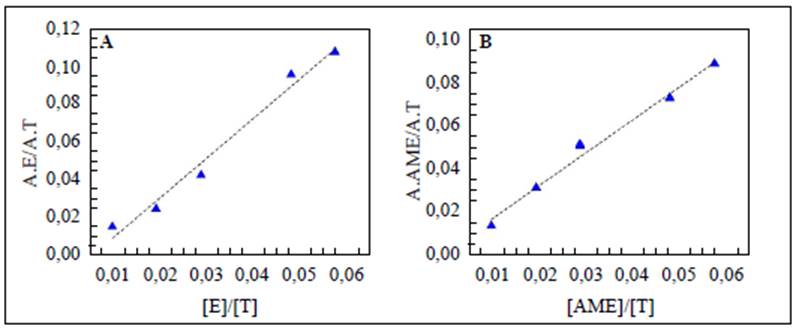
The results presented in figure 1A and B and in table 1 indicated that the method was linear for both substrates in the concentration range evaluated since we obtained correlation coefficients (r) over 0.99 and determination coefficients (r2) over 0.98. On the other hand, texp > ttab and Gexp < Gtab evidenced that the slope was significantly different from 0 and that the concentration had no effect on the linearity of the method, respectively.

Figure 1 Calibration curves: A. styrene and B. α-methylstyrene 

Limits of detection and quantification

In table 2 we summarize the values of LOD and LOQ found for both styrene and α-methylstyrene. These results showed that the chromatographic method had remarkably low values for the quantification of these substrates.

Table 2 LOD and LOQ valued of the chromatographic method 

* Area/concentration

Precision

The results shown in table 3 indicated that the analytical method met the accepted criteria of repeatability since at all the concentration levels evaluated the RSDexp was less than 0.67*RSDcal. In its turn, the concentration variable had no effect on the precision since Gcal ≤ Gtab.

Table 3 Precision of the chromatographic method 

*X: Average, S: Standard deviation, S2: Variance

As shown in table 4 and figure 2A-B, the bias values or recovery percentage at all concen tration levels for the two olefins used were within the acceptable values for this parameter (100±20%), which means the method was accurate throughout the range of work.

Table 4 Accuracy of the chromatographic method 

Figure 2 A-B. Accuracy of the method developed: A. Styrene, B. α-methylstyrene. *E.C: Experi mental concentration, R.C: Real concentration 

Conclusions

The chromatographic method developed for the quantification of styrene and α-methylstyrene had acceptable results for each validation parameter and providing sufficient evidence to assert that it is a reliable, selective, linear, precise, and accurate method in the concentration ranges evaluated. The method and the enantioselective epoxidation reactions can be used for the analysis of samples containing either of the two substrates in plasticizers, resins, or polymers that commonly involve them.

Acknowledgements

To Colciencias and to Universidad Pedagógica y Tecnológica de Colombia for providing the resources for this project (Programa de Investigadores Jóvenes, Call 775 - Colciencias and UPTC SGI 2308).

References

Aguirre-Ortega, L., Pérez-Cuadrado, J., Pujol-Forn, M. (2001). Validación de métodos analíticos. Barcelona, España: Asociación Española de Farmacéuticos de la Industria. p. 46. [ Links ]

Association of Official Agricultural Chemists - AOAC. (2013). Appendix K: Guidelines for Dietary Supplements and Botanicals. Accessed on September 28, 2019. Avalaible at: Avalaible at: http://www.eoma.aoac.org/app_k.pdfLinks ]

Berijani, K., Morsali, A., Hupp, J. T. (2019). An effective strategy for creating asymmetric MOFs for chirality induction: a chiral Zr-based MOF for enantioselective epoxidation. Catalysis Science & Technology. 9 (13): 3388-3397. [ Links ]

Bubeníková, T., Bednár, M., Gergel’, T., Igaz, R. (2019). Adsorption Effect of Added Powder Graphite on Reduction of Volatile Organic Compounds Emissions from Expanded Polystyrene. BioResources. 14 (4): 9729-9738. [ Links ]

Coelho, M. & Ribeiro, B. (2016). White biotechnology for sustainable chemistry (p. 249). Cambridge: Royal Society of Chemistry. [ Links ]

Even, M., Hutzler, C., Wilke, O., Luch, A. (2019). Emissions of volatile organic compounds from polymer-based consumer products: comparison of three emission chamber sizes. Indoor Air. 30 (1): 40-48. [ Links ]

Food and Drug Administration - FDA. (2018). Bioanalytical Method Validation Guidance for Indus try. Accessed on September 28, 2019. Avaliable at: Avaliable at: https://www.fda.gov/media/70858/downloadLinks ]

Gabhe, S. (2015). Development And Validation Of Chromatographic Methods For Simultaneous Quantification Of Drugs In Bulk And In Their Formulations: HPLC And HPTLC Techniques (p. 22-25). Hamburg, Germany: Anchor Academic Publishing. [ Links ]

Gennari, O., Albrizio, S., Monteiro, M. (2012). A GC-FID method to determine styrene in polystyrene glasses. Food Analytical Methods. 5 (6): 1411-1418. [ Links ]

Gomes, D., de Pinho, P., Pontes, H., Ferreira, L., Branco, P., Remião, F., et al. (2010). Gas chromatography-ion trap mass spectrometry method for the simultaneous measurement of MDMA (ecstasy) and its metabolites, MDA, HMA, and HMMA in plasma and urine. Journal Of Chromatography B. 878 (9-10): 815-822. [ Links ]

Hadian-Dehkordi, L. & Hosseini-Monfared, H. (2016). Enantioselective aerobic oxidation of olefins by magnetite nanoparticles at room temperature: a chiral carboxylic acid strategy. Green Chemistry. 18 (2): 497-507. [ Links ]

Huang, J., Liu, S., Ma, Y., Cai, J. (2019). Chiral salen Mn (III) immobilized on ZnPS-PVPA through alkoxyl-triazole for superior performance catalyst in asymmetric epoxidation of unfunctionalized olefins. Journal Of Organometallic Chemistry. 886: 27-33. [ Links ]

Hwang, J. B., Lee, S., Yeum, J., Kim, M., Choi, J. C., Park, S.-J., Kim, J. (2019). HS-GC/MS method development and exposure assessment of volatile organic compounds from food packaging into food simulants. Food Additives & Contaminants: Part A. 36 (10): 1574-1583. [ Links ]

International Council for Harmonisation of Technical Requirements for Pharmaceuticals for Human Use - ICH. (2005). Validation of analytical procedures: text and methodology Q2(R1). Paper presented at the International conference on harmonization, Geneva, Switzerland. [ Links ]

Poole, C. (2012). Gas chromatography (1st ed., pp. 435-448). Amsterdam, Netherland: Elsevier. [ Links ]

Nageswara-Rao, T. (2018). Validation of Analytical Methods. En M. Stauffer (Ed.). Calibration and Validation of Analytical Methods: A Sampling of Current Approaches (pp. 131-141). London, United Kingdom: BoD-Books on Demand. [ Links ]

Tang, X., Tang, Y., Xu, G., Wei, S., Sun, Y. (2008). Highly enantioselective epoxidation of styrene and α-methylstyrene catalyzed by new doubly-immobilized chiral (salen) Mn(III) catalysts. Catalysis Communications. 10 (3): 317-320. [ Links ]

United Nations Office on Drugs and Crime - UNODC. (2009). Guidance for the Validation of Analytical Methodology and Calibration of Equipment used for Testing of Illicit Drugs in Seized Materials and Biological Specimens. Accessed on September 27, 2019. Available at: Available at: https://www.unodc.org/documents/scientific/validation_E.pdfLinks ]

Wong, O. & Shi, Y. (2008). Organocatalytic Oxidation. Asymmetric Epoxidation of Olefins Catalyzed by Chiral Ketones and Iminium Salts. Chemical Reviews. 108 (9): 3958-3987. [ Links ]

Xia, Q., Ge, H., Ye, C., Liu, Z., Su, K. (2005). Advances in Homogeneous and Heterogeneous Catalytic Asymmetric Epoxidation. Chemical Reviews. 105 (5): 1603-1662. [ Links ]

Zuas, O., Mulyana, M. R., Budiman, H. (2016). Analytical method validation of GC-FID for the simultaneous measurement of hydrocarbons (C2-C4) in their gas mixture. Revista Colombiana de Química. 45 (3): 22-27. [ Links ]

Citation: Verdugo-Torres BD, Cubillo-Lobo JA, Rojas Sarmiento HA, et al. Validation of an analytical method by GC-FID for the quantification of styrene and α-methylstyrene. Rev. Acad. Colomb. Cienc. Ex. Fis. Nat. 44(172):828-834, julio-septiembre de 2020. DOI: https://doi.org/10.18257/raccefyn.1021

Editor: Luis Fernando Echeverry

Authors contribution Todos los autores contribuyeron con diferentes aspectos del trabajo, BDV sección experi mental y contribución a la escritura del manuscrito, JAC análisis estadístico y contribución a la escritura del manuscrito, HAR contribución a la escritura del artículo.

Conflicts of interests All authors declare no conflicts of interest.

Received: October 30, 2019; Accepted: April 28, 2020

*Corresponding autor: Brayan David Verdugo Torres; brayan.verdugo@uptc.edu.co

Creative Commons License This is an open-access article distributed under the terms of the Creative Commons Attribution License