


 English (pdf)
 Article in xml format
 Article references
 Send this article by e-mail
 Cited by SciELO
  Cited by Google
  Similars in
SciELO
Similars in
SciELO  Similars in Google
 Permalink
Introduction
Active Galactic Nuclei (AGN) are relatively small regions located in the center of some galaxies that emit strong electromagnetic radiation practically in each spectral region under observation. These regions are of great scientific interest because they constitute one of the most luminous objects known in the universe. They have been intensively studied for more than 70 years by terrestrial and space telescopes and the data have helped to understand their nature and explain the unusual energetic processes occurring inside them. One of the most productive instruments in terms of the valuable knowledge it has generated about AGN is the 2.5 m diameter telescope that is part of the Sloan Digital Sky Survey (SDSS) project located in the Apache Point Observatory (Abolfathi, et al., 2018). In the last two decades, this project has led to an explosion of publications in astronomical research based on the enormous amount of free-access photometric and spectroscopic data it has provided.
Among these AGN galaxies, the Seyfert type ones are the most frequent (Veron-Cetty & Veron, 2006). They usually show spiral morphology with a particularly bright nucleus emitting high and low ionization emission lines similar to those found in supernova remnant and planetary nebulae. From the point of view of luminosity, Seyfert galaxies are defined as having low luminosity AGNs, with M B > -21.5 + 5 log(h 0 ), where M B is the absolute magnitude in the blue band and h 0 is the Hubble constant in units of 72 km s-1 Mpc-1 (Peterson, 1997). An additional characteristic is that the host galaxy is clearly detectable (Emerson, 1996).
Khachikian & Weedman (1974) proposed the existence of two types of Seyfert galaxies differentiated by the presence or absence of broad components in the permitted emission lines in their spectra. One type is known as Seyfert 1 (Sy1) galaxies, which show wide and narrow components in their lines, the latter being the only permitted ones. The other type is known as Seyfert 2 (Sy2) galaxies showing only narrow emission lines of all species with a continuum usually dominated by stellar absorption lines.
Broad emission lines are produced by the recombination of ionized gases such as H I, He I, and He II. The electronic density (N e ) of these gases is about 109 cm-3, high enough to suppress the forbidden lines (collisional excitation). Such gas aggregation is called Broad Line Region (BLR), which given its proximity (~0.01-0.1 pc) to accretion disks surrounding supermassive black holes, shows velocities (~AvFWHM) in the order of ~104 km s-1. Forbidden lines (such as [O III] λλ4959, 5007, [N II] λλ6548, 6584, and [S II] λλ6717, 6731) form in regions known as Narrow Line Regions (NLR) where electron densities are lower (102-6 cm-3), which are located at distances between 0.1 to 1 kpc from the accretion disk and exhibit velocities ranging from 102 to 103 km s-1 (Osterbrock, 1993; Osterbrock & Ferland, 2006).
It is commonly accepted that Sy1 and Sy2 galaxies are basically the same object; the difference resides in the orientation of the AGN with respect to the observer. An obscuring torus located between the NLR and the BLR absorbs the light coming from the BLR; if the orientation between the AGN and the observer is such that the torus does not hide the BLR, the observer identifies the object as a Sy1 galaxy, otherwise, the object is classified as a Sy2 galaxy (Antonucci, 1993).
Besides the broad and narrow emission lines, the spectra of some Seyfert galaxies display forbidden emission lines of high ionization states of atoms such as Fe, Ne, and Si. By high ionization, we mean ions with an ionization potential equal to or larger than 100 eV. These emission lines are called coronal lines (CLs), which arise from fine-structure forbidden transitions of excited states coming from highly ionized chemical species (Gelbord, et al., 2009). For this reason, CLs are also known as forbidden high-ionization lines (FHILs). The most common examples are [Fe VII] λλ6087, 5721, [Ne V] λ3425 and [Fe X] λ6374. It has been hypothesized that the mechanism required for the ionization of these atoms could be X-ray photoionization coming from an intense energy source, probably emitted by an accretion disk (Osterbrock, 1969; Cardona & Portilla, 2015) or, alternatively, the collision between high velocity clouds (Oke & Sargent, 1968; Viegas-Aldrovandi & Contini, 1989). In any case, the presence of CLs is considered a direct indicator of AGN activity, and they are not observed in starburst galaxies, or even in galaxies with Low Ionization Nuclear Emission Region (LINER).
Previous studies coincide in highlighting that there are relatively few objects presenting clear and detectable emission of CLs in Seyfert galaxies (Murayama & Taniguchi, 1998a; Gelbord, et al., 2009). It is well known that CLs are observed in both types of galaxies (Koski, 1978), although the Sy1 type ones have a higher probability of emission (Penston, et al., 1984; Murayama & Taniguchi, 1998a) and intensity (Crenshaw, et al., 1991) compared with the Sy2 type ones. When they are present, in the optical region, weak emission of [Fe VII] λ6087 can be observed, usually accompanied by an even weaker emission of [Fe VII] λ5721. There are two additional lines emitted by this ion with a lower presence in Seyfert galaxies' spectra: [Fe VII] λλ3759, 5158, for which it is quite unusual to find measurable emissions of these lines, this being an unfortunate fact given that their fluxes (along with those of the [Fe VII] λλ6087, 5721) allow to estimate ranges of temperature and electronic densities of the emission region by comparing them with the results of theoretical calculations, as we will see next.
Various researchers have studied the range of temperature and electronic density values in the light of some optical lines of Fe6+ theoretical flux ratios. Such studies set on calculations of collision strengths and emissivity ratios between the transitions within the 3d2 ground configuration of Fe VII. In particular, Nussbaumer & Storey (1982) presented graphs describing the behavior of flux ratios such as Fλ3759/Fλ6087 and Fλ5158/Fλ6087 when the electronic density ranged from 102 to 1014 cm-3 and the temperature varied from 8000 K to 120000 K. Some years later, Keenan & Norrington (1987) made slight modifications to those graphs and shortly later showed similar graphs normalized with respect not to Fλ6087 but to Fλ5721 (Keenan & Norrington, 1991). Although Keenan, et al. (2001) published new estimates of line ratios for the [Fe VII] using improved Einstein A-coefficients and impact excitation rates, some ratio values cast doubts on the validity of their results. Current reliable ratios of emission of Fe VII lines can be found in Berrington, et al. (2000) based on the results of computer codes employed in the IRON project (Dere, et al., 1997).
As shown in figure 1, the flux ratios, say with respect to λ5721, only permit the establishment of Te and Ne ranges of values and the same occurs regarding λ6087. However, if the fluxes of the four lines are known, it is possible to narrow the ranges of these physical values. Hence, it is more convenient to have Seyfert galaxies' spectra emitting simultaneously the four lines. An additional complication is that in Sy1 galaxies, which have a notorious presence of Fe1+ (Veron-Cetty, et al., 2004), the contamination due to [Fe II] λ5159 can cause that those ratios including the λ5158 line result in unusual values not predicted by the theoretical calculations. On the other hand, contamination of [Fe II] in Sy2 galaxies is smaller or nonexistent.
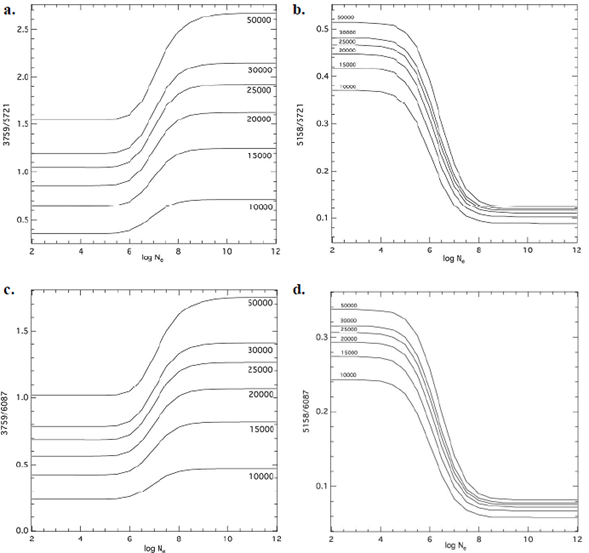
Figure 1 Theoretical ratios with respect to 5721 (above) and to 6087 (lower) in function of the temperature and electronic densities. Values from the IRON project (Dere, et al., 1997).
The region where the [Fe VII] lines are emitted, as well as other high emission lines such as [Fe X] λ6374, [Fe XIV] λ5309, etc., is known as the Coronal Line Region (CLR). The general consensus situates it between the BLR and the NLR, and some studies have identified the CLR as a region situated in the internal face of the obscuring torus (Pier & Voit, 1995), or at least as an important contributor (Murayama & Taniguchi, 1998a; Murayama & Taniguchi, 1998b) given the intense coronal emission observed in several Sy2 galaxies. In this respect, some observations have detected coronal emission far beyond the standard size of the torus (Mazzalay, et al., 2010; Rodríguez-Ardila & Fonseca-Faria, 2020) and theoretical studies have suggested it may happen even beyond (Korista & Ferland, 1989; Ferguson, Korista & Ferland, 1997). Evidently, the matter is far from being settled and inquiries about the physical conditions in Sy2 galaxies could help to clarify this aspect.
In this context, the main purpose of this study was to establish a uniform sample of optical spectra of Seyfert 2 galaxies with clear emission of Fe6+ in the four optical lines: [Fe VII] λλλλ3759, 5158, 5721, 6087, which allows to narrow down the range of values of temperature and electronic density of the coronal emission zone and, thence, to give additional elements to clarify the physical conditions of a coronal gas in these objects.
The sample
To construct a robust sample of Seyfert 2 galaxies, we implemented several SQL (Structured Query Language) codes for data release (DR14) query in the SDSS database. Basically, we utilized the following ratios: [O III] λ5007/Hβ>3, [N II] λ6584/Hα > 1/2, ([S II] λ6717 + λ6731)/Hα > 1/3, and [O I] λ6300/Hα > 0.06.
These values of the ratios are based on the well-known BPT diagnostic diagrams (Baldwin, et al., 1981) that conveniently allowed for selecting Sy2 galaxies from a homogeneous sample constituted by 497 SDSS objects and their spectra. Additional constraints were to pick up spectra with a signal-to-noise ratio higher than 10 and cosmological redshifts with z > 0.02 to guarantee the possible existence of the [Fe VII] λ3758 line in the spectral zone.
Then, we subjected the spectra we obtained to several procedures, such as redshift correction and galactic extinction, using the Image Reduction and Analysis Facility-IRAF (distributed by the National Optical Astronomy Observatories operated by the Association of Universities for Research in Astronomy, Inc., under a cooperative agreement with the National Science Foundation). Each spectrum was examined to determine the possible presence of the [Fe VII] X6087 line, which is the most conspicuous coronal line in the optical part of the electromagnetic spectrum. We observed that whenever this line is present, the [Fe VII] X5721 line is usually present too, although not so intense. The presence of the [Fe VII] X6087 was considered positive assuming a 3o detection level.
From the 497 selected objects, it turns out that 161 (32 %) showed the presence of [Fe VII] λ6087, a percentage that almost doubles the presence of Sy2 CL-emitters compared with the sample studied by Portilla (2012). We selected those objects with a clear emission of [Fe VII] λλλλ6087, 5721, 3758, and 5158, this last one being the most difficult to find in the 497 objects.
The number of Sy2 galaxies emitting the four lines of interest is notoriously small. Indeed, they were present only in 10 objects with the right conditions to obtain reliable flux measurements (3σ detection level). Careful visual inspection of each spectrum allowed to confirm the Seyfert 2 type for each object.
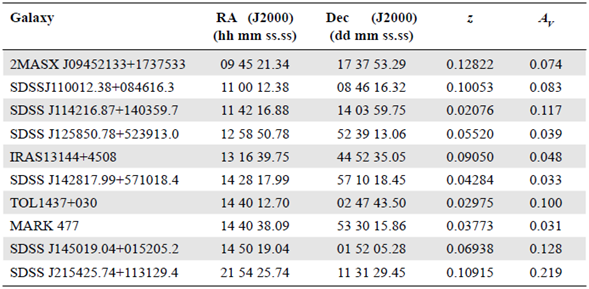
The names of the galaxies in our sample are listed in table 1 with their respective equatorial coordinates, redshifts, and foreground galactic extinction (all values were taken from the NASA/IPAC Extragalactic Database). It should not be surprising that all these galaxies exhibit a well-defined continuum in their spectra with no significant absorption lines due to the stellar population of the host galaxy (Figure 2).
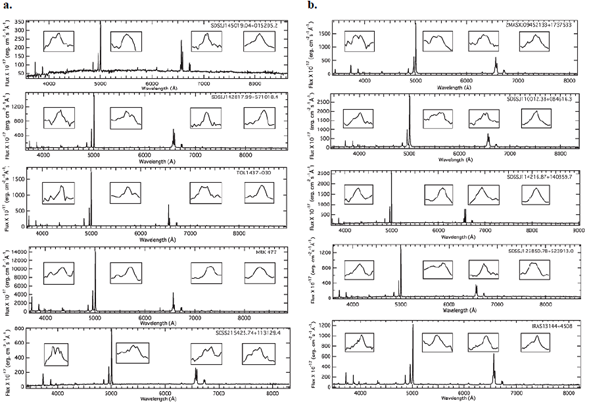
Figure 2 Spectra of the study sample. The insets in each spectrum show zoomed views of the lines of interest. From left to right: [Fe VII] X3758, [Fe VII] X5158, [Fe VII] X5721, and [Fe VII] X6087
We obtained the integrated flux of the lines of interest along with other forbidden and permitted lines assuming Gaussian profiles. We obtained the values of the Hα/Hβ ratio first to evaluate if it was necessary to correct by the internal extinction. However, except for the case of SDSS J145019.04+015205.2, this ratio in the sampled galaxies showed values between 3.1 and 4.6 indicating that the sample was not heavily reddened and, therefore, internal correction was not needed.
Results
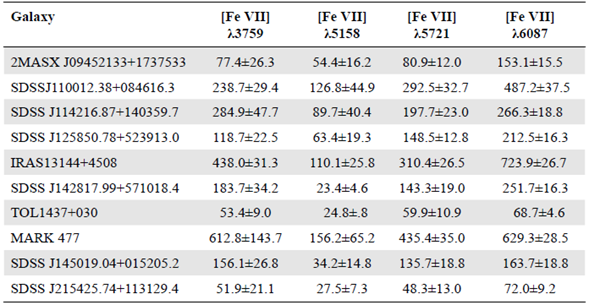
The emission line fluxes of various forbidden and permitted lines are shown in table 2 while the values of fluxes for the four forbidden Fe+6 emission lines are presented in table 3.
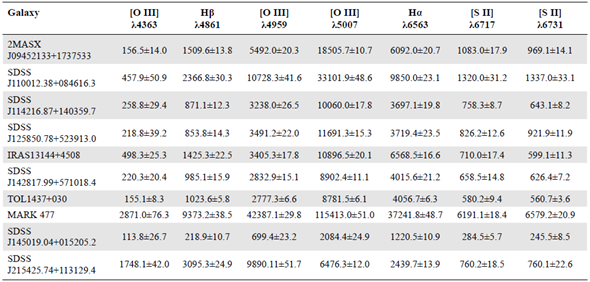
From these values, we obtained the required flux ratios for each galaxy. Values of the ratio Fλ3759/Fλ6087 were between 0.5 and 1.1 while the relation Fλ5158/Fλ6087 had a lower dispersion of values, most of them situated between 0.1 and 0.4. Similarly, the ratios Fλ3759/Fλ5721 and Fλ5158/Fλ5721 showed values concentrated between 0.8 and 1.4 for the first case and between 0.2 and 0.7 for the second case.
The values of these ratios were situated in the four theoretical graphs (Figure 1). Then, we delimited an electronic temperature and density range for each emitter object to establish the range of T e and N e values of the coronal emission region by comparing the values given by the graphs. The values of these physical quantities are shown in table 4 discriminated when they are found with respect to [Fe VII] λ5721 (third column) and [Fe VII] λ6087 (fourth column). Except in two or three cases, the range of values of electronic temperature and density were practically the same.
Regarding the electronic temperature, the Fe+6 emission region seemed to be concentrated between 12000 and 30000 K with few objects reaching as high as 55000 K. Unfortunately, values of electronic density for the majority of cases can only be established as upper limits although they seem to be around 105 to 107.5 cm-3.
The electronic density and temperature values obtained using this method for Seyfert galaxies are scarce in the literature. This is further aggravated by the fact that these values tend to present wide ranges of uncertainty. Colina, et al. (1991) obtained T e < 105 K and N e < 108 cm-3 for IC 5063 (Seyfert 2); González & Pérez (1996) found 30000 < T e < 120000 K and 107 < N e < 109 cm-3 for NGC 4253 (Seyfert 1). Slightly more defined values were reported by Komossa, et al. (2009) with electronic temperatures ranging between 15000 and 50000 K and electronic densities in the order of 106-7 cm-3 for SDSSJ0952+2143, although it should be noted that the high intensity of coronal emission detected in this object seems to be associated more with a transitory event than with the existence of an AGN itself residing there.
On the other hand, theoretical studies have been conducted to obtain the physical conditions of the coronal emission zone by using photoionization codes. Using CLOUDY, a well-known photoionization code, Ferguson, et al. (1997)) obtained an ample range of values for the CLR: temperatures between 1.2 and 15x104 K and densities between 102108.5 cm-3; they obtained these results by using an ionizing continuum typical for a Seyfert galaxy (combination of a UV bump plus an X-ray power law). Utilizing the same code, Murayama & Taniguchi (1998b) reported more constrained values with an ionizing continuum consisting only of power laws combinations: a temperature of a few 104 K and densities in the order of 106 cm-3, which are rather similar to those we report here.
In this same sense, in their study of various objects with intense coronal emission, Rose, et al. (2015) used the "power law" command in CLOUDY as the ionizing continuum. To explain the observed emission they obtained values of the electronic densities in the range of 104.5 to 106.5 cm-3, which requires relatively high values of the ionization parameter (U~10-0.5-10-1.0) and, hence, distances from the ionizing source ranging from 0.04 to 32 pc.
As we had spectra with flat continuums and good signal-to-noise ratio, and all of them presented the [S II] U6717, 6731 and [O III] λλλU4363, 4959, 5007 lines, we calculated the values of electron density and temperature for the NLR gas to examine the relationship between the physical values found for this region and the CLR. We used the FIVEL program (De Robertis, et al., 1987) that determines the physical conditions of nebulae utilizing input flux values of a fair number of emission lines.
For the NLR we obtained values of electronic temperature ranging from 11000 to 30000 K and electronic densities in the range of 102.5 to 103 cm-3 (Table 4), which is characteristic for this zone. Compared with those obtained for the CLR, these values are obviously higher, but not significantly, at least as far as the temperature is concerned. The temperature ranges found with the ratio related to the [Fe VII] λ5721 line suggest a linear correlation (r=0,61) between both values of temperature as shown in figure 3 (above, left), however, a possible linear correlation for the ratio with respect to [Fe VII] λ6087 was no longer so evident (r=0,10; above right). Since it is reasonable to assume that the CLR is closer to the source of photoionization, such behavior seems to indicate that, for the same object, the higher the NLR temperature, the higher the CLR one, which is reasonable if a kind of physical connection between both emission zones is assumed.
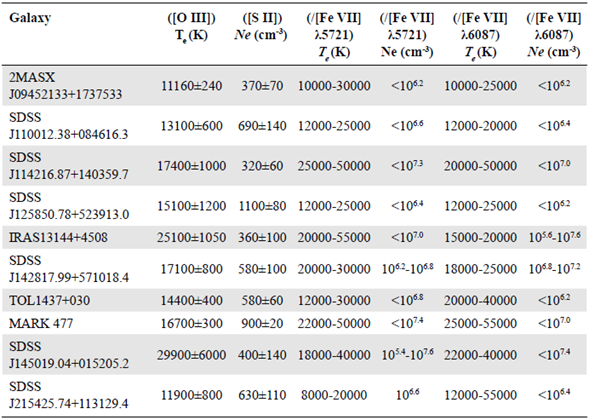
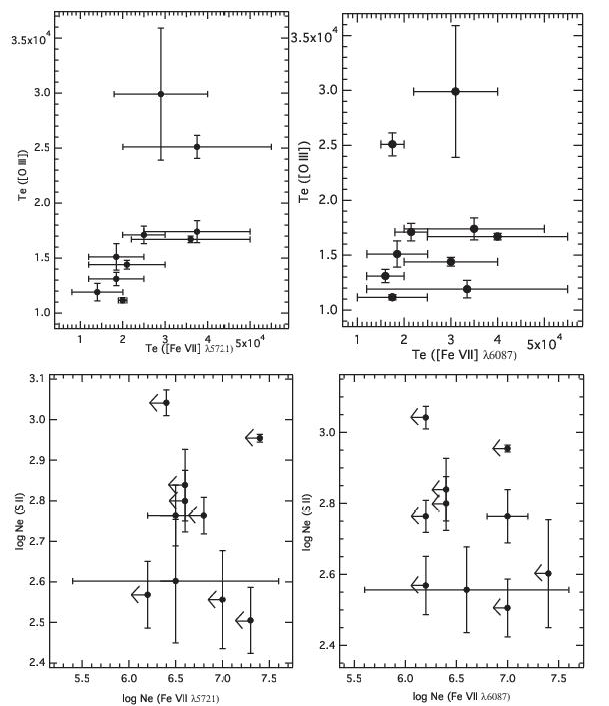
Figure 3 Relation of physical conditions between the NLR (ordinate) and the CLR (abscissa): electronic temperature (above) and electronic density (lower). Error bars for the CLR data correspond to the ranges of the values; dots indicate the mean value.
However, a possible relationship of both regions was not found between the values of the electronic density (Figure 3, lower). The CLR electronic density values were around a thousand times greater than that of the NLR, but finding a connection between the values of electronic densities for the two zones is not so direct using these lines given the great difference between the critical densities of these particular emissions: that for [S II] is equal to 3x103 cm-3 while for the [Fe VII] is of the order of 107.6. The possible correlation that seems to exists between the CLR and the NLR electronic temperatures may be explained by the fact that the critical densities of the [O III] lines are higher (3.3x10⁷ for [O III] λ4363 and 7X105 cm-3 for [O III] λ5007) than those of the [S II] ones and, therefore, they do not suffer collisional de-excitation in relatively high-electron density regimes.
Based on the above-mentioned ranges, we suggest that the ionization mechanism dominating the CLs emission in Sy2 galaxies is the photoionization of the gas situated in the NLR inner sectors. This would explain the presence of relatively strong CLs in the spectra of this type of object as the emission of high ionization lines occurs mainly in regions a little beyond the obscuring torus which, in its turn, could explain the observed narrowness of these lines (Portilla, 2012). Since there are solid indications that the CLR is located in the inner zone of the obscuring torus and it is possible that the same face of the obscuring torus reflects the emission (Rose, et al., 2015; Glidden, et al., 2016), our work supports the idea that Sy1 objects with strong CL emissions are different from Sy2 with similarly strong CL emission, which may be explained by different mechanisms (Rose, et al., 2015).
On the other hand, by placing our objects of study on the BPT diagnostic diagram (Baldwin, et al., 1981), we observed that the Sy2 galaxies with notable coronal emission are located in a defined region, which should not be surprising, as it is a consequence of the search system executed through the SQL sentences, as seen above. The interesting thing is that such galaxies are located in a narrower range between the following intervals: 0.8 < log [O III] λ5007/Hβ < 1.2 and -0.5 <log [N II] λ6584/Hα< 0.0 (Figure 4), that is, in a region located in the upper left corner that tends to distance itself markedly from the area where most of the Sy2 galaxies are concentrated. A similar behavior, though more noticeable, was observed by Rose, et al. (2015) (circles in Figure 4) when studying a sample of seven AGNs which they called Coronal-Line Forest AGN (CLiF AGN) due to their exceptional coronal emission. It is evident that this can be used to improve searches of this type of object that had gone unnoticed until now.
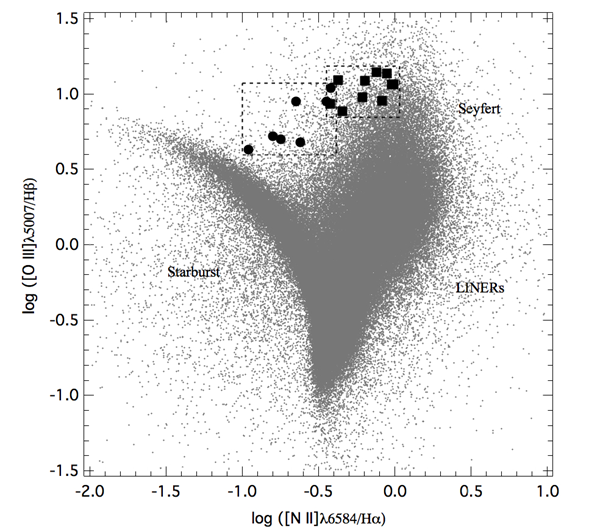
Figure 4 Diagnostic plot of log([O III] X5007/HP) versus log([N II] X6584/Ha). The objects of our sample of Sy2 galaxies are indicated by the squares; compare with the sample of Rose, et al (2015) (circles). Small points represent objects taken from the SDSS-DR11 release.
Conclusions
By implementing SQL statements and based on the regions covered by the BPT diagnostic diagrams, it was possible to select a significant sample of Seyfert 2 galaxies (497 optical spectra) from a homogeneous source. This allowed us to identify and detect the emission of coronal lines and consolidate a spectral sample of 10 Sy2 galaxies (superior to those reported in the literature) where simultaneous emissions from the four lines under study [Fe VII] λλλλ3759, 5158, 5721, and 6087 were detected; likewise, we determined the values of the fluxes of each line.
By determining the flux ratios: Fλ3759/Fλ5721, Fλ3759/Fλ6087, Fλ5158/Fλ5721, and Fλ5158/Fλ6087, we were able to constrain density and electronic temperature ranges of the coronal emission zone and we observed that the vast majority of objects had a T e between 12000 and 30000 K and a N between 105 and 1075 cm-3. These ranges are consistent with the theoretical value of a photoionized gas and are rather similar to the values that Murayama & Taniguchi (1998b) obtained from theoretical models, which set an upper bound of 107.5 cm-3. Our results for electronic densities were more consistent with those of Rose, et al. (2015), whose theoretical values ranged from 104 5 to 106 5 cm-3.
On the other hand, there seem to be indications of a possible relationship between the CLR electronic temperature and that of NLR suggesting the existence of a temperature gradient within the emitting gas. We did not observe a similar relationship for the electronic density, but it cannot be ruled out since our study rests on the use of lines ([S II]) with low critical densities. Our results open new research possibilities in terms of the exploration of the physical mechanisms of FHILs production and CLR spatial extension.

