


 Inglés (pdf)
 Articulo en XML
 Referencias del artículo
 Enviar articulo por email
 Citado por SciELO
  Citado por Google
  Similares en
SciELO
Similares en
SciELO  Similares en Google
 Permalink
Introduction
Taking into account that Colombia and Brazil, two tropical countries in South America, are the main coffee producers of the continent (third and first world producers of coffee, respectively), and taking advantage of an existing agreement between the Federal University of Vicosa, Brazil (UFV), and the National University of Colombia (UNAL), this research sought to contribute to the study of bioclimatic architecture in the agro-industrial sector, considering all the negative effects that thermal stress can generate in workers as well as the scarcity of studies that analyze such conditions in agro-industrial buildings. In accordance with the above, this work aimed to evaluate thermal conditions inside three buildings for wet coffee post-harvest handling in Colombia, and their effect on the level of thermal stress in workers; to the effect, this study was carried out in collaboration between the UFV and the UNAL
Studies about environmental conditions suggest that the microclimate inside coffee processing buildings and storage units not only may affect the quality of coffee (Osorio et al., 2015), but it can also influence the productivity of workers and the quality of their labor (Revueltas et al., 2015), as well as the concentration of people (Viloria et al., 2016).
In Colombia, coffee processing is carried out in humid conditions (Lee et al., 2015), where water is used to pulp coffee cherries in order to remove the exocarp and mesocarp. Subsequently, the mucilaginous layer surrounding the seeds is removed through a natural fermentation or a mechanical process, then it is washed and a hydraulic classification is carried out to finalize with grain drying (Osorio et al., 2016; Osorio et al., 2019), which can be solar or mechanical; 70% of the coffee produced in Colombia is mechanically dried (González et al., 2010). According to different studies, facilities of this type have dryers located in the same buildings where wet processes are performed, characterized by being closed, with some openings for ventilation (Osorio et al., 2015; Osorio et al., 2016).
In buildings for wet coffee processing in Colombia, with drying machines inside (Ciro Velásquez et al., 2011), heat and vapor emissions are generated, which can heat and moist said facilities when they cannot be transmitted to the outside (Osorio et al., 2016); this may jeopardize the workers' health and their productivity, as well as coffee quality (Oliveros et al., 2013). These unfavorable environmental conditions, combined with heavy physical work, such as those developed in these buildings, can produce thermal stress, resulting in the weakened general state of health, changes in psychosensory reactions, and fall in production (Lamberts et al., 2008).
According to Rivero (1986), there are several factors involved in the production of heat in human beings, such as sex, age, degree of acclimatization to the environment, but mainly any physical activity performed. The thermal overload varies from one activity to another, depending on the metabolic activity and physical effort involved in the work (Carvalho, 2011; Bitencourt et al., 2012; Todd & Valleron, 2015).
According to Iida (2005), temperature differences that occur in the same environment should not exceed 4°C. In addition, environmental temperature that exceeds 30°C increases the risk of damage to the worker's health.
In order to evaluate human performance in the workplace under conditions of exposure to heat, the Wet Bulb Globe Temperature (WBGT) index has been used as established by standards, such as Resolution 2400 of 1979 to establish some provisions on housing, hygiene, and safety in the workplace in Colombia (Ministerio de Trabajo y Seguridad Social de Colombia, 1979), the International Standard ISO 7243 (2017) to estimate the heat stress of workers (International Organization for Standardization, 2017), and the regulatory standard of the Ministry of Labor and Employment of Brazil-NR 15, Annex No. 3 (Ministério do Trabalho e Emprego, 2011).
There are few studies related to the effect of heat and/or humidity on agro-industrial workers (Herrera et al. 2015); for example, there are studies about sugar cane harvest workers (Roscani et al. 2017), workers of a corn-based food processing company (Herrera et al., 2015), workers in chicken sheds (Carvalho et al. 2014), and workers in the cold pork meat industry (Evangelista & Borges, 2015). Most bioclimatic studies and research have been carried out in urban areas, which is why at the moment there are no studies applying the WBGT index in buildings for post-harvest processing of coffee.
A bioclimatic design seeks to achieve high-level thermal comfort by adapting the geometry, orientation, and construction of the building to the climatic conditions of its surroundings, by means of elements and specific constructive solutions (Lamberts et al., 2014)
Methodology
To carry out this study, three buildings for wet processing of coffee were selected, called Building 1, 2, and 3.
To make this selection, similar characteristics were considered, such as geographic and climatic conditions. All of them are close to the city of Medellín, Antioquia, Colombia (north of the city), and their exact locations are as follows: Building 1: city of Barbosa, N06° 24'47.64", W75°20'47.08", 1508 m; Building 2: city of Bello, N06° 21'42.16", W75° 34'44.83 ", 1698 m; and Building 3: city of San Roque, N06° 29'22.79", W75° 00'41.86", 1435 m, all with external average temperature between 20 and 22 °C (IDEAM, 2019). Other similar climatic characteristics that correspond to humid tropical climate (Af) according to the Köppen classification system (Kottek, 2006) were also considered, such as same production volume of 30 tons of parchment coffee per year (1 50 tons of coffee cherry per year, 1125 kg dry parchment coffee per day), mechanical drying, and maximum production period between October and November, which coincides with the second rainfall season in this region of Colombia (Oviedo & Torres, 2014).
Since harvest occurs in rainy seasons, the warmer period was not taken into account in this case, since there is no activity inside the facilities then. For this reason, only the main harvest period was analyzed, which shows a longer occupation time during the second harvest of the year.
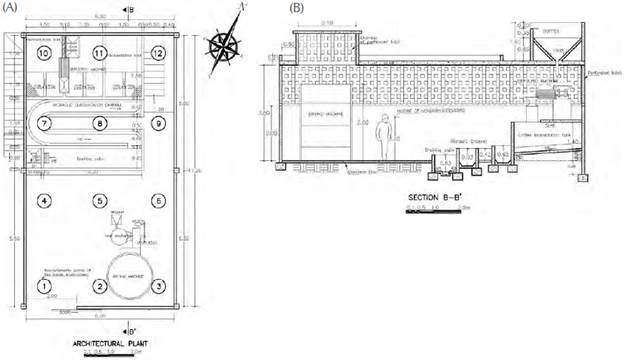
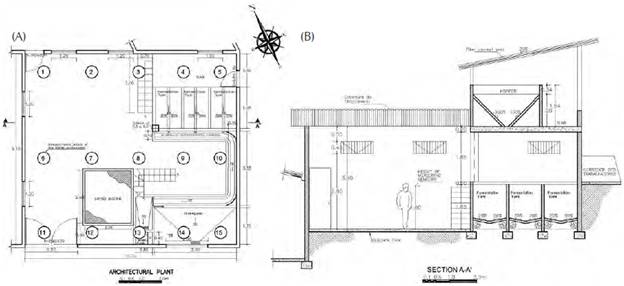
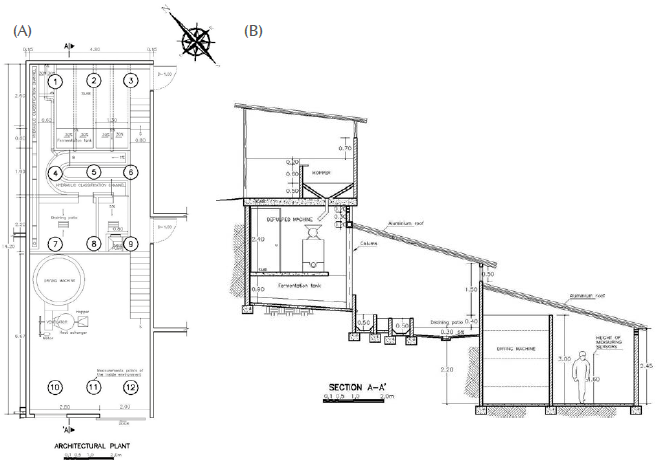
Figures 1(A), 2(A), and 3(A) show the architectural plans of Buildings 1, 2, and 3, respectively, and the distribution of measurement points in the inside environment (in circles) of the three facilities for wet coffee processing. Figures 1(B), 2(B), and 3(B) show their cross-section plans.
Source: Authors.
Figure 1 Building 1. (A) Distribution of measurement points (in circles) in the architectural plan; (B) Cross-section plan.
Building 1 consists of one level of 6.0 m (W) x 11.0 m (L) x 3.50 m (H). Its walls are made of brick 0.15 m thick, at a height of 2 m, and there are perforated bricks for ventilation at 2 to 3.5 m, where they meet the slab that constitutes the roof, which has a thickness of 0.20 m, lightened with bricks. On the slab, there stands a kind of chimney on the dryer and the dry hopper. The concrete floors in sight, the lower part of the hydraulic classification channel, as well as the interior of the fermentation tanks have tile coating. There is a structure formed by columns and concrete beams (Figure 1).
Building 2 has two floors; most of the coffee processing is done on the first floor, while the reception of coffee cherry takes place on the second floor (in a hopper). The first floor is a plane of 9.10 m (W) x 10.05 m (L) x 3.60 m (H), with brick walls of 0.15 m thick, with a layer of mortar at a height of 2 m inside. It has a lightweight slab roof with bricks that has a thickness of 0.20 m, at a height of 3.80 m, which covers a good part of the installation area. Part of the workers' house is built on this slab, and has an area dedicated to the dry hopper. The rest of the roof is a fiber cement roof, supported by a metal frame at a height of 3.50 m, of which a species of chimney stands out on the dryer. The floors have concrete lining, and tile floors in the lower part of the hydraulic classification channel and the fermentation tanks. The structure consists of columns and concrete beams to confine walls, and metal reinforcements to support the roof. Its openings for natural ventilation are composed of three doors and six Windows (Figure 2).
Source: Authors.
Figure 2 Building 2. (A) Distribution of measurement points (in circles) in the architectural plan; and (B) Cross-section plan.
Building 3 has a rectangular plant of 5.10 m x 14.52 m, divided into three grades to adjust to the terrain slope in a staggered way with roof heights of 2.40 m, 1.90 m and 2.45 m, in ascending order. It has brick walls of 0.15 m thick, covered with a mortar of 0.02 m thick and white tile. The roof is aluminum in the lower part and slab in the upper part, lightened with brick, with a thickness of 0.20 m; there is a dry hopper on this slab (Figure 3). The floors are concrete lined with ceramic tiles. It has openings that take advantage of the unevenness of the facility beyond the access door on the highest level and the gate of the lowest level. The structure consists of columns and concrete beams.
Source: Authors.
Figure 3 Building 3. (A) Distribution of measurement points (in circles) in the architectural plan; and (B) Cross-section plan.
Data were experimentally collected (temperature, relative humidity, and WBGT) for three days in each building between October and November 2016, as follows:
Building 1: 25, 26, and 27 of October 2016.
Building 2: 1, 2, and 3 of November 201 6.
Building 3: 9, 10, and 11 of November 201 6.
The thermal comfort assessment was carried out based on two aspects: mapping of the temperature and relative humidity present in the facilities, and the WBGT index, the latter according to Resolution 2400 of 1979, issued by the Ministry of Labor and Social Security of Colombia, and to NR 15 (Ministério do Trabalho e Emprego, 2011), for evaluation of the thermal environment of workers exposed to heat.
Mapping of the temperature and relative humidity
In the three buildings, dry-bulb temperature (Tdb) and wet-bulb temperature (Twb) were measured using a Delta OHM digital thermometer, model HD 32.1 (f) (-40 ≤ Tdb ≤ 100°C, 4 ≤ Twb ≤ 100°C). These measurements were taken during working hours (from 7 am to 7 pm), measured at the level of the head of the worker (1.60 m, indicated in Figures 1 (B), 2(B), and 3(B)), with intervals of one hour, in different points distributed in each building, as indicated in Figures 1 (A), 2(A), and 3(A). By means of these data, the values of relative air humidity in each point were extracted with the help of a psychrometric chart.
Based on the average data of temperature and relative humidity at each point, a mapping was made to analyze the thermal environment of the three buildings.
The results were compared with ranges of air temperature and relative humidity recommended for healthy work environment by the Ministry of Labor and Social Security of Colombia (Ministerio de Trabajo y Seguridad Social de Colombia, 1979), which are between 14 °C and 25 °C and between 30 % and 70 %, respectively.
To complete the analysis, the equation of Osorio et al. (2019) (Equation 1) was applied to determine the area of natural ventilation for the buildings with the benefit of coffee with drying machines inside, which is shown below:
NVAm = 1.0DP/100 [Eq. 1]
Where:
NVAm: Minimum area of natural ventilation (m2).
DP: Drying capacity (kg of coffee parchment per day).
WBGT index
Measurements of the WBGT index were also performed during working hours, manually, at intervals of one hour, in different points distributed in each installation, as indicated in Figures 1(A), 2(A), and 3(A), at the level of the worker'shead (1.60 m, as indicated in Figures 1(B), 2(B), and 3(B)), by means of a digital WBGT thermometer of the Delta OHM brand, Model HD 32.1 (f). WBGT data were also collected inside the coffee drying machines at the time when the machines were opened, to get an idea of the environment when workers enter to descend coffee layers. The WBGT index values provided by the equipment were obtained from measured values of globe temperature and wet-bulb temperature, and further processed, according to Equation 2, by the equipment software. Equation 2 is suitable to evaluate internal environments (without solar charge), according to NR 15, Annex No. 3 (Ministério do Trabalho e Emprego, 2011):
WBGT = 0,7Tbn + 0,3Tg [Eq. 2]
Where:
Tbn: natural wet-bulb temperature, °C
Tg: globe temperature, °C
Metabolism rates (M) are referred in Table 1. Workers' tolerance limits for heat exposure in intermittent works with rest periods at the work-place in terms of WBGT (°C) are indicated in Table 2.
Table 1 Metabolic rates by type and activity.
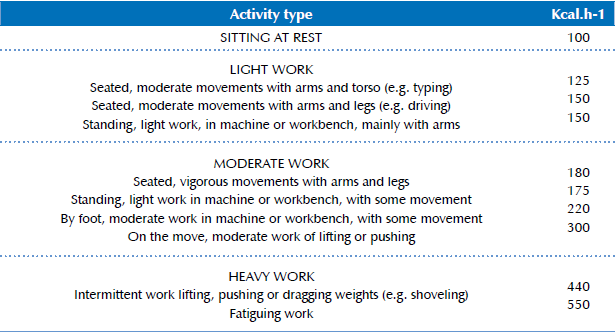
Source: NR 15 (Ministério do Trabalho e Emprego, 2011).
Table 2 Tolerance limits for heat exposure in intermittent works with rest periods at the workplace in terms of the WBGT index (°C).
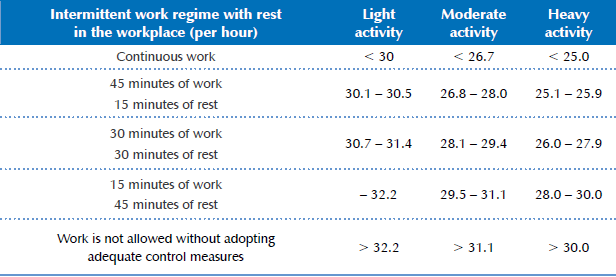
Source: NR 15 (Ministério do Trabalho e Emprego, 2011).
Finally, a box plot was developed to analyze the distribution of WBGT data in the studied facilities.
To complement these measurements, temperature and external air relative humidity data were also taken into account, collected by a meteorological station of Decagon Devices, Inc., com-posed by an Air Temperature Sensor, measuring ranges between -40 °C and 80 °C with a resolution of 0.1 °C, as well as a Relative Humidity Sensor, with a measurement range from 0 to 100% RH, among others. All weather station sensors were connected to an Em50 data logger (Decagon Devices, Inc.), programmed to collect data every 5 minutes for 3 continuous days on each farm.
Results
Mapping of the temperature and relative humidity
Figure 4 shows the temperature (A) and relative humidity maps (B) of the three buildings.
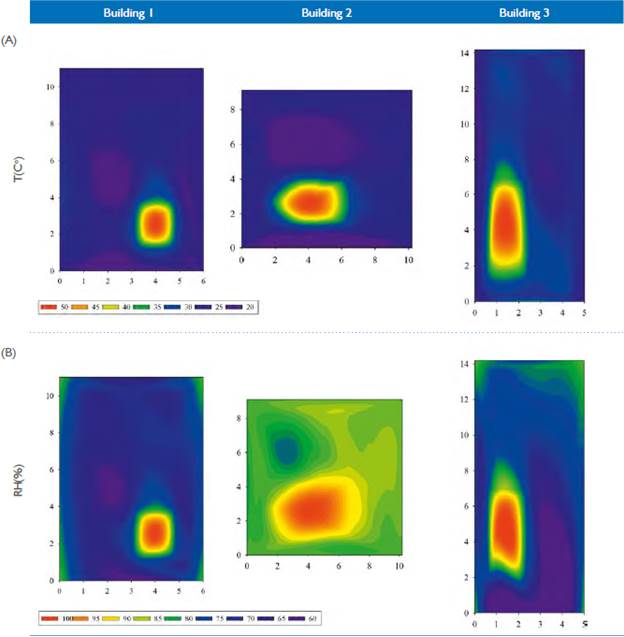
In Building 1, Figure 4(A) shows that temperature drops from 30°C in the immediate surroundings of this machine and the heat exchanger to 20°C in the colder points. The latter are influenced by the air entering through the access gate. In Building 2, temperatures ranged between 20°C and 30 °C in most of its area. The natural ventilation had an effect on the cooler areas because air enters through the Windows and the cracks in the doors. By having openings located on the four faces of the construction, constant cross ventilation is generated. In Building 3, temperatures were between 25 °C and 35 °C, predominating those near 35 °C.
Figure 4(B) shows the relative humidity map in Buildings 1, 2, and 3. The relative humidity of Building 1 is between 60 and 75%, with zones with closest values to 60% that are influenced by the air entering through the access door; the zones with values close to 75% are close to the walls of the installation and to the drying machine. Relative humidity values higher than 75% are mainly in the drying machine zone, since it is a steam emitter during coffee drying.
Building 2 has zones with the highest values of relative humidity, predominantly between 80 and 85 % (Figure 4(B)); the highest values were found in the drying machine zone, due to the fact that it emits vapor that is product of the coffee drying process.
Something similar happens in the area of the coffee dryer in Building 3, where the highest values of relative humidity are between 80 and 100 % according to the map shown in Figure 4(B). However, in the rest of the installation, relative humidity ranges from the lowest level with 60 %, between 60 and 75 % at the intermediate level, and between 75 % and 85 % at the highest level.
WBGT index
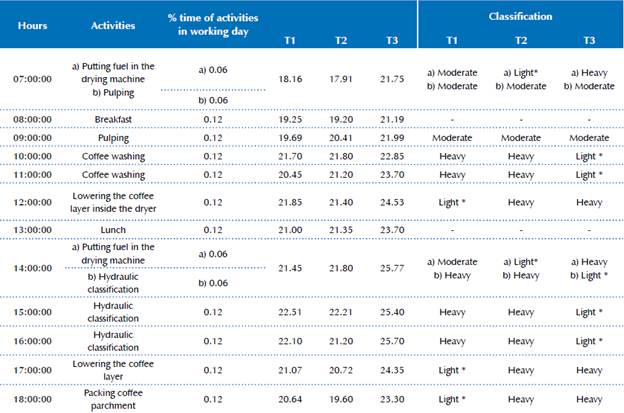
Table 3 shows the results of the WBGT measurements performed during the main activities of wet coffee processing. The list of main activities follows the order in which they are generally performed during a full working day in the three buildings. It also shows the percentage of time of each activity with regard to the total hours of the working day (12 hours).
Table 3 Mean values of the WBGT index collected in three buildings for wet coffee processing, by activity, and limits for WBGT according to NR 15 (2004).
Source: Authors.
T1 = Building 1; T2 = Building 2; T3 = Building 3; * = Fully automatic process.
According to Table 1, most of the listed activities were classified as heavy. Nevertheless, most of the WBGT values found in the three buildings, for both heavy and moderate activities, did not exceed the limit values in Table 2, except for Building 3 with the activity of putting fuel in the drying machine.
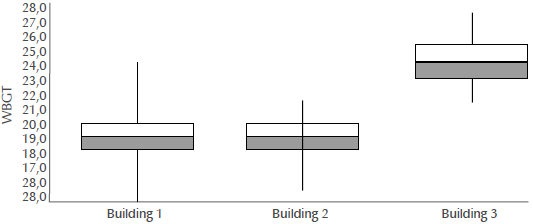
Figure 5 presents a box plot showing the behavior of the WBGT index in the three buildings for wet coffee processing, during the days of data col-lection. Building 3 was the only edification that exceeded its WBGT limit.
Source: Authors.
Figure 5 Box plot for the WBGT index in the three facilities for wet coffee processing.
It is observed that the median of Building 3 was 24.7°C, higher than the medians of both Buildings 1 and 2, which is 20.7°C. The minimum temperature of Building 3 was 22.3°C, and the maximum was 27.3 °C, showing the lowest data dispersion of the three buildings and greater thermal stability, but in values it is warmer than the other two facilities.
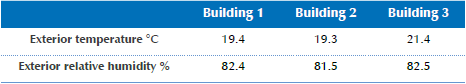
Table 4 shows mean external temperature and relative humidity measured by the weather station for three days.
Table 4 Mean external temperature and relative humidity measured by the weather station for three days.
Source: Authors.
On the other hand, the WBGT index inside the coffee drying machines of the three buildings was analyzed during the activity of lowering layers of parchment coffee inside the machine, since it is the only workplace with direct expo-sure to the high temperatures generated by the machine. Building 1 is the only one where this process is automatic, but the analysis was also performed here for comparison purposes with the other installations.
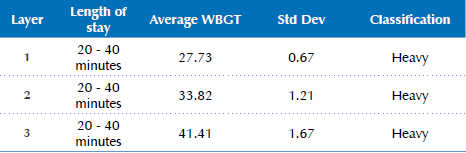
Table 5 shows the mean values of the WBGT index in the three buildings, collected during the activity of lowering layers of parchment coffee inside the machine, and WBGT classification according to NR 15 (Ministério do Trabalho e Emprego, 2011). During this activity, workers are subjected to temperatures so high that all WBGT index values exceeded the limits contemplated in Table 2.
Discussion
Mapping of the temperature and relative humidity
In the three buildings, differences can be observed between temperatures found in the indoor environment, which exceeded 4°C, contrary to the one recommended by Iida (2005).
However, in Buildings 1 and 2, the lower temperatures found, predominantly between 20°C and 25°C, are temperatures recommended for workers with higher physical requirements than sedentary ones, between 14 °C and 25 °C (Ministerio de Trabajo y Seguridad Social de Colombia, 1979). Building 3 represented the critical case, with temperatures above the recommended temperature, predominantly around 30°C, which can affect the workers' health, decrease their degree of concentration, and increase the frequency of errors and accidents, which leads to a greater necessity to increase the frequency of breaks and their duration in work (Iida, 2005).
This behavior, analyzed from the point of view of natural ventilation, is related to volume control, the ventilation area, and the way in which it is carried out in each building.
Buildings 1 and 2 have sufficient height and ventilation area to maintain most of the space within the recommended temperature range, which, in addition to having openings in all their facades and even in the roof over the dryer, facilitates cross ventilation and chimney effect, helping to evacuate the heat generated inside by the drying process.
Building 3 has minor heights, with a staggered configuration, with openings formed by its own unevenness, projected in the opposite direction to the flow of hot air in the interior (from the lower to the upper level). Due to a smaller space, where the position of the openings does not allow the evacuation of hot air, hindering thus cross ventilation, this is the building that presents higher temperatures in all its areas.
It is recommended for this building to raise the height of the roof, and to install ventilation skylights in the roof above the drying machine, in order to favor the evacuation of heat and steam through ventilation.
Analyzing this behavior from the point of view of materials, higher temperatures in Building 3 are also product of a greater thermal resistance in its walls, constituted by three layers of materials, which hinders the dissipation of the internally generated heat towards the outside, compared to Buildings 1 and 2, with most of their surfaces being barely visible brick.
Taking into account that the average temperature inside these buildings is higher than the external temperature (Table 5), due to the large amount of heat generated in the inside, it is recommended that the envelope of this type of buildings have low thermal resistance. It is also advisable to install thermal bridges in the area surrounding the drying machines, especially around the heat exchanger, in order to facilitate the loss of heat to the external environment and seeking to standardize a little the internal temperature.
To analyze the behavior of relative humidity it is necessary to emphasize ventilation. With relative air humidity values recommended for workers between 30 % and 70 %, where the physical requirements of the worker population are higher than the sedentary ones (Ministerio de Trabajo y Seguridad Social de Colombia, 1979), Building 1 is closer to meeting these requirements than Buildings 2 and 3, Building 2 presenting the most critical case.
The ventilation area of the three buildings is 13 m2, 7.1 m2, and 3.2 m2 for Buildings 1, 2, and 3, correspondingly. According to Osorio et al. (2019), the minimum area of natural ventilation for the evacuation of steam and heat in buildings for wet coffee processing with drying machines in their interior is equal to the drying capacity of the machine (kg of dry parchment coffee per day) divided by 100.
Taking into account that the drying capacity of the machines in the studied buildings is 1125 kg of dry parchment coffee per day, for our case the required minimum area of natural ventilation is 11.25 m2; this condition is only met in Building 1. This insufficiency in the area of natural ventilation contributes to Building 2 becoming more humid, followed by Building 3, which, although it has a ventilation area, does not have the worst relative humidity condition due to its higher temperature.
According to Osorio (2019), in order to improve the hygrothermal conditions of Buildings 2 and 3, it is recommended to increase the natural ventilation area by 4.15 m2 for Building 2, and by 8.05 m2 for Building 3.
WBGT index
Building 3 presented the highest WBGT values, possibly because in this installation registered temperatures are higher than 25 °C, in a range of 30 °C and 35 °C in most areas. The highest value of the index was recorded during the activity of putting fuel in the drying machine at 2:00 p.m., where the WBGT limit was exceeded according to Table 2. In addition to performing this task in the hottest external hours when heat and humidity emissions had already accumulated inside the plant due to mechanical drying, in Building 3 fuelwood is used as fuel, compared to the same activity in Buildings 1 and 2, classified as moderate and light, respectively, where the fuel used is coffee husk and gas.
This situation in Building 3 is also due to problems of volume control, ventilation, and the materials described in the session of temperature and relative humidity mapping. Although the activity of putting fuel in the drying machine constitutes barely 12 % of the working day, the same recommendations mentioned in said session are applicable for improving thermal comfort.
The hydraulic classification activity, which also exceeded the WBGT limit temperature in Building 3, was not considered representative because it is an automatic process performed without any workers being present.
In relation to the WBGT index inside the coffee drying machines, the temperatures inside the dryer are relatively constant, with differences from one coffee layer to another, increasing in descending order from the top coffee layer to the bottom one (25 to 30 °C at the top layer outlet, and 40 to 50 °C in the lower layer). The opposite happens to humidity inside the machine, where the coffee in the upper layer is always the wettest, because it is the first layer that enters the machine that keeps the upper layer with greater humidity, which decreases as the layers go down (90-100% in the top layer, and 20-30% in the lower layer).
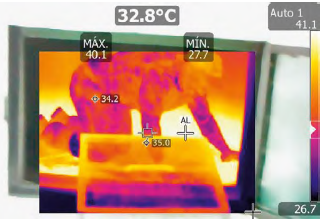
Figure 6 presents a thermographic image of the worker's activity in the lower layer in the drying machine during the WBGT data collect in Building 3. Using a thermographic camera, it was possible to observe a maximum temperature of 41.1 °C, considering that the machine was turned off during the lowering of the coffee layer, and the worker did not wait for a reasonable time to get lower temperatures.
Source: Authors (2016).
Figure 6 Thermographic image inside the coffee drying machine in the activity of lowering the layers of parchment coffee, in Building 3.
The Ministry of Labor and Social Security of Colombia (1979) recommends to adapt suitable reflective and heat insulation devices in work-places with heat sources, such as incandescent bodies and high-temperature furnaces. In addition, workers must wear appropriate protection against radiation from any source of heat that is likely to affect health.
Couto (1996) proposes the following measures: interposition of a polished metal barrier between the source of radiant heat and the worker, in order to get away from the source of radiant heat, ventilation, hydration, suitable clothing, and glasses with infrared filter.
Herrera et al. (2015) suggest modifying the building design in order to achieve minimum conditions of thermal comfort, when it is difficult to change working and rest times.
It may also be recommendable to check that the drying machines have no radiation leakage, which might occur through the doors, joint points or holes, which is important both for thermal comfort and energy efficiency in the drying process.
Regarding the analysis inside the coffee drying machines, and the activity of lowering the coffee layer, which represents a great percentage of the work schedule according to Table 3 (24%), it is important to urgently apply the measures included in the norm of Ministry of Labor and Social Security of Colombia (1979), concerning the protection of workers in relation to sudden changes in temperature and excessive humidity. Additionally, it also recommend to grant periodic breaks or relief to workers who work in high-temperature conditions.
Similarly, in this case, it is possible to propose to wait until the temperature of the machines decreases sufficiently so that it does not affect the workers' health. In the long term, the process of mechanical drying should be automated, to avoid risks to the workers' health when entering the machine that is still hot in the inside.
Conclusions
Heterogeneities were observed regarding thermal comfort and relative humidity inside Buildings 1, 2, and 3, with temperature values within the recommended ranges inside Buildings 1 and 2, and outside Building 3, while the recommended range for relative humidity was exceeded mainly in Building 2, followed by Buildings 3 and 1, in that order.
This situation was mainly determined by the generation of heat and steam from the dryer, by ventilation in relation to volume control, ventilation area, and the way in which it is carried out, as well as by the thermal resistance of building materials.
Building 1 had the best hygrothermal behavior due to its cross ventilation and chimney effect on the dryer, through a ventilation area suitable for this type of construction, with appropriate volume control and visible brick walls. Similar conditions were found in Building 2, except for the natural ventilation area, which is not sufficient to evacuate moisture and represents the most critical case. In Building 3, the position of the openings makes cross ventilation difficult, which, added to a small area, hinders the proper evacuation of hot and humid air; additionally, its low height and three layers of materials in its walls make it the hottest building.
The highest WBGT levies in the three buildings coincided with the hottest hours of the day. How-ever, during the majority of activities, especially those classified as heavy, the limits of the WBGT index were not exceeded, except for Building 3, where these limits were exceeded during the activity of putting fuel in the drying machine, as well as during the activity of lowering the layers of parchment coffee inside the machine in all buildings.
It is recommended to increase the area of natural ventilation by 4.15 m2 in Building 2, and by 8.05 m2 in Building 3. In the latter, it is also recommended to increase the height of the roof, as well as to install ventilation skylights in the roof above the drying machine, in order to facilitate the evacuation of heat and steam through ventilation.
In order to facilitate the loss of heat to the external environment and to standardize internal temperatures, it is recommended that the envelope of these buildings have low thermal resistance; it is also advisable to install thermal bridges in the area surrounding the drying machines, especially around the heat exchanger.
This paper suggests to study the subject in more depth, as well as to carry out CFD simulations of temperature behavior and internal relative humidity in these facilities, both in their original designs and after implementing the modifications indicated to improve thermal comfort.

