text in
  English (pdf)
 Article in xml format
 Article references
 Send this article by e-mail
 Cited by SciELO
  Cited by Google
  Similars in
SciELO
Similars in
SciELO  Similars in Google
 Permalink
Introduction
This article is part of the Research Project Clean Technologies-Phase 2: The Impact of transferring Clean Technologies on Social Housing in Brazil and Colombia, from the research line in Technology, Environment, and Sustainability. The Universidad Católica de Colombia funded this research.
For construction firms, transferring green technologies is complex and depends on the relationship between different variables involved. As an example of the above, the choice of materials with high built-in energy content implies a high initial level of energy consumption at the buildings' production stage but also determines future energy consumption to meet the demands of heating, ventilation and air conditioning (Zabalza, Valero & Aranda, 2011, pp. 1133-1134).
Also, with a view of the standards of each country, energy consumption in buildings is a key factor in achieving national and international CO2 emission targets. In this respect, the economic savings for the construction of buildings are limited and challenging to implement (Zucker et al., 2016, pp. 153-154).
Building renovation is a real opportunity to meet the current challenges of primary energy reduction and global warming, but it is not enough in terms of technology and sustainable adaptation of buildings. Likewise, it has been identified that the concept of balance is central to implementing energy-efficiency-oriented technologies; this is true in the development of zero-carbon buildings (Sartori, Napolitano & Voss, 2012, pp. 220-221).
In this regard, for example, the energy needed to maintain optimal indoor environmental conditions is 35 % of the total energy consumption in office buildings (Salcido, Abdul & Issa, 2016, p. 1008). In contrast, some studies, such as the one by Pisello et al., (2016, p. 872), assess the impact of natural ventilation while predicting the energy demand of buildings, as they substantially affect the indoor environmental quality and thermal comfort.
Some authors, like Panchal et al. (2016, p. 900), have studied the overall energy efficiency of single generation and multigenerational systems. In that respect, it is noted that the energy efficiency of the multigenerational system is superior to the single generation system. Achieving sustainability objectives in the construction sector involves adopting sustainable business models and energy efficiency measures (Moschetti & Bratteb, 2016, p. 436).
The above leads to identifying research gaps in the area. In response to growing concerns about climate change and the environment, green building design is increasingly demanded from users. However, rapid evaluation of various design options requires the application of analysis tools such as energy modelling, in addition to natural light and ventilation simulations (Niknam & Karshenas,2015, p. 910).
According to the authors reviewed, energy analysis requires collecting energy-related information from different sources and introducing it into an energy analysis application, which involves a time-consuming process. This analysis causes delays and increases the time to compare different design alternatives.
Currently, design decisions are mainly reduced to an energy efficiency criterion within the sustainability assessment of buildings (Niknam & Karshenas, 2015, p. 911). Due to the interdependence of criteria, the current approach is applied linearly and does not consider other criteria aimed at seeing the design in a holistic way in order to achieve a better development of buildings.
Therefore, the systemic approach is a better alternative to the energy assessment of buildings. Other proposals are aimed at the economic assessment of green buildings and to promote their development (Liu, Cuo & Hu, 2014, p. 37). Such is the case of studies conducted in China that seek the application of energy efficiency technologies in sustainable buildings.
In this sense, decision-making in environmental projects requires consideration of socio-political, environmental and economic impacts, and this is often complicated by the diverse views of the interested parties (Huang, Keisler & Linkov, 2011, p. 3579). According to the authors reviewed, multi-criteria analysis is an appropriate method to address available technical information and stakeholder values to support decisions in many fields, and may be especially valuable in environmental decision-making.
As an example of this, several green building classification systems have been proposed since the early 1990s (Kim, Oh & Kim, 2013, pp. 203-204). According to the authors, most efforts in this area can be divided into two main parts: 1) development of green building rating systems by identifying relevant rating criteria; 2) evaluation of the validity of building rating systems. Studies on the qualification criteria for green buildings have focused on the development of Energy Efficiency assessment Items.
Another example in this topic is the city of Loviisa, in Finland, which is planning a new sustainable residential area with 240,000 m2 of residential housing. The city wants to promote green energy solutions in the area, considering various forms of renewable energy for heating (Kontu et al., 2015, pp. 169-170).
The result of the studies carried out in this regard, show that district heating produced by biomass-based cogeneration is the most acceptable heating alternative, followed by the heat pump from the land source, either with or without preference information.
Finally from this bibliographic review, it can be seen that it is of vital importance to introduce the technology adaptability assessment in the construction field with a network vision, since that implies having a systematized overview of the construction process and orienting it more towards reducing environmental impact and improving the energy performance. However, this process requires the application of such vision to be functional so that the construction sector can understand and incorporate these concept into their daily practices.
According to the reasons explained above, incorporating methodologies oriented to multi-purpose responses can be a contribution to the building construction processes. Therefore, one possibility to understand such a problem is to consider this complex behavior as a social network, because, in this way, it is possible to study the technology transfer capacity in the construction field using tools for optimal decision-making.
According to some authors on the subject, a social network analysis can be used as a useful diagnostic tool to make explicit a hidden flow of valuable information in the construction sector (Alarcón, Alarcón & Alarcón, 2013, p. 948). For example, this method has been used to examine how the potential for interference between specialized trades is related to the reliability of the work plan in construction firms (Abbasian-Hosseini, Liu & Hsiang, 2015, p. 145).
Other studies have focused on analyzing, through networks, the relationship between the performance of the project and the organizational characteristics of the construction firms (Castillo, Alarcón & Pellicer, 2018). Also, network analysis has been used to examine cases of collaboration between Korean construction firms involved in international projects over the past decade (Park & Han, 2012, pp. 1460-1461).
Likewise, some studies have used this method to assimilate the relationship between the State and the construction sector in implementing public policies in Brazil (Marques, Bissoli-Dalvi & Alvarez, 2018, p. 187). However, according to the literature review, no research related to network analysis and the study of technology transfer applied to the construction firms has been found, which shows a gap in the knowledge required on this subject.
This article aimed to evaluate the transfer of green technologies between international construction firms that are engaged in building social housing - in the case of Latin America, - or affordable housing -, in the case of Europe and the United States. Network analysis and simulation were the methods used in this study.
The result was a simulation based on network analysis regarding the capacity of the internationally selected construction firms to make different transfers of green technologies between them. By means of this exercise, it is expected to develop indicators for the measurement of the technology transfer process in the construction field in the future that will allow a better under-standing of the complexity of this process in the area of social housing. The article structure is as follows: first, the methodology developed and the activities carried out to achieve the proposed objectives are explained. Second, the study results are described. Finally, the conclusions of the article are set out.
Method
The present study seeks to confirm the following hypothesis: If the different relationships between the actors in the construction sector having the capacity to transfer technology for the development of social or accessible housing on an international scale are identified, then it is possible to assess the technological adaptation capacity of these actors.
For the design of the network, a type of exchange network was defined, in order to analyze the technology transfer capacity of the different construction firms. At a macro-level, the relationships of the network structure was identified. At a micro-level, the changes that took place in technology when it was transferred by a construction firm were specified. The study comprised three research phases organized as shown in Figure 1.
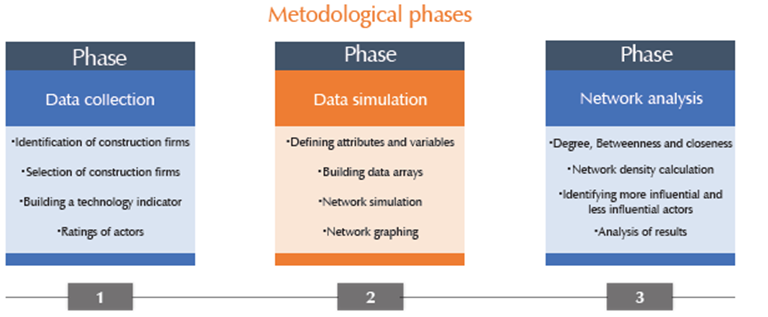
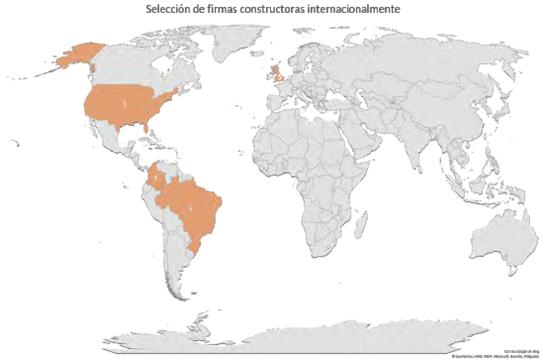
Data collection. At this stage, the following activities were carried out: first, two countries with the highest technology capacity were identified: the United Kingdom and the United States. Then, two countries with lower technological capacity were identified: Brazil and Colombia (McKinsey Global Institute, 2017, p. 13). Subsequently, 20 construction firms were selected: five for each country (See Figure 2). For the selection of each construction firm, its technological capacity was identified and it was examined whether those firms developed social housing or general housing projects. Also, the construction firms were identified from the rankings of the best construction firms compiled by the governmental agencies of the countries under study.
Data simulation. This point defined attributes and variables for data simulation. Then, a data array, named RED-0 was constructed, which represents an initial time T0. Three matrix simulations were then performed, called RED-1, RED-2, and RED-3, each, with times T1, T2 and T3. Finally, all four networks were graphed.
Network analysis. For network analysis, a calculation was made of the degree, the intensity and the closeness of the network, and also of its overall density. Later, the most and least influential construction firms in each simulation were identified. With these measurements it was possible to identify and determine the transfer capacity of green technologies of construction firms from countries with high technological competence and the construction firms with the lowest competence in this area. Finally, an analysis of results was performed.
This study focused its analysis on building relationships and characteristics between the dependent factor called actors with technological transfer capacity and the so-called independent factors, namely: the environmental impact, the energy efficiency of the building and the Technology Identification Code. An indicator was designed to establish the relationship and effect of each of the factors involved in the technology transfer of a construction firm. Each variable was defined as follows:
Actors with technology transfer capacity
These are the actors with the capacity to transfer technology in order to make it more efficient under the conditions of a given con-text and environment. In the particular case of construction firms, this variable refers to technologies oriented to renewable energies over conventional ones. For example, some low-cost passive and active energy-saving technologies have been used successfully by construction firms in an energy-saving technology transformation of office production in Tianjin. The results show that energy consumption and maintenance account for most of the life cycle cost (Ma et al., 2016, pp. 810-811). Another example is the flexibility of the electricity system by leveraging renewable energy generation capabilities in buildings, which is of great importance for sustainable development. Control systems to implement such demand response measures need to quantify the flexibility of the respective buildings (Lopes et al., 2016, p. 1053).
Environmental impact. It is the effect caused by man's activities on the environment. With construction firms, this definition refers to the energy consumption of materials and construction processes. In this respect, the literature review found that, for example, the Dutch National Building Code proposes an easily applicable method that allows for optimized building design concerning environmental impacts (Alsema et al., 2016, pp. 519-522). The proposed approach is a comprehensive construction performance assessment of energy and material demand over the life cycle of the building. Therefore, extending this approach to other countries for assessing construction processes seems like a logical step, as it gives designers a better view of the overall building performance. On the other hand, the adaptation of existing buildings offers important opportunities to improve the comfort and well-being of the occupants, and this is being considered as one of the main approaches to achieving sustainability in the built environment at a relatively low cost and with high absorption rates (Asadi et al., 2014, pp. 444445). In this sense, the reviewed authors propose a multi-target optimization model that uses a genetic and artificial algorithm neural network to quantitatively evaluate the technological options in a building rehabilitation project.
Energy efficiency of the building. It is the consumption reduction from conventional energies in a building in order to save and make a rational use thereof, in addition to energy consumption in the construction and operation processes. For example, simulation of building performance is frequently used to support building design, renovation and operation (Carlucci et al., 2016, pp. 280-281). However, modelers traditionally describe input technical data accurately, and only have a limited interest in investigating the influence of occupants' behavior on the energy efficiency of buildings. Other authors emphasize the thermal energy and comfort performance of double-skin facades, which perform better compared to double or triple-glazed facades (Gelesz & Reith, 2015, pp. 558-559).
From the above definitions the following indicator was established in order to assess the technological adaptation capacity in buildings:
Indicator of Actors with Technology Transfer Capacity (IATTC) = Technological Environmental Impact (TEI) + Energy Efficiency of the Building (EEB) + Technological Identification Code (TIC)
(IATTC) = (TEI) + (EEB) + (TIC)
Likewise, to perform the network analysis of the technological transfer process of an actor representing a construction firm, the following nodes were established:
An actor with the transfer capacity of traditional technologies. Is the individual representing a construction firm that uses traditional technologies with high environmental impact.
An actor with the transfer capacity of thermal insulation technologies. Is the individual representing a construction firm that uses technologies based on passive strategies.
An actor with energy efficiency technology transfer capability. Is the individual representing a construction firm that uses technologies to reduce energy consumption and combines them with passive strategies.
An actor with the transfer capacity of clean technologies. Is the individual representing a construction firm that uses technologies to reduce environmental impacts through the analysis of the entire life cycle, both of the resources and processes used in the design, production, and operation of a building.
An actor with the ability to transfer climate-sensitive technologies. Is the individual rep-resenting a construction firm that uses computational technologies to identify patterns of climate change behavior that can be used in the design, construction and operation processes of a building.
An actor with the ability to transfer low carbon technologies. Is the individual rep-resenting a construction firm that uses technologies to produce a minimum of greenhouse gases throughout the design, construction and operation of a building.
Therefore, for the development of the experiment, it was established that the universe of the initial network was 20 nodes, which represented the 20 construction firms previously selected (Table 1). Then, the organization and classification of the construction firms were done randomly. To validate the proposed hypothesis from the designed indicator, a rating of the technologies used by each of the construction firms selected was employed according to the information pro-vided by the databases and the web pages of each firm. The analysis nodes were numbered from 1 to 6, so that they could be identified. Likewise, a parametrization of the variables was established through a score from 1 to 60, organized in 6 deciles for the independent variables (Table 2). It should be noted that the metric designed in that initial state of the work only took into account positive integers.
Table 1 Selected construction firms and the identification of the use of green technologies.
| Construction Firms | ||||
|---|---|---|---|---|
| Actor | Countries | Social Housing / Affordable Housing | Housing | Technology |
| A1 | UK | X | X | Climate-sensitive technologies |
| A2 | COL | X | X | Traditional technologies |
| A3 | COL | X | X | Thermal insulation technologies |
| A4 | COL | X | X | Traditional technologies |
| A5 | UK | X | X | Climate-sensitive technologies |
| A6 | UK | X | X | Low-carbon technologies |
| A7 | UK | X | X | Energy efficiency technologies |
| A8 | BRA | X | X | Traditional technologies |
| A9 | UK | X | X | Energy efficiency technologies |
| A10 | BRA | X | X | Traditional technologies |
| A11 | USA | X | X | Energy efficiency technologies |
| A12 | COL | X | X | Thermal insulation technologies |
| A13 | BRA | X | X | Thermal insulation technologies |
| A14 | BRA | X | X | Thermal insulation technologies |
| A15 | USA | X | X | Climate-sensitive technologies |
| A16 | USA | X | X | Thermal insulation technologies |
| A17 | COL | X | X | Traditional technologies |
| A18 | BRA | X | X | Traditional technologies |
| A19 | USA | X | X | Climate-sensitive technologies |
| A20 | USA | X | X | Low-carbon technologies |
Source: author's elaboration (2019).
On the other hand, the relationship between variables was followed by a consistency process in the rating process. For example, the greater the environmental impact (rating 6), the lower the energy efficiency (rating 1). The relationship between these two variables is inversely proportional. As a result, a score was obtained for each actor between 8 and 13 (Table 3), where 8 was the score of the lowest indicator related to the technology with the highest impact and lowest efficiency, compared to 13, which was the score of the highest indicator related to the technology of less impact and greater efficiency.
Next, the simulation was carried out. To that end, four double-entry matrices were made, and the model was ran, which generated four network scenarios, and allowed identifying the different agents and their relationships. In this sense, the identification of each node took place by establishing that 0 equals no relation, and 1, the number of entries that a specific node has within the proposed universe.
Results
Table 2 Parameterization of variables for indicator construction.
| Technology, Environmental Impact (TEI) | Valué | Energy Efficiency of the Building (EEB) | Valué | Actors with Technology transfer Capacity (ATTC) | Technology Identification Code (TIC) |
| 0-10 | 1 | 0-10 | 1 | Actor with the capacity to transfer traditional technologies | 1 |
| 11-20 | 2 | 11-20 | 2 | Actor with the capacity to transfer thermal insulation technologies | 2 |
| 21-30 | 3 | 21-30 | 3 | Actor with the capacity to transfer energy efficiency technology | 3 |
| 31-40 | 4 | 31-40 | 4 | Actor with the capacity to transfer clean technologies | 4 |
| 41-50 | 5 | 41-50 | 5 | Actor with the ability to transfer climate-sensitive technologies | 5 |
| 51-60 | 6 | 51-60 | 6 | Actor with the ability to transfer low carbón technologies | 6 |
Source: author's elaboration (2019).
Finally, the results of the experiment were vali-dated in the UCINET 6.682 program, in which the different networks were plotted, and the cohesion of the environmental impact and energy performance factors was examined against technological transfer, through the analysis of the degree (degree), intermediation (betweenness), and proximity (closeness). These three units of measurement allowed to identify and assess the capacity level that occurs in the technology transfer of a construction firm (Borgatti, Everett & Johnson, 2013).
Likewise, the density analysis was performed, which identified the number of possible relationships between nodes, and, in turn, visualized the general behavior that occurs when transferring technology from one construction firm to another. Meanwhile, the study of the degree showed the number of relationships between the independent variables, which allow measuring the individual behavior of each factor against the technology transfer.
Table 3 Parameterization © of variables for indicator construction.
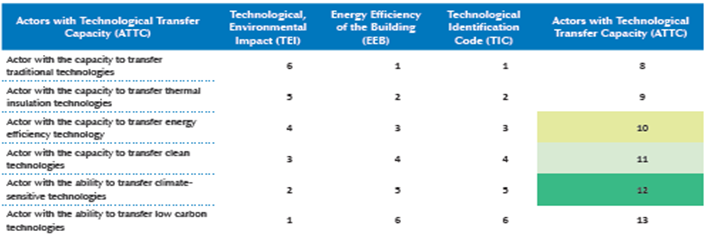
Source: author's elaboration (2019).
Table 4 RED-0 Results.
| Actor | Country | TEI | EEB | TIC | IATTC | Degree | Betweenness | Closeness | Technology transfer Capacity (IATTC) = (Degree n.° / Actors) |
| A1 | UK | 3 | 4 | 4 | 11 | 13 | 1.52 | 25 | 65 % |
| A2 | COL | 6 | 1 | 1 | 8 | 15 | 2.595 | 23 | 75 % |
| A3 | COL | 5 | 2 | 2 | 9 | 16 | 3.085 | 22 | 80 % |
| A4 | COL | 6 | 1 | 1 | 8 | 17 | 2.932 | 21 | 85 % |
| A5 | UK | 2 | 5 | 5 | 12 | 13 | 1.304 | 25 | 65 % |
| A6 | UK | 1 | 6 | 6 | 13 | 15 | 2.113 | 23 | 75 % |
| A7 | UK | 4 | 3 | 3 | 10 | 14 | 1.831 | 24 | 70 % |
| A8 | BRA | 6 | 1 | 1 | 8 | 15 | 2.947 | 23 | 75 % |
| A9 | UK | 4 | 3 | 3 | 10 | 13 | 1.266 | 25 | 65 % |
| A10 | BRA | 6 | 1 | 1 | 8 | 19 | 4.181 | 19 | 95 % |
| A11 | USA | 4 | 3 | 3 | 10 | 14 | 1.936 | 24 | 70 % |
| A12 | COL | 5 | 2 | 2 | 9 | 15 | 2.249 | 23 | 75 % |
| A13 | BRA | 5 | 2 | 2 | 9 | 12 | 1.357 | 26 | 60 % |
| A14 | BRA | 5 | 2 | 2 | 9 | 18 | 3.403 | 20 | 90 % |
| A15 | USA | 2 | 5 | 5 | 12 | 13 | 1.314 | 25 | 65 % |
| A16 | USA | 5 | 2 | 2 | 9 | 13 | 1.314 | 25 | 65 % |
| A17 | COL | 6 | 1 | 1 | 8 | 14 | 1.602 | 24 | 70 % |
| A18 | BRA | 6 | 1 | 1 | 8 | 14 | 1.585 | 24 | 70 % |
| A19 | USA | 3 | 4 | 4 | 11 | 16 | 2.41 | 22 | 80 % |
| A20 | USA | 1 | 6 | 6 | 13 | 15 | 2.056 | 23 | 75 % |
Source: author's elaboration (2019).
RED-0 Results
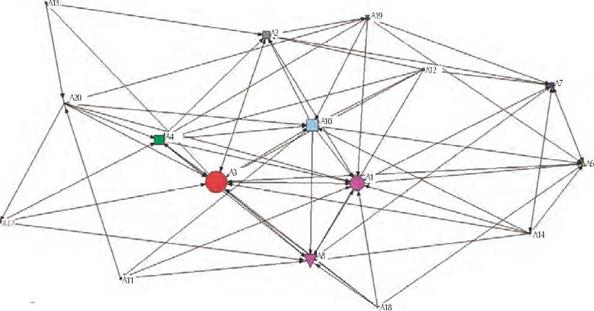
The network starts with a T0 time and with 20 actors, of which it can be seen that the five main firms of the network are all Latin American and start with a high capacity for technology transfer. In this case, there is a high capacity to receive green technologies. It is identified that the construction company A10 represents a Brazilian company with a high technology transfer capacity of 95 % and an IATTC of 8; that is, it has traditional technologies. In this particular case, it can be seen that the firm has a high capacity for relationships with other actors in the network, its degree is 19 and it has a high capacity for transmitting and receiving technology. Its betweenness is 4,181. Likewise, its proximity is 19, which allows it to interact with other actors easily since it is located it in the center of the network. Table 4 shows the first five actors of RED-0 and the corresponding results. Figure 3 shows the graphing of RED-0 and Figure 4 shows the graphical behavior of the data in Table 4.
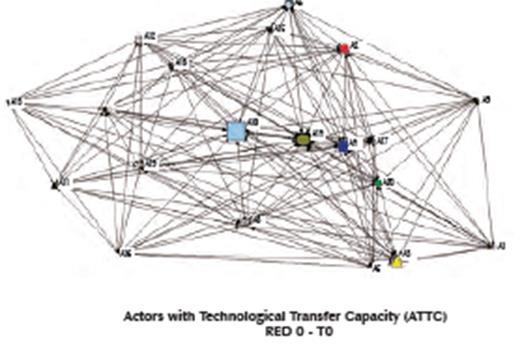
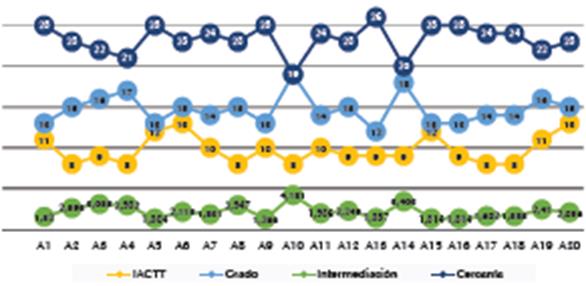
Table 5 RED-1 Results.
| Actor | Country | TEI | EEB | TIC | IATTC | Degree | Betweenness | Closeness | Technology transfer Capacity (IATTC) = (Degree n.° / Actors) |
|---|---|---|---|---|---|---|---|---|---|
| A1 | UK | 1 | 6 | 6 | 13 | 12 | 8.776 | 18 | 75% |
| A2 | COL | 4 | 3 | 3 | 10 | 8 | 4.093 | 22 | 63% |
| A3 | COL | 2 | 5 | 5 | 12 | 12 | 13.85 | 18 | 75% |
| A4 | COL | 3 | 4 | 4 | 11 | 10 | 5.367 | 20 | 63% |
| A6 | UK | 2 | 5 | 5 | 12 | 7 | 1.843 | 23 | 44% |
| A7 | UK | 4 | 3 | 3 | 10 | 7 | 2.283 | 23 | 44% |
| A8 | BRA | 3 | 4 | 4 | 11 | 10 | 7.793 | 20 | 63% |
| A10 | BRA | 2 | 5 | 5 | 12 | 11 | 6.817 | 19 | 69% |
| A11 | USA | 2 | 5 | 5 | 12 | 4 | 0.167 | 26 | 25% |
| A12 | COL | 3 | 4 | 4 | 11 | 6 | 0.676 | 24 | 38% |
| A13 | BRA | 4 | 3 | 3 | 10 | 3 | 0.167 | 27 | 19% |
| A14 | BRA | 3 | 4 | 4 | 11 | 6 | 0.476 | 24 | 38% |
| A17 | COL | 4 | 3 | 3 | 10 | 4 | 0.167 | 26 | 25% |
| A18 | BRA | 3 | 4 | 4 | 11 | 5 | 0.367 | 25 | 31 % |
| A19 | USA | 4 | 3 | 3 | 10 | 7 | 1.66 | 23 | 44% |
| A20 | USA | 2 | 5 | 5 | 12 | 8 | 5.5 | 22 | 50% |
Source: author's elaboration (2019).
RED-1 Results
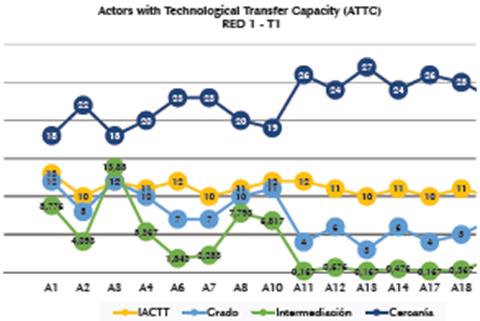
After eliminating the construction firms that have the lowest technology transfer capacities, the network starts with a T1 time and with 16 actors. It is observed that among the five main firms in the network, one is European, one is from the United States and four are Latin American. All of them have a high capacity for technology transfer.
Likewise, from the simulation carried out, it is identified that construction firms have evolved in the use of the type of technology. It can also be seen that there is a construction firm with a high capacity to transfer technologies, and four construction firms with a high capacity to receive such technologies.
Here, the construction firm A1 represents a company in the United Kingdom with a technology transfer capacity of 75% and an IATTC of 13, that is, it has low carbon technologies. Additionally, this firm is on a par with an A3 construction firm that represents a Colombian company with a technology transfer capacity of 75% and an IATTC of 12, according to which it has a climate-sensitive technology.
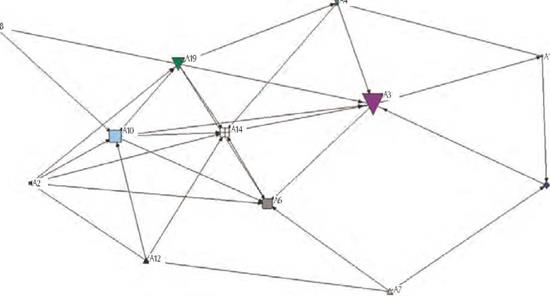
It is important to note that this firm has evolved in simulating an IATTC of 9 (Table 4) to an IATTC of 12 (Table 5), which allows it to have the capacity to accept new technologies. Table 5 shows the first five actors of RED-1 and the corresponding results. Figure 5, meanwhile, shows the graphing of RED-1, and Figure 6 shows the graphical behavior of the data in Table 5.
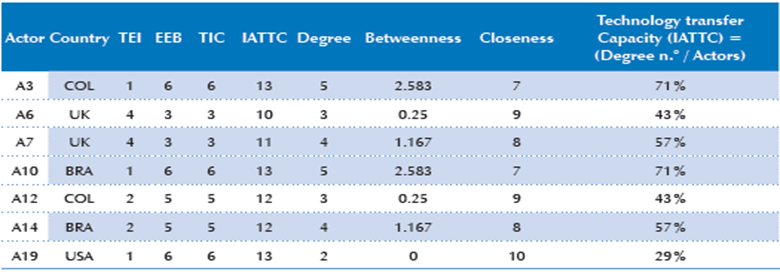
Table 6 RED-2 results.
| Actor | Country | TEI | EEB | TIC | IATTC | Degree | Betweenness | Closeness | Technology transfer Capacity (IATTC) = (Degree n.° / Actors) |
|---|---|---|---|---|---|---|---|---|---|
| A1 | UK | 1 | 6 | 6 | 13 | 3 | 0.667 | 22 | 25 % |
| A2 | COL | 1 | 6 | 6 | 13 | 5 | 0.583 | 19 | 42 % |
| A3 | COL | 3 | 4 | 4 | 11 | 7 | 11.5 | 15 | 58 % |
| A4 | COL | 2 | 5 | 5 | 12 | 4 | 1.917 | 19 | 33 % |
| A6 | UK | 4 | 3 | 3 | 10 | 6 | 4.917 | 16 | 50 % |
| A7 | UK | 3 | 4 | 4 | 11 | 3 | 2.333 | 21 | 25 % |
| A8 | BRA | 2 | 5 | 5 | 12 | 2 | 0.000 | 23 | 17 % |
| A10 | BRA | 4 | 3 | 3 | 11 | 7 | 6.417 | 15 | 58 % |
| A12 | COL | 4 | 3 | 3 | 10 | 4 | 2.167 | 19 | 33 % |
| A14 | BRA | 2 | 5 | 5 | 12 | 7 | 4.833 | 15 | 58 % |
| A19 | USA | 4 | 3 | 3 | 10 | 7 | 6.583 | 15 | 58 % |
| A20 | USA | 1 | 6 | 6 | 13 | 3 | 2.083 | 21 | 25 % |
Source: author's elaboration, 2019.
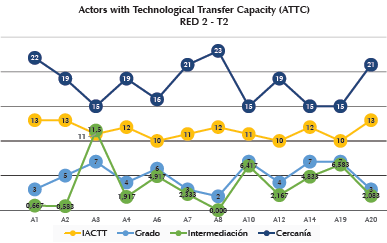
RED-2 Results
After a second elimination of the construction firms that have the lowest technology transfer capabilities, the network starts with a T2 time and with 12 actors. It is observed that the five main firms of the network are: one European, one from the United States and three from Latin America. It can be seen that the five firms have similar technology transfer capabilities.
Likewise, from the simulation carried out, it is identified that the construction firms have continued their evolution in using a different technology. In this network, it can be seen that the construction firm with a high capacity to transfer technologies is the Colombian firm A3, which has a technology transfer capacity of 58 % and an IATTC of 11. It is important to note that the firm moves back in technology: it goes from an IATTC of 12 to an IATTC of 11. The firm lost transfer capacity. However, it has a high betweenness of 11.5, which means that the company has a high capacity for transmitting and receiving technology within the network, and this makes it a good intermediary between other actors in the network (Figure 7).
Table 6 shows the first five actors of RED-2 and the corresponding results. Figure 7 shows the graphing of RED-1 and Figure 8 shows the graphical behaviour of the data in Table 6.
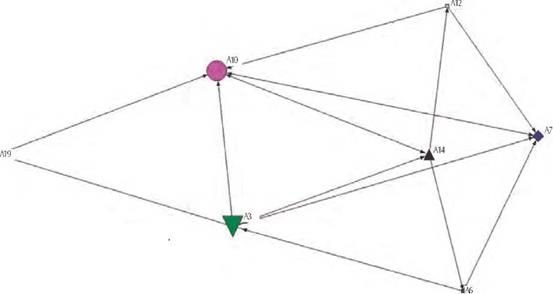
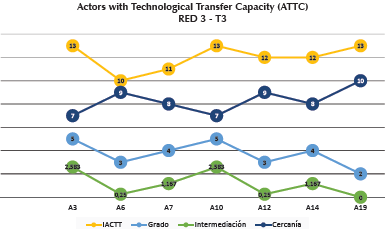
RED-3 Results
After the third elimination of the construction firms that have the lowest technology transfer capabilities, the network starts with a T3 time and with 7 actors. It is also observed that the four main firms of the network are one European and three Latin American. It is also observed that the four firms have similar technology transfer capabilities. In this case, the two construction firms are A3 and A10, which have a technology transfer capacity of 71 % and an IATTC of 13. Both firms manage to obtain the highest technology in the market. Also, the two firms have a high betweenness of 2,583. That is, the two companies can transmit and receive technology within the network. Finally, Table 7 shows the first four actors of RED-3 and the corresponding results can be observed. Figure 9 shows the graphing of RED-3 and Figure 10 shows the graphical behavior of the data in Table 7.
Table 8 shows the density calculation of the four networks analyzed. Density is a measure that calculates the potential relationship between the actors in the network. Therefore, with this measure, the potential of relationships that occur in the four networks and their average grade can be verified. It can be seen that RED-0 starts with a density of 0.534 and ends in RED-3, with a density of 0.405.
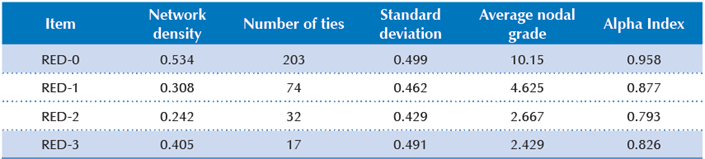
According to the above, there is a 24% loss in network density in the entire network simulation and analysis for transferring green technologies in construction firms. In addition, it identifies a high reduction in the number of relationship opportunities between the actors; it reduces the number of ties from 203 in RED-0 to 17 in RED-3 (Table 8).
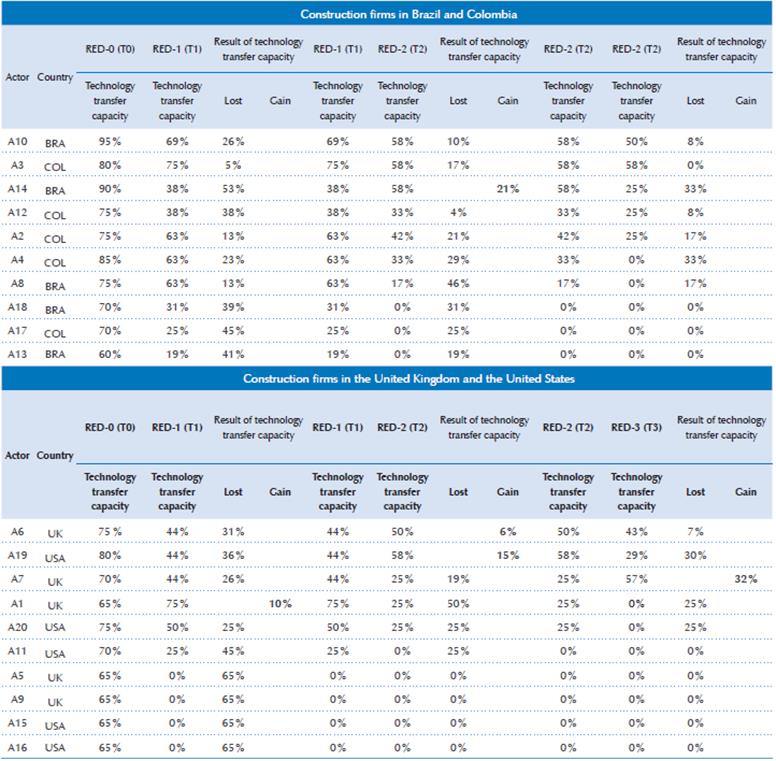
Finally, Table 9 shows the results of the losses and gains in the technology transfer capacity of the 20 firms analyzed through networks. Of the construction firms in Brazil and Colombia, the A14 actor from Brazil stands out, who presents a 21 % gain in his capacity for technology transfer in the transition between RED-1 and RED-2. Meanwhile, actor A6, from the United Kingdom, and A19, from the United States, show a 6 % and 15 % gain, respectively, in their ability to transfer technology in the transition between RED-1 and RED-2.
Table 9 Results of the calculation of losses and gains of technology transfer capacity: RED-0, RED-1, RED-2, and RED-3.
Source: author's elaboration (2019).
On the other hand, actor A7, from the United Kingdom, shows a 32 % gain in his ability to transfer technology in the transition between RED-2 and RED-3. Finally, actor A1 exhibits a 10 % gain in his ability to transfer technology.
Conclusions
This study shows the complexity and the relationship of the variables involved in technology transfer between different international construction firms. The identification of a research gap in this area allowed the evaluation of transferring green technologies between construction companies dedicated to building social housing or accessible housing.
Therefore, this exercise could develop an indicator of the measurement of green technology transfer between construction firms. In the first place, it is concluded that strengthening technology transfer capabilities allows medium and long-term gains for construction firms.
However, it is observed that there is a 24% loss in network density throughout the process. It is also observed that construction firms in Brazil and Colombia show 21 % gains in their capacity for medium-term technology transfers by meeting stronger international companies and better technologies.
Likewise, it can be seen that some firms may present small technological setbacks while developing the process of strengthening their technology transfer capacity. This exercise shows the adaptability of Latin American construction firms to the transfer capacity of construction firms in industrialized countries. At this point, it can be confirmed that the hypothesis proposed at the beginning of this article is valid.