


 Inglês (pdf)
 Artigo em XML
 Referências do artigo
 Enviar este artigo por email
 Citado por SciELO
  Citado por Google
  Similares em
SciELO
Similares em
SciELO  Similares em Google
 Permalink
Introduction
A performance assessment is an evaluation in which the examinee has to perform specific tasks to demonstrate his/her ability to apply knowledge and skills to create work related to actual professional or academic activities. Normally, this creation generated by the examinee has to be scored by one or more knowledgeable raters. Thus, in this type of assessment, the rater's judgment exerts a prominent influence (rater mediated assessment). The examinee's final score will depend not only on his or her ability and the difficulty of the item, but also on the severity of the rater. In this context, relevant differences in raters' severity or lenience pose a direct threat to the validity and fairness of the assessment (Lane & Stone, 2006; Martínez, 2010). These differences between raters are common, even in raters with similar academic backgrounds and experiences, as they could be associated with individual personality traits.
In recent years Rasch Models have been pro-posed as useful tools to address this issue. Particularly, the Many-facet Rasch Measurement (MFRM) decomposes the different sources that explain score variability into three components or facets: examinee ability, item difficulty and rater severity. (Linacre, 1989; Linacre & Wright, 2002; Prieto, 2015). In other words, a particular score can be thought of as varying due to the ability of the particular examinee (how competent or not he or she is), the relative severity or leniency of the rater, and the relative difficulty of the criterion being assessed.
This paper presents a real-life application of a MFRM approach in the context of a high- stakes assessment used to select students for an under-graduate Architecture program at the University of Costa Rica (UCR), showing the benefits derived from the information provided in the output from MFRM analyses.
Currently, there are many aspects of the quality of a particular measurement where the use of a MFRM approach can help improve. For example, MFRM analysis "shows how to measure rater severity (or leniency), assess the degree of rater consistency, correct examinee scores for differences in rater severity, examine rating scale performance, and detect possible interactions between facets" (Eckes, 2011).
Thus, the use of a MFRM approach is ideal for evaluating the technical quality of performance assessments and for tests that include open-ended responses that must be scored by expert raters. The assessment could involve scoring specific products and/or evaluating a process that an examinee has conducted (Myford & Wolfe, 2004). For example, a cooking test might judge the taste and presentation of a particular dish, but also the procedure used by the cook to create it.
Specifically, the performance evaluation instrument analyzed in this study was first introduced in 1998 by the School of Architecture at the University of Costa Rica. Since then, it has been used as a special requirement for new undergraduate students applying to the program.
The purpose of this evaluation is to assess the skills that were identified as part of the applicant's ideal entry profile. Through the years, this instrument has been modified to improve its quality, and the most relevant changes initiated in 2011 (Hernández, 2015).
The revised evaluation consists of presenting applicants with a written description of a specific scenario in which a design problem is defined, and the applicant is asked to demonstrate his/ her ability to present a coherent solution to the problem. This design problem is of low complexity, defined within a particular physical and environmental context, with a specific purpose. As part of the scenario, the applicant has a set of diverse materials and objects to develop the solution. Thus, the applicant has to propose a solution to the problem, creating a basic design that is represented by drawings and explanations on large sheets of paper.
It was not until 2015 that the MFRM measurement approach was used to investigate the psychometric quality of the assessment used by the School of Architecture at the University of Costa Rica to select its students. When analyzing the scores assigned after three consecutive applications (i.e., 2015, 2016 and 2017), it became evident that the degree of inter-rater agreement, an attribute referred to as inter-rater reliability, could be improved.
Methodology
As it was stated in the Introduction, this paper presents a real-life application of a MFRM approach to improve a high- stakes assessment instrument used to select students for an Architecture undergraduate program at the University of Costa Rica.
Participants
Examinees from four different cohorts comprised the sample that was analyzed with the MFRM approach, corresponding to the years 2015, 2016, 2017 and 2018. The number of examinees ranged from 600 to 800 per year. For each specific cohort, all of them were applying to enter the Architecture School at the University of Costa Rica. In general, they competed for around 110 seats in the program, so the process was very competitive.
Instruments
The performance assessment instrument described in the introduction was used. Six criteria were established and defined for the scoring process. Each criterion was scored by raters using an ordinal scale. For each scoring category on each criterion, a brief description of a typical performance is presented to the rater. Prior to the administration of the evaluation in 2018, a 5-point scoring scale was used, ranging from 1, meaning the poorest performance, to 5, meaning the highest. In 2018, as it will be explained below, some modifications were implemented to decrease the number of scoring categories for each criterion.
The first five criteria used until 2017 are briefly described below, and the description of the last one, criterion F, is expanded:
Fantasy and risk to tackle the problem involves the degree of creativity shown in the solution, not depending on its graphical quality or the quality of the final solution.
Flexibility and adaptability in the use of the resources, materials, parameters, conditions and temporality as presented in the scenario.
Fluidity, process, and organization involve the selection and analysis of information provided by the scenario.
Coherence of the final proposal deals with the degree of affinity between the answer or final solution and the established parameters in the scenario.
Elaboration, depth and complexity in the final proposal to solve the problem.
Graphical expression competence: it is the examinee's ability to express his/her ideas for the proposal by means of freehand drawings. For example, showing the solution from different points of view, drawing in three dimensions, giving a sense of perspective, symmetry, reflections, different types of tones and thickness of the lines, etc.
The evaluation of this last criterion involved the diversity and use of different types of approaches with the drawings as a means to communicate the proposal and concepts related to it, with the following levels of performance:
Performance level 1. Very low management of the tools and graphical expression is observed. The drawings do not allow recognizing the proposal.
Performance level 2. Poor graphical level is observed, allowing scarce comprehension and visualization of the proposed solution.
Performance level 3. A regular level of graphics is observed; the graphs are basic but allow understanding the proposal, without contributing details. The use of diverse graphical expression techniques is shown. It uses different types of drawings to express the proposal from different approaches and points of view.
Performance level 4. Good graphical level is observed. The drawings are detailed. The graphics are somewhat basic but allow comprehension and visualization of the proposed solution. It uses different types of lines with diverse tones and thickness. It uses distinctive types of drawings, including diagrams or basic schemes, drawing from various points of view. It employs different qualities or types of lines and diverse techniques of graphical expression.
Performance level 5. Excellent level of graphical expression is observed, way above the norm, allowing understanding the proposal with great clarity. It uses various types of drawings, diagrams and schemes. The drawings are made from diverse points of view. It exhibits a high quality level seldom seen.
Procedure
The product generated by each examinee was rated, independently, by three judges, who were professors of first-year courses in the Architecture School. In total, there were between 12 and 15 raters, and one of them, an expert, scored all the examinees.
The same analytic scoring rubric was used by all the raters. According to their assessments, the examinee was classified into one of three categories. If an applicant's product was classified as "A" or "B," the applicant was eligible to apply for a seat in the program. Applicants whose products were classified as "C" were not eligible to apply for a seat.
Analysis: The MFRM approach
The MFRM approach for analyzing rating data was developed by Michael Linacre (1989). It is an extension of the dichotomous Rasch model by Georg Rasch (1960), the partial credit model of Masters (1982) and the polytomous Rasch rating scale model of Andrich (1978).
The mathematical formula for the basic MFRM is the following:
ln (Pnijk /Pnij(k-1)) = Bn - Di - Rj - Fk
Where,
Pnijk is the probability that examinee n receives a score of k on item i from rater j.
Pnij(k-1) is the probability that examinee n receives a lower score of k-1 on item i from rater j.
Bn is examinee n's level on the latent variable under measurement.
Di is the difficulty of item i.
Rj is the severity of rater j.
Fk is a location parameter for the step between the adjacent categories k and k-1 for rater j (scale factor).
In the partial credit formulation Fjk, instead of Fk, is a location parameter for the step between the adjacent categories k and k-1 for rater j (scale factor).
It can be also demonstrated that this model is a special case of a cross-level generalized linear mixed model (Eckes, 2011). As in any mixed model, estimation procedures involve the use of optimization techniques using iterative numerical algorithms. For MFRM, JMLE (Joint Maximum Likelihood Estimation) is the preferred estimation method.
As with the Rasch Model, MFRM possesses the unique and attractive property of conjoint measurement. (Linacre, 1989; Eckes, 2011; Prieto & Nieto, 2014). This means that if data show sufficient fit to the model, the units of measurement, logits, are the same for the measures of examinee ability, item difficulty and rater severity. This property turns out to be very useful in terms of providing information regarding the technical quality of the assessment according to its purpose.
When analyzing the data using a MFRM approach, ordinal raw scores are transformed into measures on a logit scale, an equal interval scale, which then allows making direct comparisons between examinees, raters, and items. This property makes it possible to generate a map, plotting in the same space measures of examinee ability, item difficulty and rater severity. This is called, in this case, the "raters by examinees by items map" which allows users to generate criterion-referenced interpretations of the assessment results.
It is also relevant to point out, that in this model examinee ability measures are adjusted for the levels of severity exercised by the raters who evaluated each examinee. This is, of course, an issue of fairness, as raters do not want examinees' final scores on an assessment to depend upon which particular raters scored which examinee and the levels of severity/leniency that each of those raters exercised.
On the other hand, using the "raters by examinees by items map", it is possible to target a particular ability range that requires precise measurement, given the purpose of the assessment. For example, in the case of a competitive selection test, such as the one presented in this application, one would want to be more precise estimating the highest ability levels, where selection decisions for the program are made, i.e. more accurate in measuring at that upper end of the continuum.
If there is a minimum passing score, instead of just admitting those with scores high enough to take a seat, it is probably more important to have the most accurate measurement in the region of the minimum score. Evaluators want precision there to be sure that the students whose scores are just below the cut-off point should not be admitted, while those above that point should be admitted.
It is also relevant to determine whether the item difficulty levels are appropriate for the purpose of the assessment, and, perhaps more importantly, to assess the closeness of rater severity measures. When the distribution of the rater severity measures is wide, or if there are extreme values at the high or low ends of the distribution, there is evidence of possible threats to the validity and fairness of the assessment.
A requirement for estimation in the MFRM approach that has direct implications for the plan that assigns raters to examinees, is the subset connection property (Eckes, 2011). The assignment of raters to examinees must be understood as a network of links that should be complete enough to connect all the raters through all the examinees, directly or indirectly. In this context, a completely crossed design plan is one in which all the raters score all the examinees' products. This plan is ideal in terms of connection, but also costly and time consuming to implement in situations where there are many examinees, and the final scores are needed rather quickly.
As an alternative, implementing an incomplete block design plan is a solution that maintains the subset connection property but does not require all raters to score all the examinees' products. The subset connection property means that there are no cases where one subset of raters assesses a closed subset of examinees, while another subset of raters assesses another closed subset of examinees. This issue has important consequences when analyzing rating data using a MFRM approach, since the measurement model cannot be adequately estimated when this property is not fulfilled. In the study presented in this paper the subset connection property is fulfilled, since there was an expert rater that scored all the examinees' products.
In terms of available software packages to conduct MFRM analyses, FACETS is currently the most recommended one (Linacre, 2010, 2015). It only runs on IBM PC compatible platforms.
The data collected in this study were analyzed with this software. There are also two packages in R that claim to estimate MFRM models, TAM and immer, but their quality is unknown to the authors of this paper.
Once the results were interpreted from the 2015, 2016 and 2017 applications, it was clear that there was room to improve the agreement among raters, since the MFRM indicated less than optimal indicators. According to these findings, several actions were implemented in the 2018 application to improve agreement. Results of the corresponding analysis are presented in the next section.
Results
Overall, results were similar for the cohorts corresponding to the three earlier years. Figure 1 presents the Raters by Examinees by Criteria map for the 2017 administration of the assessment. For the two previous years the maps were very similar.
Analyses for the 2015, 2016 and 2017 applications
Before interpreting the map, it is important to point out that the infit indicators that summarize the degree of fit between the empirical data and the model were all satisfactory for the data sets analyzed, not showing, on the average, values considerably different from 1, which is their expected value under perfect measurement conditions. Specifically, individual raters and criteria had fit statistics that were inside the acceptable ranges for those statistics. Thus, it can be concluded that, overall, the data showed satisfactory fit to the model; therefore the results provided by the latter can be validly interpreted.
To understand this map it must be first remembered that all the measures of rater severity, examinee ability and criterion difficulty are on the same logit scale, thanks to the conjoint measurement property of the Rasch Model. In this case the scale is also centered on the examinees' mean, with the value set at 0. Each rater's severity measure is identified by his/her initials in the second column, the histogram of the examinee ability measures is shown in the third column, and in the fourth column the criterion difficulty measures are plotted. The criterion difficulty measures are labeled A to F; therefore, Criterion 1 is Fantasy and Criterion 6 is Graphical Expression. Criterion 6 was the easiest to get high ratings on, while Criterion 5 (Elaboration, Depth, and Complexity) was the most difficult one.
The map shows that all the rater severity measures are above the mean of the examinee's ability measures. This outcome is expected and desirable since the assessment has high stakes and is very competitive. On the other hand, the distribution of the criteria difficulty measures is somewhat lower than the distribution of the rater severity measures and closer to the mean of the examinee ability measures, suggesting that those who designed this assessment might consider refining the performance level descriptions for the categories at the upper end of the scale for some of their criteria to see if it is possible to differentiate more clearly among examinees with higher levels of ability. That being said, the distribution of examinees' ability measures is wide, evidencing good dispersion in those measures (i.e., the examinee separation reliability was 0.95).
Finally, this map and accompanying numerical indicators provide evidence for relatively important differences among the raters in the levels of severity they exercised. As it can be seen from Figure 1, the range (difference between the higher and lower values) in the rater severity measures is 2.17 logits. The more lenient raters are LCF and MVR, whereas the most severe raters are ACV and OEHU.
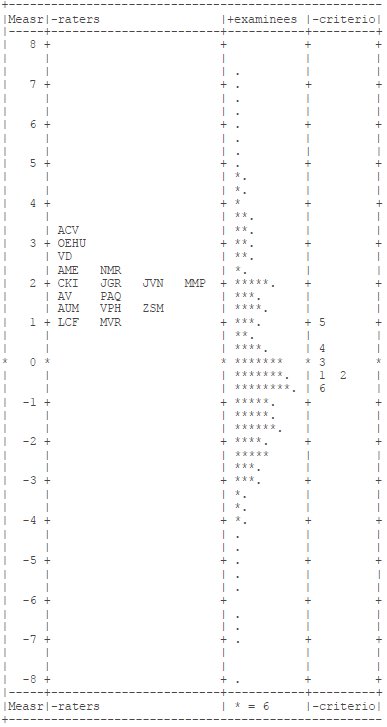
Note. Examinee separation reliability is 0.95, criterion separation reliability is 0.99, rater separation reliability is 0.86, and range of rater severity measures is 2.17 logits.
Figure 1 Raters by Examinees by Criteria map, output from a MFRM analysis Architecture Entrance Exam, Application 2017, University of Costa Rica
Modifications implemented for the scoring of the assessment in 2018
Taking into consideration the results reported in the output from the MFRM analyses in the three previous years, some important modifications were introduced in the scoring of the assessment in 2018, with the goal of trying to achieve a higher degree of agreement among the raters. (Hernández, 2018).
The raters participated, for the first time, in a formal training and practice session before starting their scoring work. This differs from previous years where they were presented with the scoring rubric and an explanation of how to apply it, but there was no formal training or practice. The training session included carrying out a scoring practice with 10 pieces of examinees' work from the previous year. Each rater scored independently each piece of work and registered the ratings in a computer program. After analyzing the results, a group discussion took place comparing their ratings to those that an expert rater assigned.
There were also significant refinements made to the scoring rubric. A re-ordering of the criteria was carried out to resemble more closely the process that the examinee follows to solve the problem. For five of the original criteria, the number of performance levels was reduced from 5 to 3, and for the original Criterion D (Coherence of the Final Proposal, which is now Criterion F), only two performance levels were defined, since the raters argued it is intrinsically a dichotomous score (there is coherence or there is not). The description of each performance level for each criterion was also revised.
For illustrative purposes, the former Criterion F (Graphic Competence to Express and Communicate, which is now Criterion E) is presented as follows, with modifications:
Performance level 1. Deficient: very low level in the graphical communication of the ideas, only one drawing is presented or variations of it from the same angle or type of drawing (elevation, ground, etc). The drawings do not allow recognizing the proposal. It doesn't contribute with texts, or the description is vague.
Performance level 2. Average: The graphics are basic or reasonable allowing understanding the idea but not contributing with more details. It provides texts with partial explanations of the idea or the use of the materials. There is no evidence of using diverse graphical expression techniques. It uses different types of drawings, diverse points of view of average quality.
Performance level 3. Good: The drawings are detailed; the graphics and texts allow comprehension and visualization of the ideas. It uses different types of drawings, diagrams or basic schemes. It includes notes, drawings from different points of view and uses diverse qualities or types of lines and diverse techniques of graphical expression.
Figure 2 shows the Raters by Examinees by Criteria map from the output of a MFRM analysis of the data that were generated with this 2018 application of the assessment, where these modifications were implemented. From its observation, it is evident that the spread of the criteria difficulties is wider in this assessment, which is a desired behavior for this type of exam. This could be also an indication of the effectiveness of the raters' formal training. In previous years the difficulties of the criteria were more similar, signaling perhaps a halo effect, i.e. a tendency to score each criterion according to the overall impression of the work being rated.
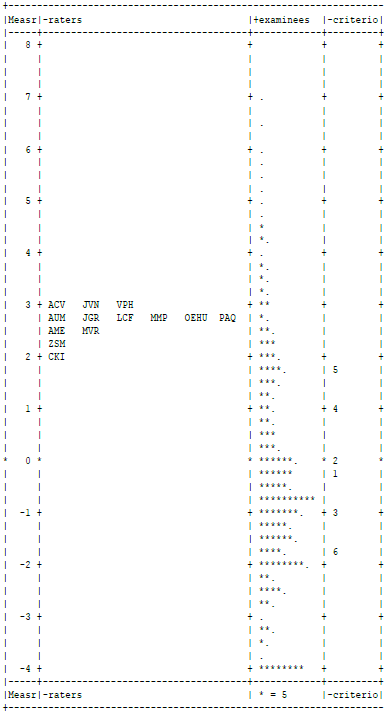
Note. Examinee separation reliability is 1.0, criterion separation reliability is 1.0, rater separation reliability is 0.88, and range of rater severity measures is 1.09 logits.
Figure 2 Raters by Examinees by Criteria map, output from a MFRM analysis Architecture Entrance Exam, Application 2018, University of Costa Rica
Moreover, the results from this analysis pro-vide evidence of a considerable improvement in the degree of agreement between the raters, signaling that the modifications in the rubric and the implementation of a rater training program were effective. The range of variability in the rater severity measures decreased. The difference between the highest and lowest estimated severities for raters dropped from 2.17 logits in 2017 to 1.09 logits in 2018. Also, the separation reliabilities for examinees and criteria, indicators of how well the assessment procedure spread out the examinees and the criteria, reached the highest value of 1.0, indicating, on average, optimal spread.
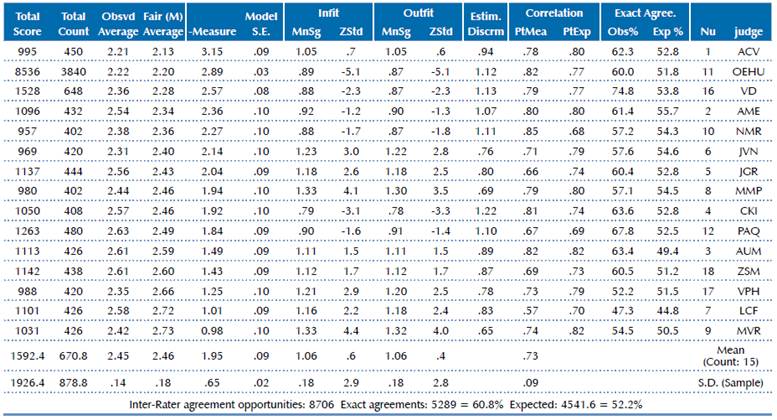
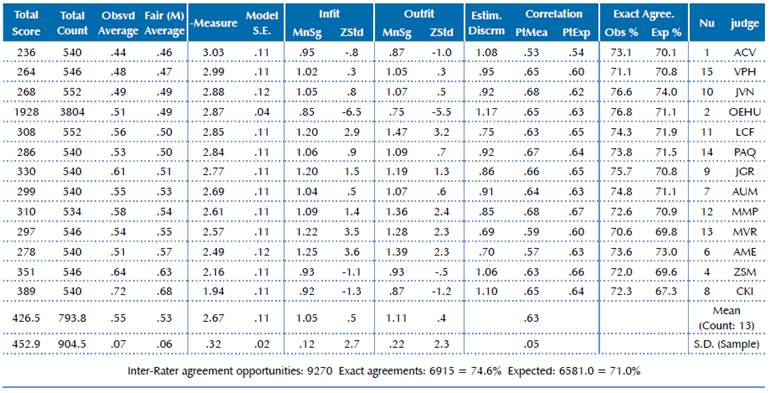
The above is shown in detail in Tables 1 and 2. In general, both in 2017 and 2018, the raters' measures of severity presented a good fit, according to the infit and outfit indexes. The mean infit was 1.06 for 2017 and 1.05 for 2018, with standard deviations of 0.18 and 0.12, respectively. On the other hand, there was a very relevant improvement in 2018 regarding the raters' agreement once the modifications to the test were implemented. The range for the severity measures lowered from 2.17 (3.15 - 0.98) in 2017 to 1.09 (3.03 - 1.94) in 2018. Moreover, the inter-rater agreement opportunities increased from 60.8% in 2017 to 74.6% in 2018.
Table 1 Raters severity measures and its statistics, according to the MFRM analysis Architecture Entrance Exam, Application 2017, University of Costa Rica
Discussion
These findings reinforce the need to employ measurement models that allow to measure and improve inter rater reliability or agreement between judges in a performance assessment, considering, especially, that this type of analyses is virtually unknown by most Architecture Schools. Since the agreement or concordance between raters is a cornerstone for validity in evaluations of products or processes, more attention should be paid to it in the assessment of works by Architecture students. In order to fulfill this goal it is important for the raters who are professionals in Architecture to collaborate with measurement specialists, psychometricians and statisticians familiarized with the Rasch model, such is the case in the present study.
Moreover, as it was stated in the Methodology section, these analyses can also identify the specific aspects (facets) of the assessment that need to be targeted in order to improve the quality of the measurement. Once the changes or improvements are implemented, the same model should be used to confirm the effectiveness of the modifications. This research also provides evidence for this approach.
In this particular case, the value added by the MFRM as a diagnostic tool to increase the validity of the assessment was clearly demonstrated. At the same time, the particular actions that were implemented to achieve a higher degree of agreement between the raters also provide evidence to affirm that carrying them out was an appropriate decision. These procedures are usually recommended by measurement experts to increase reliability of measurements (Myford & Wolfe, 2004), and, in this particular case were the following: 1- a more precise definition of the constructs that are measured in the test, and more detailed descriptors of the performance levels for each particular criterion being evaluated, 2- a more extensive training session for the raters, including practice with real data, and receiving feedback from the trainers, and, 3- the decision to modify the scoring scale for each aspect or criterion in the evaluation rubric, from five to three categories.
It is also notable that, even though the number of categories in the scoring scale for each criterion was reduced from five to three categories, the modified instrument yielded scores estimated for the examinees that were more spread out, identifying more precisely their differences in the constructs under measurement. Similarly, the modified instrument better differentiated the difficulty estimates for each criterion being assessed. This is clear evidence of improvement in the accuracy of the evaluation.
Conclusions
This study illustrates the benefits of using a MFRM (Many-facet Rasch Measurement) approach to analyze rating data and improve the technical quality of a high stakes performance assessment. It provides valuable information that helps the test designers to: 1-understand how different sources of variance interact to impact the final scores that examinees receive, 2-target for improvement specific measurement "facets" that are signaled as troublesome by the analyses, and, 3-confirm with empirical evidence how the modifications introduced in the assessment have, in fact, yielded an assessment tool with more technical quality.
Moreover, the three specific actions that were taken to improve the evaluation proved to be effective, as stated by the results of the model with the data collected in the 2918 application, year in which these changes were implemented. They are the following: clearer definitions and operationalizations of the constructs under measurement, more extensive previous training for the raters, including a practice session with real data and feedback by the trainers, and the decision to reduce the scale to score each criterion in the evaluation rubric, from five to three categories.
In particular, assessment designers can use these analyses and suggestions to guide their efforts to improve the agreement between raters (inter-rater reliability), by minimizing differences in their severity levels, as these disparities pose a direct threat to the validity and of the assessment.

