


Serviços Personalizados
Journal
Artigo
 Inglês (pdf)
 Artigo em XML
 Referências do artigo
 Enviar este artigo por email
Indicadores
-
 Citado por SciELO
 -
 Acessos
Links relacionados
-
 Citado por Google
 -
 Similares em
SciELO
Similares em
SciELO -
 Similares em Google
Compartilhar

 Permalink
Profile Issues in Teachers` Professional Development
versão impressa ISSN 1657-0790
profile vol.18 no.2 Bogotá jul./dez. 2016
https://doi.org/10.15446/profile.v18n2.53302
http://dx.doi.org/10.15446/profile.v18n2.53302
Aligning English Language Testing With Curriculum
Alineación de exámenes de un programa de inglés con su currículo
Marcela Palacio*
Sandra Gaviria**
Universidad EAFIT, Medellín, Colombia
James Dean Brown***
University of Hawai'i at MÄnoa, Honolulu, USA
*opalacio@eafit.edu.co
**sgaviria@eafit.edu.co
***brownj@hawaii.edu
This article was received on October 1, 2015, and accepted on March 28, 2016.
How to cite this article (APA 6th ed.):
Palacio, M., Gaviria, S., & Brown, J. D. (2016). Aligning English language testing with curriculum. PROFILE Issues in Teachers' Professional Development, 18(2), 63-77. http://dx.doi.org/10.15446/profile.v18n2.53302.
This is an Open Access article distributed under the terms of the Creative Commons license Attribution-NonCommercial-NoDerivatives 4.0 International License. Consultation is possible at http://creativecommons.org/licenses/by-nc-nd/4.0/.
Frustrations with traditional testing led a group of teachers at the English for adults program at Universidad EAFIT (Colombia) to design tests aligned with the institutional teaching philosophy and classroom practices. This article reports on a study of an item-by-item evaluation of a series of English exams for validity and reliability in an effort to guarantee the quality of the process of test design. The study included descriptive statistics, item analysis, correlational analyses, reliability estimates, and validity analyses. The results show that the new tests are an excellent addition to the program and an improvement over traditional tests. Implications are discussed and recommendations given for the development of any institutional testing program.
Key words: Classroom tests, integrated language skills, reliability, validity.
Las frustraciones con la evaluación tradicional llevaron a un grupo de profesores del programa de inglés para adultos de la Universidad EAFIT (Colombia) a diseñar pruebas alineadas con la filosofía de enseñanza institucional y las prácticas de clase. Este artículo describe un estudio de validez y confiabilidad de exámenes de inglés, ítem por ítem, para garantizar la calidad del diseño de pruebas. El estudio incluyó estadística descriptiva, análisis de ítems, análisis de correlación, confiabilidad de las estimaciones y análisis de validez. Los resultados muestran que las pruebas son una excelente adición al programa con respecto a exámenes tradicionales. Igualmente se discuten las implicaciones y se hacen recomendaciones para el desarrollo de cualquier programa institucional de pruebas.
Palabras clave: confiabilidad, habilidades lingüísticas integradas, pruebas, validez.
Introduction
Universidad EAFIT is situated in Medellín, Colombia. Adult courses are offered for university employees and students, and employees sent from large companies in the city. Idiomas-EAFIT (Languages-EAFIT) is a division of Universidad EAFIT that offers language instruction for university students and students from the city of Medellín. Idiomas-EAFIT was created 23 years ago and is currently made up of three main units: the Language Center, Sislenguas, and Business English. The Language Center offers English language instruction through three main programs: Adult, Children and Adolescent, and Languages Other than English. Sislenguas offers English language instruction to schools in the city. The Business English program offers English language instruction for executives, managers, and scholars from the public and private sectors. All three units use the Common European Framework of Reference for Languages (CEF) as the basis for aligning their curricula and teaching methodologies, and the main goals are to develop students' communicative competence by providing student-centered classes, encouraging interaction, and presenting a variety of opportunities to produce spoken and written language.
To develop communicative competence, the Idiomas-EAFIT methodology is based on the following principles (Flaitz, 2000):
- Encourage interactions among the students and with the teacher.
- Make materials and practice activities as authentic as possible.
- Focus on meaning as well as on form.
- Provide ample comprehensible input (language addressed to the learner in such a way that, despite the fact that it may contain structures to which the learner has not yet been exposed or which he or she cannot produce, it is still understandable).
- Afford students sufficient time to practice and process information.
- Use a variety of tasks, teaching techniques, and language forms.
- Recognize learner differences.
Assessment and Evaluation at Idiomas-EAFIT
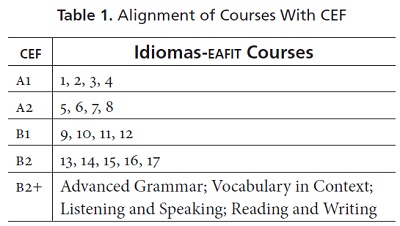
Each of the teaching units described above follows both summative and formative principles of assessment. The Adult program has 17 courses and a series of advanced courses. Each course lasts 38 hours. The courses are aligned with the CEF as shown in Table 1.
In the English program for adults, assessment is divided into two components: oral and written. To assess oral and written performance, teachers use systems that include rubrics, standards, suggested assessment tasks, and writing conventions. In addition to the assessment tasks, the program proposes two tests to be applied during each course: mid-term and final tests. Both the mid-term and final tests are worth 30% each. The remaining 40% is made up of a follow-up grade obtained from different assessment activities that teachers are free to conduct.
Standardized Versus Classroom Assessment
The tests described in this project are all classroom assessments, which is to say that they are primarily designed to test the degree to which students have learned the material taught in the courses they are taking. Brown (2012a) distinguished between two families of testing: standardized assessment (which is also known as norm-referenced testing) and classroom assessment (which is also known as criterion-referenced testing).
Standardized assessment (SA) is very general in nature because the abilities of examinees vary considerably on such assessments. SA is primarily interesting to decision makers like administrators because SAs are designed to help make decisions about things like who will be admitted into a program or school or who should be grouped into which level in a program. SAs are usually organized around a few large subtests, and the scores are always interpreted in terms of each examinee's position in the distribution of scores relative to all the other examinees (Brown, 2012). As a result, SAs are used for language aptitude testing (to help decide which examinees are the best investment for learning a language), proficiency testing (to help decide who has enough knowledge and skills in the language to be admitted to a particular program or school), and placement testing (to help decide which level in a language program is appropriate for each examinee).
In contrast, classroom assessment (CA) is very specific in nature because the assessment is focused only on the material that is taught in a particular course. CA is primarily of interest to teachers because they need to use CAs to determine what percentage of the material the students know or can do in relation to the material in a specific course. Since CAs are usually designed to measure specific course objectives or teaching points, they are often made up of a relatively large number of short, discrete subtests, each of which measures a different objective. In addition, CAs produce scores that teachers usually interpret as percentages of course material the students know or can do (Brown, 2012). As a result, CAs are used for diagnostic assessments (to help determine students' strengths and weaknesses at the beginning of a course relative to the objectives or language points taught in a particular course), progress assessments (to help determine how much progress students have made at some midpoint in a course relative to the objectives or language points taught), and achievement assessments (to help determine how much of the objectives or learning points being taught the students have learned at the end of a course).
One reason that the distinction between these two families of tests is important is that the statistical analyses appropriate for SA and CA are different. Thus most of the analyses presented in this report are appropriate for CAs. In the two cases where that is not true, we will mention and discuss that fact.
Purpose
The purposes of this paper are to examine how well the midterm and final examinations for Courses 5-8 in the Idiomas-EAFIT English Language Assessment Program for Adults1 are functioning and suggest ways to improve individual items as well as the tests as a whole. In the process, we will demonstrate ways to accomplish those tasks for classroom assessments. To those ends, the following research questions were posed:
- What are the distributions of scores for each of the discrete-point tests in this project in terms of descriptive statistics (including the mean, median, mode, high, low, range, and standard deviation)?
- What can item analysis statistics (including item facility, item discrimination, and B index) tell us about each of the items on the discrete-point tests in this project? And how can that information help in improving the tests by revising them?
- To what degree are the discrete-point tests reliable as shown by the K-R21 estimate?
- To what degree are the weighted and unweighted scores correlated? Are the extra steps necessary in the weighting schemes worth the effort?
- To what degree are the final examination subscale scores intercorrelated?
- What arguments can be made for the validity of the scores on the tests in the EAFIT English Language Assessment Program for Adults and the decisions based on them?
Method
Participants
Two groups of people participated in this study test development project: the students at Idiomas-EAFIT and the teachers/test-developers.
Students at Idiomas-EAFIT
Students in Courses 5 to 8 are in the process of consolidating an A2 level of the CEF. At this level, they should be able to comprehend basic and familiar sentences and to understand the main idea in short, simple aural messages. They should identify specific details in short, everyday texts and write short messages. In terms of oral communication skills, A2 students should be able to perform tasks that require simple information on familiar topics and participate in short social exchanges.
Teachers/Test-Developers
The teachers/test-developers were 11 of the teachers who also served as test developers (i.e., teachers additionally responsible for putting together, analyzing, improving, and coordinating the tests in the program), academic coordinators, and academic assistants, who all agreed to regularly attend the workshop described below (see Procedures).
Materials
Test Development Stages
The tests in this project were developed in the following stages:
Stage 1: Curriculum renewal. Adoption of a new ELT textbook; Revision of course syllabi.
Stage 2: Call for participation in test design. Participants were six volunteer teachers, the Adult Program Coordinator, and two academic assistants.
Stage 3: Training course. Course on Language Assessment by agreement with West Virginia University (USA) covered fundamental concepts and principles of language testing.
Stage 4: Item specification. Specifications were developed for use by test editors and writers based on General Suggestions for Writing Test Items and Assessment Tasks (Linn & Miller, 2005).
Stage 5: Test development. Development of the midterm and final examinations began with: Four groups of two were set up to design the new tests; a group of editors met twice a week to proofread and edit final versions; regular team meetings were also held to discuss commitments, update the work plan as needed, and propose new revisions.
Stage 6: Validation of examinations. Calculate, interpret, understand, and use techniques for validating and improving tests.
General Description of Current Tests
Midterm and final examinations in the English for Adults Program at Idiomas-EAFIT are criterion referenced, achievement tests for which item writers follow a set of specifications to design tasks that are connected to performance indicators. There is a variety of item types related to social, academic, or professional situations, and the items are usually linked with a common theme. In terms of the overall administration, instructions are written in English and the writing skill is only measured in the final exam. Both tests have set time limits of 1 hour and 30 minutes. In each case, a marking scheme is suggested in the answer key, and grading specifications are included for the more subjective items. As prescribed in the course syllabus, midterm and final examinations are designed to measure the ability to describe, compare, and contrast people, places, and things.
Discrete-Point Tests
The English for Adults program administers two achievement tests to students during their courses: a midterm and a final exam. The midterm comes in the middle of a four-week intensive course when students have completed one and a half units of the textbook that includes practice in all the language skills. Nonetheless, this test only accounts for listening, reading, and use of language. The writing ability is assessed in the final examination together with listening, reading, and use of language. Both tests cover the course performance indicators and include a variety of items (including open-ended, multiple choice, and true/false statements) that are contextualized to elicit the expected language forms. The items are weighted differently depending on the level of difficulty and are reported by the teacher on a scale of 0 to 5.0 using a standardized answer key. The results are returned to the students the following day for feedback purposes. These examinations impact the teachers in that the tests inform teachers of the areas that need to be reinforced, and the examinations impact the students by informing them of areas they need to revise and catch up on with further practice. The overall grade for both examinations plus the follow-up final examination determine whether or not a student graduates to the next course.
Raw and Weighted Scoring
Items on the descrete-point tests were scored right or wrong, and the total for the raw scores varied from test to test. However, before using the scores to make decisions they were weighted for two reasons. First, we wanted to give more importance to some items than others. Thus, some items might get 1 point and others 2 or more points. Second, in all cases, in order to make the tests comparable, the weightings were arranged such that the maximum possible total weighted score was 50 points on all tests, which is converted to a perfect grade of 5.0 (100% of test correct) and a minimum possible total of 0 weighted points for a minimum grade of 0.0 (0% of test correct). The passing grade was set at 3.0 (equal to 30 points correct or 60% of the test correct).
Procedures
Step 1: Data gathering and entry. The tests in this study were administered by the students' classroom teachers. The data were then gathered and assembled by Idiomas-EAFIT staff.
Step 2: Testing analysis, improvement, and validation workshop. During August, September, and October of 2014, considerable back-and-forth communication was needed to plan and organize the workshop at Idiomas-EAFIT that finally took place and led directly to this article. The Testing Analysis, Improvement, and Validation Workshop that resulted was conducted by one of the co-authors of this paper (Brown) and took place over a one week period.
The workshop had two purposes. First, the workshop was tailored and adapted to the specific needs of these test developers. Thus, the primary goal was to provide comprehensible, hands-on, practical training in the skills necessary to calculate, interpret, understand, and use the techniques described in this report for improving the tests in Idiomas-EAFIT.
Second, the workshop was designed to have participants acually do hands-on analysis of the 22 midterm and final tests for Courses 5-8 and 9-15. Hence, in addition to being trained at a theoretical level, the Idiomas-EAFIT test developers were actually using well-established item analyses techniques to select and improve discrete-point test items including norm-referenced techniques like item facility (IF) and item discrimination (ID) analyses and criterion-referenced techniques like the difference index (DI) and B-index (BI). They were also calculating and interpreting descriptive statistics (including the mean, median, mode, high, low, and standard devitiation) and reliability estimates (including internal consistency estimates for the discretepoint items and inter-subscale reliability estimates for the composition tests).
Results
This section will report on the various analyses that were conducted during this project including descriptive statisics, item analysis, correlationional analyses, reliabilility estimates, and validity analyses. Each of those topics will serve as a heading in this section. Note that these analyses are arranged in more-or-less the same order as the research questions listed above and that direct answers to those reseach questions will be provided in the Discussion section.
Descriptive Statistics
The descriptive statistics in this study include two that are very simple: the number of people who took the test (N) and the number of items (k). However, we will also be presenting three estimates of the central tendency of the scores on a test (the mean, median, and mode) and four statistics that helped us understand the dispersion of the scores (high, low, range, and standard deviation).
Central Tendency
The mean is essentially the same as the arithmetic average. The median is that score point that separates the scores 50/50, with half of the scores above it and half below it. The mode is the score that had the most people on it. These three statistics are useful for interpreting the central tendency of an individual test, but also for comparing the central tendency of two or more tests.
To see how central tendency might be used for interpreting a single test, consider a 50-item final examination called Test X for which the mean, median, and mode turned out to be 24.98, 25, and 25, respectively. Such results would tell us that the examinees had answered about half of the questions correctly. Hence, Test X would seem to be fairly difficult. We could use this information in several ways: We could decide to make Test X easier so that students would not have such a devastating experience; we could decide that we need to teach the material better so that students will score higher next time; we could eliminate material students seem unable to learn; and so forth.
To see how central tendency might be used for comparing tests, consider a 50-point test, which was administered diagnostically at the beginning of a course (called Pre) and also for achievement at the end (called Posttest), for which the means turned out to be 14.17 at the beginning of a course, and 43.77 at the end. Since the Pre and Post tests were the same test, comparing the means at the beginning and end of a 15 week course tells us that the group of students being tested scored much higher at the end than at the beginning. Perhaps the difference in means indicates that the students learned a great deal over the 15 weeks and so scored higher. However, it is also possible that the students (a) remembered the Pre test and the items that they missed on it, (b) looked up the items they missed, and (c) studied those specific test items the night before the Post test. Thus mean differences between sets of test scores can be very revealing, but those differences must be interpreted very carefully indeed.
Dispersion
In addition to the central tendency of the group as a whole, we are also interested in looking at how the individuals varied away from (or dispersed around) the central tendency. The high and low values tell us what the boundaries were for the scores. To find these values, we need only look at the scores and note which was the highest and which was the lowest. For example, let's say that on Test X (with its mean of 24.98) the low score was 12 and the high score was 37. The range indicates the distance between the high and low scores. It is calculated by subtracting the low score from the high score and adding one2 as follows: High - Low + 1. So for Test X that would be 37 - 12 + 1 = 26.
The standard deviation (or simply SD) is considerably more difficult to understand mathematically, but suffice it to say that the SD is "a sort of average of differences of the scores from the mean" (Brown, 2005, p. 102). Let's say for the sake of argument that Test X has a standard deviation of 4.01. Taken together, the range and SD can indicate how the scores have varied away from the mean on a single test, or how much relative variation has occurred on different tests. For interpreting a single test, consider Test X again with its range of 26 (out of 50) and SD of 4.01. That tells us that there is a fair amount of variation around the mean of 24.98, but also that there are probably a number of items that everyone answered correctly (below the low of 12) and others that everyone answered wrong (above the high of 37).
In terms of comparing tests, if two tests have 50 items and are used to test the same 37 people, and Test X has a range of 26 and SD of 4.01, while Test Y has a range of 34 and SD of 5.67, it is clear that the scores on Test Y are more widely dispersed. That could mean that the items on Test Y are discriminating (i.e., spreading the students out) better, or that the group of examinees managed to somehow change between the two testing sessions to become more widely dispersed in their abilities. Thus, differences in dispersion can be very revealing, but those differences (like mean differences) must be interpreted carefully.
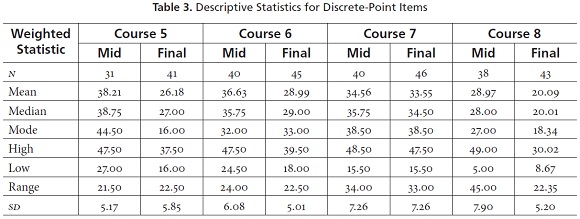
Now let's turn to the descriptive statistics for the Idiomas-EAFIT tests being analyzed here. Tables 2 and 3 show the descriptive statistics for the discrete-point items (i.e., those items that test individual, focused language points in true-false, multiple-choice, fill-in, and short-answer format). Table 2 includes analyses of raw scores (i.e., scored right or wrong with one point per item) at the top of the table and analyses of weighted scores (i.e., scored with different weightings like one point each for certain items, 1.5 points for others, or even 2 points each depending on the relative importance of the items or to balance the weight of different subtests) at the bottom. Notice that the courses are labeled across the top for each set, each of which is shown separately for the midterm (Mid) and Final examinations. To the left in the first column we labeled the different statistics that were applied, including the number of people taking each test (N), the number of items (k), and then the mean, median, mode, high, low, range, and standard deviation (SD).
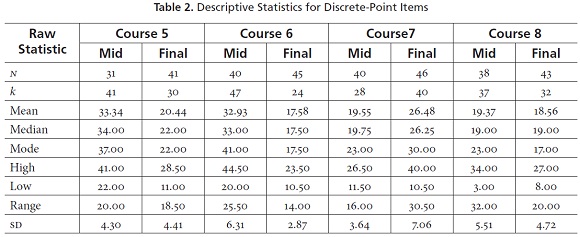
Notice that between 31 and 46 students took each of the tests (N) and that the tests varied in length from 24 items to 47 items (k). The means and medians for each of the raw score tests were fairly similar, though the modes varied away from them considerably in some cases. This illustrates how weak and idiosyncratic the mode can be as an indicator of central tendency. As a result we relied more heavily on the mean and median in interpreting these descriptive statistics, especially the means.
Notice in Tables 2 and 3 that the ranges and sds also vary considerably in magnitude from test to test. This variation may result from differences in the effectiveness of various tests to spread students out on a continuum of abilities, or from simple differences in the ranges of abilities in students enrolled in the various courses. The bottom line is that these descriptive statistics serve as a baseline for understanding how the tests functioned and as the basis for interpreting the other statistics reported below.
Item Analyses
Item analysis is a process used to analyze individual test items and thereby better understand how each one is functioning (especially relative to the functioning of other items) and rewrite or replace those items that are not functioning well for some reason. In this project, we used three item analysis techniques on each test: item facility, item discrimination, and the B-index.
Item facility (IF) is a statistic that describes how easy an item is. IF can range from 0.00 (if everyone answered incorrectly) to 1.00 (if everyone answered correctly) and can be interpreted as the proportion of students who answered correctly. Items that are difficult to very difficult tend to have IFs below .29, indicating that 29% or fewer of the students answered correctly, while items that are easy to very easy tend to have IFs above .71, indicating that 71% or more of the students answered correctly. Items that spread students out effectively according to knowledge or ability differences tend to range between .30 and .70.
Item discrimination (ID) focuses on the issue of spreading examinees out. ID can range from 0.00 to 1.00 and 0.00 to -1.00. ID can be interpreted as the degree to which each item is spreading students out in the same manner as the total scores on the test. A high positive ID value, like +0.97, indicates that an item is effectively spreading examinees out in a manner similar to the total scores on the test. A low ID value, like 0.13, indicates that an item is not effectively spreading students out like the total scores on the test. A negative ID value indicates that the item is spreading students out in a manner opposite from the total scores on the test: Such values can also be high (e.g., -0.97) or low (e.g., -0.13) indicating the degree to which they are spreading students out in a manner opposite from the total scores. In this study, we calculated the ID as an item-total correlation using point-biserial correlation coefficients. Note that ID is typically applied in standardized (or norm-referenced) assessment. We are using it here as one indicator of how the items are performing. However, the B-index discussed next, which was developed for classroom (criterion-referenced) assessments like those in this project, will be considered more important than the ID throughout the item analyses.
The B-index (BI) is similar to ID but it tells us the degree to which each item is helping in making the decision at the pass-fail cut-point on the test. Thus the BI is based on how well the item is contributing to descision at the cut-point for passing or failing the test. In all cases, we used 70% correct as the cut-point for a student to pass a given test. A high positive BI value, like +0.89, indicates that an item is effectively helping us to make the pass-fail decision in a manner similar to the total scores on the test. A low BI value, like 0.10, indicates that an item is not effectively helping us to make the pass-fail decision in a manner similar to the total scores. A negative BI value indicates that the item is working the opposite from the total test scores because it is favoring students who fail the test as a whole. Such items are not helpful at all in making pass-fail decisions.
Table 4 presents an example of how we analyzed the items for all the tests. This table shows the analysis for the Course 5 Midterm. Notice that Table 4 labels the items in the first column (LVSA1 to RVSC10)3 and then provides columns that display the IF, ID, and BI values for each item. In each case, two teachers were looking at the item analysis and the actual items at the same time. Notice that, in the Comments column, they interpreted the item statistics for each item and recorded various observations.
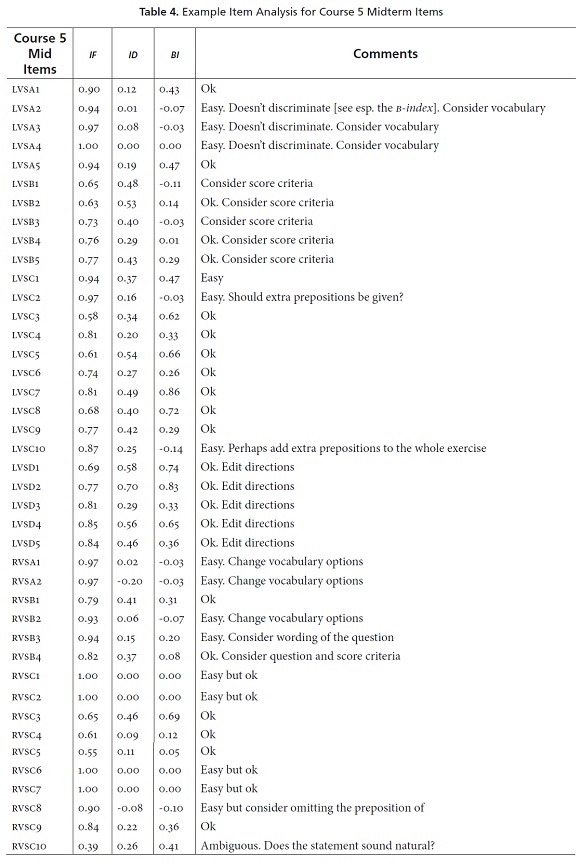
For example, for item LVSA1, the test analysts felt that the item was "Ok". It is an easy item (IF = 0.90), but that is probably okay for the first item on a test because that can help the students get started and feel positive about the test. In addition, item LVSA1 also discriminates a bit (ID = 0.12), but more importantly, it is helping considerably more with the pass-fail decision (BI = 0.43) compared to the other items on the test. Consider another example, item LVSA2. In this case, the test analysts noted that this item is also easy and does not discriminate, but they also provide an idea for how to fix the item during the revision process, when they write "Consider vocabulary," which probably means that adjusting the vocabulary level might improve this item's performance. In the rest of Table 4, you can see that the test analysts went right through the whole test and analyzed the items in a similar manner. Such analyses and observations will prove very useful when the test development team sits down to revise and improve the test.
Reliability
Reliability is one important characteristic of a test that indicates the degree to which the test is measuring consistently. Reliability can be examined for consistency across time, over multiple forms, or among the items on the test (these three are technically known as test-retest, equivalent forms, and internal consistency reliabilities, respectively). Most reliability estimates have been developed for use with standardized or norm-referenced tests. However, in this study, we applied the K-R21 internal consistency reliability, which is appropriate as a reliability estimate for classroom assessments like those in this project (as argued in Brown, 2005). These K-R21 values are shown in Table 5.
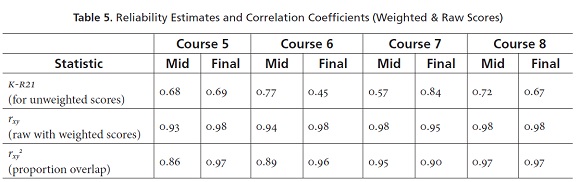
Notice in Table 5 that the values range from 0.45 to 0.84 with the majority of the tests above 0.65. These values can be interpreted directly as proportions or percentages. So it is correct to say that these tests range from 45% to 84% reliable, which further means that they have low to moderately high reliability. Values above .65 are probably acceptable in this context because decisions, especially grades, are not based solely on single sets of test scores. More than one test is used (e.g., both midterms and finals), along with additional types of information. However, the relatively low values for the Course 6 Final and Course 7 Mid indicate that these two tests may be ones that might most benefit from attention and revision in the item analysis and revision processes.
Correlations of Raw Scores with Weighted Scores
The Pearson product-moment correlation coefficients (rxy), shown in the second row of numbers in Table 5, were calculated to address the fourth research question about the degree to which weighting was different from not weighting the scores. For the purpose of understanding these results, it is important to know that correlation coefficients for relationships like these can range from 0.00 to 1.00. For situations where there is absolutely no relationship between the numbers, the correlation coefficient will be 0.00; in situations where the two sets of numbers are perfectly related in terms of ranking and distances between the scores, the correlation coefficient will be 1.00; and of course, values anywhere between 0.00 and 1.00 can occur as well. Notice that correlation coefficients reported in Table 5 (for the relationship between raw scores and the weighted scores) range from 0.93 to 0.98. These correlation coefficients are all very high, indicating that the weighted scores are very similar to the raw scores in terms of how they rank the students as well as the relative distances between students' scores.
In order to examine how much overlap there is in the variation of raw and weighted scores, we have reported the squared values of the correlation coefficients (rxy2) called coefficients of determination. These values indicate the proportion of overlapping variation between the weighted and raw scores, and they can be interpreted as proportions or percentages. Notice that the coefficients of determination reported in Table 5 go from 0.86 to 0.96, meaning that the amount of overlapping variation between weighted and raw scores ranges from 86% to 96% with all of the tests above 86%.
All of this information suggests that it may not be worth the effort involved in deciding on weights, scoring different parts of the test with different points per item, and then deriving the total scores from those different weighted subparts. All that complexity may just be confusing to the students, may be introducing scoring errors by the teachers, and is adding nothing to the way the tests are functioning. However, there may be sound pedagogical reasons for maintaining this weighting system, which is of course a decision that must be made by the faculty at Idiomas-EAFIT.
Discussion
Discussion of Research Questions 1 to 5
We addressed research questions (RQs) 1-5 in a technical sense in the Results section above. However in lay terms, we showed (RQ1) the distributions of scores for each of the discrete-point tests and composition tests in this project in terms of descriptive statistics (including the mean, median, mode, high, low, range, and standard deviation). We also explored (RQ2) what item analysis statistics (including item facility, item discrimination, and the B-index) could tell us about each of the items on the discrete-point tests in this project, as well as how that information can be used to help revise and improve the tests. In addition, we investigated (RQ3) the degree to which the discretepoint tests were reliable as estimated using K-R21, and studied (RQ4) the degree to which weighted and unweighted scores were correlated and the fact that these extra steps in the weighting schemes may not be worth the effort. In addition, we examined (RQ5) the degree to which the final examination writing subscale scores were intercorrelated.
Discussion of Research Question 6
The sixth research question was What arguments can be made for the validity of the scores on the tests in the EAFIT English Language Testing Program and the decisions based on those scores? Generally, the notion of validity is defined as the degree to which the scores on a test are measuring what they were intended to measure. For standardized assessments, content, criterion-related, construct, consequential, and values implications validities are often examined, improved, and/or verified. For classroom assessments, like those in this project, content, consequential, and values implications validities are most appropriate.
Content Validity
At the Idiomas-EAFIT, item writers, test editors, and teachers are accountable for the content validity of tests. The first group designs the test tasks relying on the test specifications, which include general guidelines that will help test construction. Likewise, test editors meet to consider each item in light of the guidelines, carefully matching items to course standards, possible level of difficulty, ambiguities in the wording of instructions or items, unforeseen audio problems, and layout. Finally, for proofreading purposes, teachers—the ones teaching the courses each test was designed for—get a copy of the test and respond to a questionnaire patterned after the test specifications. Test editors collect this feedback, make the necessary amendments, and revise the test. Having this moderating committee has allowed for the ongoing revision of test items and course standards in a cyclical process including standards, curriculum, instruction, and assessment.
Consequential Validity
Most of the students involved here enrolled in English classes as a requirement for graduation as stipulated by the university's bilingualism policy. When students fail a specific course in the program, they are not allowed to register any of the credits for that academic semester. The consequence of getting behind in their studies also affects their expected graduation date.
We must also point out that we are using the B-index in our item analyses to select those items most closely related to the pass-fail decision on each test. During the test revision process, we intend to improve or replace those items that are least helpful in making these decisions. In other words, we are making every effort to improve the degree to which the items are contributing to our pass-fail decisions. Hence, we are systematically increasing the degree to which our pass-fail decisions are valid in the consequential sense of that term.
Values Implications Validity4
The academic coordinators at Idiomas-EAFIT believe that assessment and evaluation are powerful agents for introducing positive changes in education. We have been partially successful in designing and implementing an oral assessment system; however, we felt our institutional tests were not causing sufficient positive effects on teaching and learning, mostly because they were traditional in nature using item formats such as fill-in-the-blanks, multiple choice, and matching.
It is widely known that traditional tests are often incongruent with current language classroom practices because such tests are not useful for collecting information about the students' cognitive abilities, attitudes, motivation, interests, and learning strategies (Herman & Winters, 1994; Madaus, 1988; Resnick & Resnick, 1992; Wiggins, 1989, 1994). More precisely, the authors just cited claim that conventional tests do not provide helpful information about the process of learning and the measurement of student progress needed for formative decision-making and for planning instructional strategies. Furthermore, such tests do not require students to
create and perform communicative and functional tasks. Consequently, information obtained from standardized tests do not inform the stakeholders (e.g., learners, teachers, parents, program coordinators, administrators) as to whether or not the students will be able to perform authentic tasks in the real world. (Adair-Hauck, Glisan, Koda, Swender, & Sandrock, 2006, p. 363)
Frustrations with such traditional testing led the academic coordinators at Idiomas-EAFIT to envision a new assessment system, one in which testing is better integrated with learning and classroom practice and in which tests follow communicative principles of language teaching and learning. In other words, we aimed to have tests that better reflected our teaching values by integrating skills performance in more authentic ways and that allowed teachers to be confident about the decisions they make.
Recommendations
Considering the discussion of validity in the previous section and the other analyses presented in this report, it appears that the examinations under investigation are an excellent addition to the program and a vast improvement over previous assessment practices. Nonetheless, any testing program can be updated and improved. To that end, we suggest the following nextsteps in the process:
- Use the item analyses and other information generated by this project to delete, replace, and improve any items that need to be improved in all discretepoint tests.
- Consider the analyses presented here that focused on comparing the weighted items versus raw (i.e., unweighted) scoring of items on the discrete-point tests and decide whether the pedagogical and other arguments that favor continuing to use the weighted items scheme are worth the extra effort involved.
- Continue investigating the effectiveness, efficiency, and quality of the items (using item analysis), the reliability of the discrete-point tests (using K-R21) and of the writing assessment scoring (using the inter-category correlation strategy demonstrated in this report), and the validity of all the tests (content, consequential, and values implications perspectives on validity).
Conclusions
While developing, administering, analyzing, validating, and improving the tests in this project we encountered a number of challenges. The most prominent of these are the following:
- We often found a general lack of teacher consensus on test scoring, which may have led to subjective marking of open-ended items because of rater inconsistencies.
- There was also a general lack of training on how to design follow-up activities that resemble the ones on tests.
- We also found it difficult to design listening items using authentic audio materials that were appropriate to each level of proficiency, that matched the unit themes, and that assessed the different sub-skills contemplated in the course standards.
- As is often the case, budgetary support from the administration was sometimes a challenge.
Implications
Nonetheless, having a team of item writers allowed for collaborative design and ongoing revision of items and course standards in a cyclical process where standards, curriculum, instruction, and assessment were interwoven in the learning process, and each informed the others.
If there is only a single item writer, or only a few item writers working closely together, it may prove more efficient to create items directly from course objectives. Such a process can lead not only to clear and consistent item creation, but also beneficial revision of the objectives as flaws are spotted in the process of trying to measure those objectives. (Brown, 2005, p. 78)
In addition, designing curriculum-related items has started to have an impact on some teachers' instructional and assessment practices. We expect all teachers will gradually improve their abilities to determine how to best improve their classroom practices. Teachers need to produce contextualized, criterion-based assignments and assessments that elicit grammatical responses appropriate to a given context.
Naturally, improvement of student learning may require a longer period of development and observation. We need to continuously examine student performance on tests and monitor progress to be able to establish the degree to which course standards are being attained.
Overall, changes like those proposed in this project demand a new set of skills from both students and teachers. For example, based on this project, the assessment program has the information needed to conduct calibration sessions in which teachers can discuss problem items and discrepancies in scoring that will hopefully lead to their reaching a consensus about the best ways for the program to move forward. One goal of any such discussions should be ways to provide better training for teachers in how to use the rubrics more reliably.
Breaking the traditional paradigm represents a long term endeavor in that
Teachers find it a daunting task to switch from traditional testing formats, which offer more control for teachers, to more open-ended, and perhaps of greatest significance is that many teachers fear that performance-based or authentic assessment requires too much class time. (Adair-Hauck et al., 2006, p. 363).
1For reasons of length, Courses 9-15 are not included here. To see the complete results including those courses, please see Palacio et al. (2015).
2Note that we need to add 1 so that both the highest and lowest scores will be included. In a simple example with the scores 1, 2, 2, 3, 3, 3, 3, 4, 5, that would mean the range is 5 - 1 + 1 = 5, which includes both the 1 and the 5. If we did not add 1, the range would be 4, thus either the 1 or the 5 would be left out.
3LVSA1 = Listening + Vocabulary + Structure Item A1. RVSC10 = Reading + Vocabulary + Structure Item C10.
4This section was adapted from Muñoz (2013).
References
Adair-Hauck, B., Glisan, E. W., Koda, K., Swender, E. B., & Sandrock, P. (2006). The Integrated Performance Assessment (IPA): Connecting assessment to instruction and learning. Foreign Language Annals, 39(3), 359-382. http://dx.doi.org/10.1111/j.1944-9720.2006.tb02894.x. [ Links ]
Brown, J. D. (2005). Testing in language programs: A comprehensive guide to English language assessment. New York, NY: McGraw-Hill. [ Links ]
Brown, J. D. (2012). Choosing the right type of assessment. In C. Coombe, S. J. Stoynoff, P. Davidson, & B. O'Sullivan (Eds.), The Cambridge guide to language assessment (pp. 133-139). Cambridge, UK: Cambridge University Press. [ Links ]
Flaitz, J. (2000). Teaching commnicatively. Unpublished manuscript, Centro de Idiomas, Universidad EAFIT, Medellín, Colombia. [ Links ]
Herman, J. L., & Winters, L. (1994). Portfolio research: A slim collection. Educational Leadership, 52(2), 48-55. [ Links ]
Linn, R. L., & Miller, M. D. (2005). Measurement and assessment in teaching (9th ed.). Upper Saddle River, NJ: Prentice Hall. [ Links ]
Madaus, G. F. (1988). The influence of testing on the curriculum. In L. N. Tanner (Ed.), Critical issues in curriculum: Eighty-seventh yearbook of the National Society for the Study of Education - Part 1 (pp. 83-121). Chicago, IL: University of Chicago. [ Links ]
Muñoz, A. (2013). Beyond testing. Unpublished manuscript, Centro de Idiomas, Universidad EAFIT, Medellín, Colombia. [ Links ]
Palacio, M., Kashani, S., Gaviria, S., Salazar, R., Estrada, A., Botero, A. M.,... Brown, J. D. (2015). Report on the 2014- 2015 Idiomas-EAFIT English testing program. Medellín, CO: Universidad EAFIT. [ Links ]
Resnick, L. B., & Resnick, D. P. (1992). Assessing the thinking curriculum: New tools for educational reform. In B. R. Gifford & M. C. O'Connor (Eds.), Changing assessments: Alternative views of aptitude, achievement, and instruction (pp. 37-75). Boston, MA: Kluwer. http://dx.doi.org/10.1007/978-94-011-2968-8_3. [ Links ]
Wiggins, G. (1989). A true test: Toward more authentic and equitable assessment. Phi Delta Kappan, 70(9), 703-713. [ Links ]
Wiggins, G. (1994). Toward better report cards. Educational Leadership, 52(2), 28-37. [ Links ]
About the Authors
Marcela Palacio holds an ma in Interdisciplinary Studies from State University of New York and a ba in Languages from the University of Antioquia (Colombia). She is the Academic Assistant of the English for Adults program at Universidad EAFIT, Medellín. Her current research interests cover assessment and motivation.
Sandra Gaviria holds a Master's Degree in tesol from West Virginia University and a Master's in Education from Maharishi University of Management. She has been the English for Adults Program Coordinator at Universidad EAFIT since 2000. Her main interests include assessment and curriculum design.
James Dean Brown is currently Professor of Second Language Studies on the graduate faculty of the Department of SLS at the University of Hawai'i at Manoa (USA). His areas of specialization include language testing, curriculum design, program evaluation, and research methods.
Acknowledgements
We would like to thank Ana Patricia Muñoz Restrepo for her great help in organizing, supporting, and overseeing the workshop at EAFIT that led to this report. We would also like to thank Shayan Kashani, Jose Rodrigo Salazar Jaramillo, Alejandro Estrada, Ana María Botero, Catalina Jaramillo, Yasmín López, Juan Pablo Mora Alzate, Jaime A. Naranjo, and Claudia Gil Arboleda, all of whom participated in the workshop and did their share of the analyses. Finally, we would like to recognize the important contribution of Luis Fernando Builes, who put in many hours transferring the data for this project from paper tests into Excel spreadsheet files.

