Services on Demand
Journal
Article
 English (pdf)
 Article in xml format
 Article references
 Send this article by e-mail
Indicators
-
 Cited by SciELO
 -
 Access statistics
Related links
-
 Cited by Google
 -
 Similars in
SciELO
Similars in
SciELO -
 Similars in Google
Share

 Permalink
Ecos de Economía
Print version ISSN 1657-4206
ecos.econ. vol.20 no.42 Medellín June 2016
https://doi.org/10.17230/ecos.2015.42.3
RESEARCH ARTICLES
Global trends in relative and absolute income inequality
Tendencias mundiales de desigualdad de ingreso en términos absolutos y relativos
Thomas Goda*
Universidad EAFIT, Colombia. Email address: tgoda@eafit.edu.co
Received: 19/04/2016 Accepted: 13/05/2016 Published: 17/06/2016
Abstract
This paper provides an overview of historic worldwide trends in relative and absolute income inequality. Depending on the concept used, inequality trends differ considerably. Inequality between countries increased strongly during 1820-2000 and started decreasing at the beginning of the twenty-first century, whether measured in relative or absolute terms. Within-country inequality, on the contrary, grew especially strongly during the last decades: Its growth rate accelerated after 1950 in absolute terms and after 1975 in relative terms. Absolute global inequality also increased substantially in the post-1950 period, whereas relative global inequality decreased slightly during this period.
Keywords: Global income inequality; relative inequality; absolute inequality; personal income distribution
Resumen
Este documento muestra una visión general de las tendencias históricas de la desigualdad mundial de ingreso en términos absolutos y relativos. Dependiendo del concepto usado, las tendencias de desigualdad difieren considerablemente. La desigualdad entre países aumentó fuertemente durante el periodo 1820-2000 y ha comenzado a disminuir a principios del siglo veintiuno, independiente si es medido en términos relativos o absolutos. La desigualdad dentro de los países, por el contrario, ha crecido especialmente fuerte en las últimas décadas: su tasa de crecimiento aceleró a partir de 1950 en términos absolutos y a partir de 1975 en términos relativos. En términos absolutos la desigualdad global también se incrementó sustancialmente en el periodo post-1950, mientras en términos relativos la desigualdad global ha disminuido ligeramente en el mismo periodo.
Palabras clave:Desigualdad de ingreso global; Desigualdad relativa; Desigualdad absoluta; Distribución personal del ingreso.
JEL classifications: D31, N3
1 Introduction
Research on inequality and on the impact of changes in income distribution on economic processes and social conditions has a long history in economics and was prominent in the works of Smith, Ricardo, Mill and Marx. While the topic fell somewhat out of fashion in the last quarter of the twentieth century (Atkinson, 1997), it has again moved into the centre of political and economic debates. One important reason for the recent revival in interest is new empirical evidence that suggests that high and growing inequality can have adverse effects on macroeconomic stability and can hurt economic growth (Herzer and Vollmer, 2012; 2013; Stiglitz, 2012; Goda and Lysandrou, 2014; Halter et al., 2014; Onaran and Galanis, 2014; Ostry et al., 2014; Stockhammer, 2015; Kumhof et al., 2015; OECD, 2015).
Separate from any concerns about its economic impacts, social scientists have long been con cerned about whether income inequality beyond certain levels may be fundamentally unfair, either within or across countries (Seers, 1972; Sen, 2000). Historically, the idea of class struggle arose from a perception that individuals in the upper portion of the income distribution had too large a share of national income. This same concern has reappeared in the arguments of the anti-globalization movements (Ravallion, 2004) and in the discourse of the Occupy movement (''We are the 99%'') that started shortly after the financial crisis of 2008 (Keister, 2014).
Most of the recent evidence about rising income inequality within countries and its adverse consequences is based on data from developed countries (especially the USA); yet, if rising inequality is perceived as causing unfairness and is hampering growth in developed economies, the magnitude of these problems could be even greater in the context of the global changes underway. As a consequence, it is critical to also examine the trends in income inequality between countries, within developing countries, and between global citizens.
Lately there has emerged a substantial empirical literature about global inequality (e.g., Milano- vic, 2005; 2012, 2013; Sala-i-Martin, 2006; Piketty, 2014; van Zanden et al., 2014), but this literature has a limitation in that it is focused on the Gini and Theil Indices, which both measure relative differences between incomes (i.e. ratios of incomes to the mean). Inequality also can be measured in absolute monetary terms, and absolute and relative inequality trends can be quite different. If, for example, the income of the whole population increases by the same percentage, the Gini and Theil coefficients remain constant, even though the absolute income gap increases. The most appropriate measures to estimate the absolute degree of inequality are the Absolute Gini Index and the variance (see Chakravarty, 2001).1
Various surveys show that people refer to both absolute and relative income differences when they talk about inequality (Ballano and Ruiz-Castillo, 1993; Harrison and Seidel, 1994; Amiel and Cowell, 1999), which might explain the conflicting assessments about the distributional outcomes of globalization. Depending on whether people have a ''relative'' or ''absolute'' inequality view, they claim that globalization leads to rising or declining income inequality around the globe (Ravallion, 2004; Atkinson and Brandolini, 2010).
Moreover, for certain types of problems, changes in absolute inequality may be more important than changes in relative inequality (and vice versa). Standard economic theory argues, for example, that rising absolute income differences increase the expected utility of illegal activities and thus generate incentives to engage in property crimes (Fleisher, 1966; Ehrlich, 1973). Relative income inequality, on the other hand, is often seen to foster violent crimes because it is associated with social strains and the feeling of relative deprivation (Agnew, 1985, 1992; Hagan and Peterson, 1995). With regard to economic stability, it has been shown that absolute inequality can affect the demand for assets and thus lead to unsustainable asset price booms (Froud et al., 2001; Goda and Lysandrou, 2014), while relative inequality partly explains why poor and middle-income US households became over indebted in the run-up to the subprime crisis of 2007 (Rajan, 2010; Hein, 2012; van Treeck, 2014).
The aim of this paper is to provide an overall picture of the historic trends in relative and absolute between-country, within-country, and global income inequality. Existing studies that present longrun income inequality trends on a global scale either present relative (Bourguignon and Morrisson, 2002; Milanovic, 2005; van Zanden et al., 2014) or absolute estimates (Goda and Torres García, 2016). As such, this is the first study that contrasts changes in relative and absolute inequality between 1820 and 2010 to establish if these two measures have moved in the same or in opposing directions.2
The main conclusions from this examination are that: (i) income inequality between countries increased strongly during 1820-2000 and started decreasing at the beginning of the twentieth-first century, irrespective of whether measured in relative or absolute terms; (ii) within-country inequality grew especially strongly after 1950 in absolute terms and after 1975 in relative terms; (iii) absolute global inequality also increased very substantially in the post-1950 period, whereas relative global inequality decreased during the last three decades; and (iv) today's global relative and absolute inequality levels are much higher than they were in 1820.
The structure of the paper is as follows: Section two briefly outlines the existing concepts and alternative measures of income inequality. Section three presents the findings regarding the level and trend of between-country inequality. Section four provides an overview of the observed changes in global within-country inequality. Section five discusses the historical trend changes in global income inequality. Section six concludes.
2. Three concepts of inequality and their relative and absolute measurement
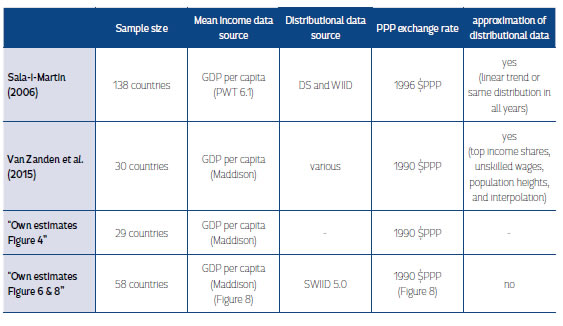
Relative income inequality refers to the average disproportionality of income, whereas absolute inequality conceptualises income differences in money terms. To make the difference between these two inequality measures more palpable, Figure 1 demonstrates an income neutral change in relative and in absolute terms. Initially, Country A has an income of $5,000 while the income of Country E is $45,000 (light grey bars). If the income of all countries increases by 20% (black bars), Country E still has 9 times the income of Country A but the absolute income difference between the two countries increases to $48,000. If the income of all countries increases by $9,000 (dark grey bars), the absolute income difference between these two countries remains $40,000, but now Country E 'only' has approximately four times Country A's income.3 This simple comparison shows that absolute and relative inequality trends can differ significantly.
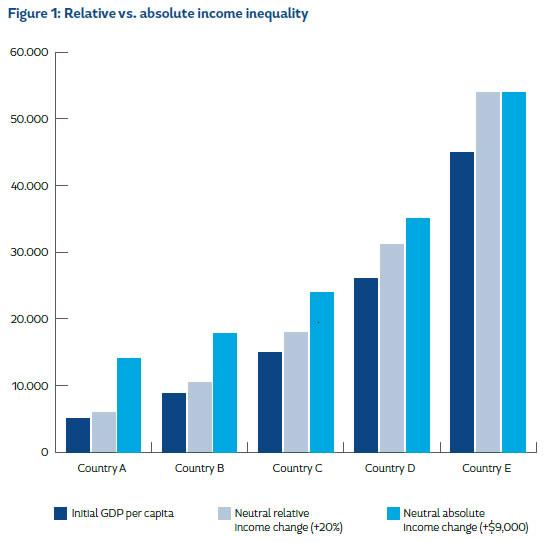
The most widely used indicator to measure relative inequalities is the Gini Index. The lower bound (0 = total equality) and the upper bound (1 = total inequality) of this indicator can easily be understood by the broader public, and it can also be nicely presented graphically (via the Lorenz curve). A second commonly used relative inequality indicator is the Theil Index, the lower bound of this indicator is also zero but its upper bound is the logarithm of the sample size. Both indices are highly correlated, yet an advantage of the Theil Index over the Gini Index is that it can establish precisely to what degree global inequality changes are due to changes in withinand between-country inequality (see Cowell (2000) for an in-depth discussion). The Gini Index (G) and the Theil Index (TL) can be expressed as follows:
where N is the population size, μ is the mean income, yi is the income of the i-th individual, and yj is the income of the j-th individual.
The respective absolute counterparts of the Gini Index and the Theil Index are the absolute Gini Index and the variance, the main difference being that they are not normalized by the mean income of the country (within-country inequality) or the world (between-country inequality). In line with their relative counterparts, only the variance allows the precise decomposition of global inequality into its withinand between-country components (Chakravarty, 2001; Chakravarty and Tyagarupananda, 2009). The absolute Gini Index (GA)4 and the variance (V) can be written as follows:
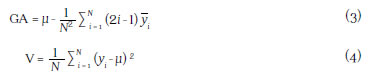
where is the welfare ranked permutation of y 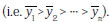 .
.
Relative and absolute inequality measures can be applied in a wide array of circumstances. For the purposes of this paper, we apply both in three circumstances: within-country, between-country and global inequality. Within-country inequality refers to income differences between individuals in a specific country (individual income data are typically retrieved from household surveys). These income differences can be measured either without accounting for direct tax payments and transfer receipts (market inequality) or by taking these income reducing/increasing changes into account (net inequality). Typically, within-country market inequality estimates are higher than within-countrynet inequality estimates, given that direct tax payments and transfer receipts tend to be progressive.
Between-country inequality, on the other hand, concerns differences in the average income of countries (typically measured by GDP per capita data adjusted for purchasing power parity (PPP)). Finally, population size-adjusted inequalities between and within countries are used to estimate the degree of inequality between global citizens.5 To be more precise, the concept of global inequality compares the incomes of poor people in rich countries with that of rich people in poor countries, the incomes of rich people in poor countries with that of poor people in rich countries, etc. (See Figure 2 for an illustration of these three concepts).
Before presenting the respective inequality trends, a cautionary note is required. As things stand, there exist important shortcomings in the availability and quality of inequality data (despite important advances during recent years). These shortcomings are especially notable with respect to household surveys, which differ in their inequality concepts (consumption, expenditure, net-income, or gross-income), in their reference units (family, household, individual), and in their sources (Francois and Rojas-Romagosa, 2007). Moreover, household surveys often under-represent both very poor and very rich households, and they suffer from non-responses and misreporting — deliberately or due to missing information (Atkinson and Brandolini, 2001; Guénard and Mesplé-Somps, 2010). The latter point applies especially for the upper tail of the distribution, so many household surveys oversample high-income households. However, existing oversampling strategies are not one-hundred percent successful.6 Consequently, tax data are often used to measure the highest incomes (Atkinson et al., 2011) and to adjust the overall income distribution data accordingly (Lakner and Milanovic, 2013; Solt, 2014). However, recent evidence shows that the very rich often successfully evade taxes (Palan et al., 2010; Henry, 2012; Zucman, 2015)7, which casts doubt on the reliability of these tax-adjusted data. In sum, the inequality estimates presented below are not very precise and most likely underestimate the true extent of inequality.
3. Historic trends in between-country income inequality
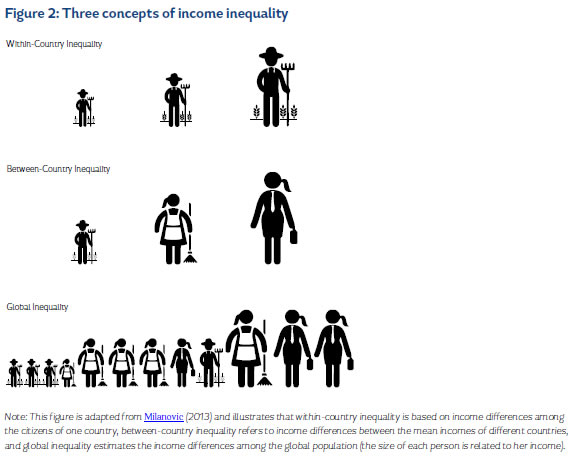
The existing data show that in relative terms a Great Divergence in income between countries took place during the 19th and 20th century. In 1820, the GDP per capita of most countries was relatively equal but during the following 180 years, today's developed countries had significantly higher average growth rates than the rest of the world. As a result, the between-country Gini coefficient nearly tripled during this period, from 0.20 in 1820 to 0.54 in 2000 (Figure 3a). Accordingly, the gap between the richest and the poorest country in 2000 was much higher than in 1820: the mean GDP per capita of the richest country was six times that of the poorest country in 1820, whereas in 2000 this multiple increased to 134.8
Recent estimates from Milanovic (2012; 2013) suggest that the current level of relative between-country inequality is even higher than previously thought (Figure 3b). The reason for the higher inequality levels being that the PPP estimates from the 2005 survey of the International Comparison Program (ICP) led to a downward revision of PPP-adjusted GDP estimates in many developing countries (e.g. by 40% in China and India).9 Figure 3b also shows that, after a relatively steep inequality increase in the 1990s, the 'Great Divergence' between countries not only stopped but that it was replaced by a convergence process from 2000 onwards.
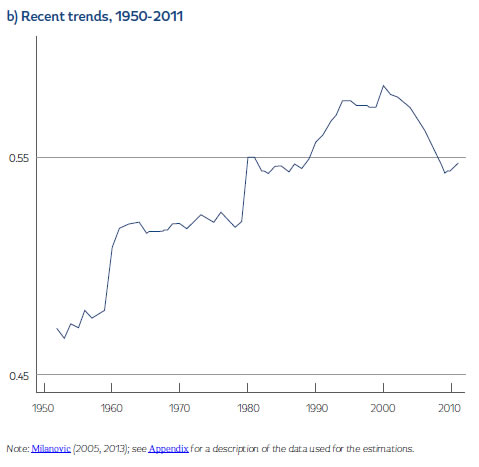
The inequality increase in the 1990s took place due to the sluggish growth performance in Latin America, the decline in Eastern European/former Soviet Union incomes, and the disastrous economic developments within many African economies (Milanovic, 2005). In the 2000s, on the contrary, a commodity price boom led to favourable economic conditions in commodity-producing developing countries, with the result that average annual GDP per capita growth rate in these countries was relatively high10 while at the same time developed countries experienced relatively slow growth.
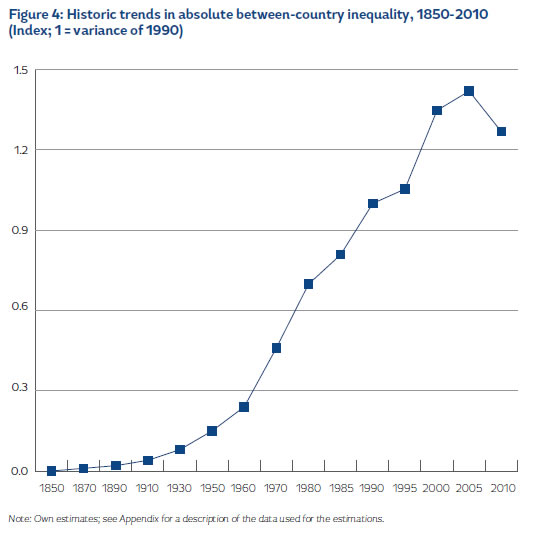
Figure 4 shows that inequality between countries has increased much more in absolute than in relative terms.11 This is especially true for the second half of the 20th century: between 1950 and 2000 the annual growth rate of absolute between-country inequality was 3.6%, while it was 2.7% during 1850-1910 and 1.8% during 1910-1950. Having said that, after 2005 for the first time since the beginning of the industrial revolution, absolute income convergence took place between developing and developed countries (for the same reasons that are mentioned above). Accordingly, especially after 1980, relative and absolute between-country inequality have exhibited similar trends.
4 Historic trends in within-country income inequality
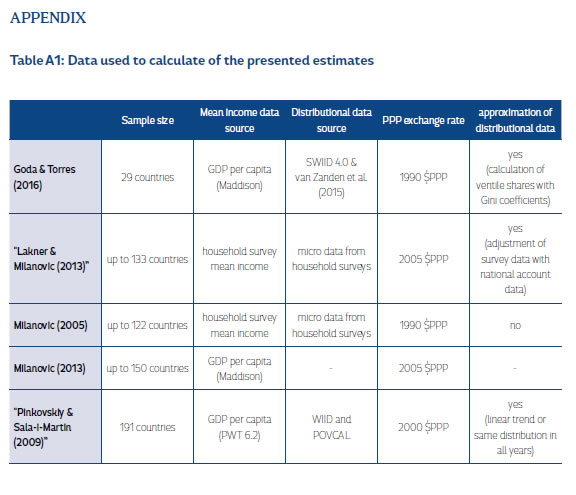
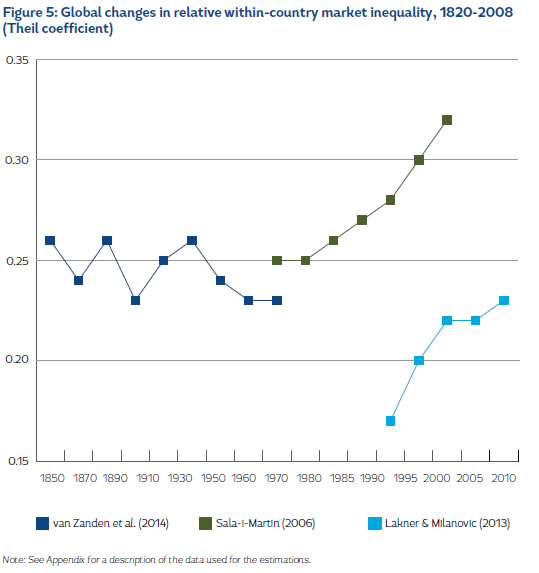
Given the discussed data shortcomings (see Section 2), and considering that existing studies and inequality databases use different methodologies (see Anand and Segal (2008)) and source data (see Table A1 in the Appendix), it is not possible to state the exact degree of within-country inequality. Having said that, there is a broad consensus on its overall trends. When measured at a global level, relative within-country inequality shows no clear trend between 1820 and 1929 (i.e. the level of inequality was the same in 1929 as it was in 1820) but, following a decrease during 1929-1960, it demonstrates a sharp upward trend after 1975 (Figure 5). The main driver for the recent rise of global within-country inequality is the increasing inequality levels in populous countries (including China, India, and the USA), which led to the situation that today ''seven out of 10 people live in countries in which the gap between rich and poor is greater than it was 30 years ago'' (Oxfam, 2014, pg.8).
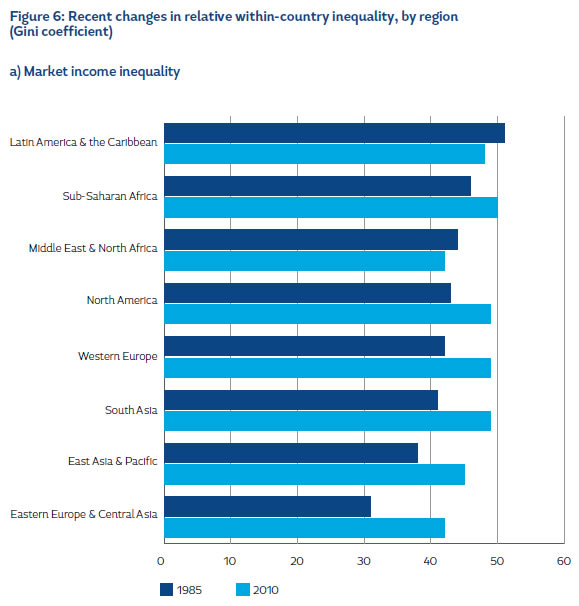
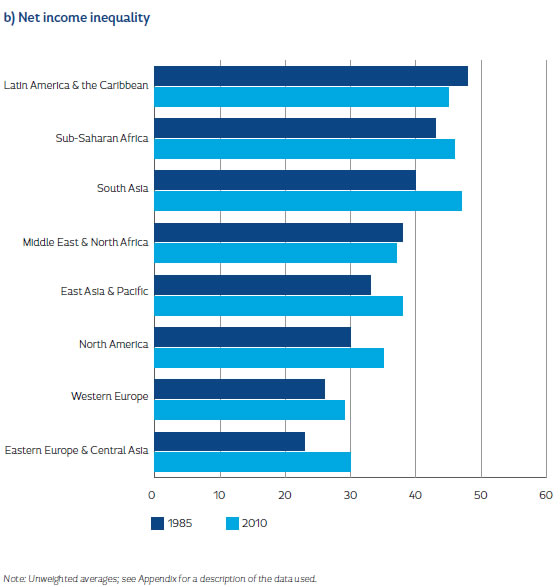
If one compares regional inequality averages for the year 2010 with that of the year 1985, it be comes apparent that both relative market and net income inequality increased significantly within Northern American, European, Asian and Sub-Saharan African countries, whereas it declined moderately within Latin American and Caribbean (LAC) and Middle Eastern and North African countries (Figure 6).12 The outcome of these diverging trends is that today the market income Gini averages of all regions are relatively similar, with values between 42 and 50. This finding challenges Kuznets' (1955, 1965) inverted-U hypothesis of income inequality that states that economic development first leads to a rise and later to a decline of income inequality within countries.13
The net income inequality averages, on the other hand, reveal important regional differences (Figure 6b). While the net Gini averages of European countries are below 30, the net Gini values of LAC, Sub-Saharan Africa and South Asia are nearly the same as their market Gini values. In other words, these data reveal that some regions have relatively strong redistributive policies while others have not.
The most important reason for the recent rise of relative inequality in North America and Western Europe is an over-proportional increase in top incomes (OECD, 2011). The increase in the top income share is primarily due to (i) the failure of real wages to increase as much as productivity, which means that between 1980 and 2010 the profit share rose by approximately 12 percentage points in Japan, 10 percentage points in continental European countries, and 5 percentage points in the UK and US (Stockhammer, 2015); (ii) the over-proportional increase of top management and superstar wages (see e.g. ILO, 2008; Ellis and Smith, 2010; Atkinson et al., 2011); and (iii) the rising concentration of capital-related income (see e.g. OECD, 2011).
The resulting increase in market income inequality was not offset by redistribution because this inequality was growing twice as fast as redistributive transfers, partly because redistributive policies in rich countries became weaker (Immervoll and Richardson, 2011). This meant that inequality ''first began to rise in the late 1970s and early 1980s in some Anglophone countries, notably in the United Kingdom and the United States, followed by a more widespread increase from the late 1980s on'' (OECD 2011, p.6). Accordingly, total income shares of the top 1% income earners were increasing in nearly all developed countries for which data is available after 1985 (Atkinson et al.'s, 2011).
It is more difficult to generalize about the causes of the changes in income inequality in developing countries, and it is beyond the scope of this paper to undertake an in-depth discussion of this par ticular subject. One of the possible explanations as to why within-country inequality also increased in many developing countries is that the profit share also increased in most of these countries (ILO, 2008). In the case of Asian and Eastern European countries, this increase went hand in hand with profound market reforms that also led to an increase in the top income share (this was especially true in the case of China and Russia, see Atkinson et al., 2011).
By contrast, Middle Eastern, North African, and LAC countries experienced only minor changes in their inequality levels (Figure 6). It is important to note that in the LAC region the inequality trend was u-shaped: inequality levels first increased due to the debt crisis in the 1980s and in the decade following the 'lost decade', reaching their peak in the late 1990s, and then decreased again. The post2000 development was mainly related to the commodity price boom, to more employment in the formal sector, to higher incomes in rural areas, to the decline in the skill premium, and to an increase in social government spending (Cornia, 2010; Gasparini et al., 2011; Lustig and Gasparini, 2011).
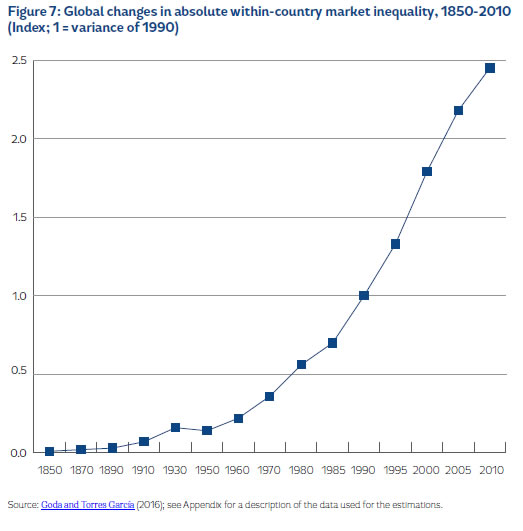
Figure 7 shows that the increase of absolute within-country inequality was much more pronounced than that of relative within-country inequality. This figure also shows that the increase was espe cially large after 1950: the post-1950 average annual growth rate of absolute global within-country inequality was 4.8%, while it was 3.2% during 1850-1910 and 1.8% during 1910-1950. In line with the absolute between-country inequality, absolute within-country inequality only declined in one period. Important reasons for the decline during 1929-1950 were the bankruptcies and destruction caused by the Great Depression and WW II and the increase in government involvement in the economy, resulting in increasing taxation of top incomes, financial sector regulation, the nationalisation of major industries, the strengthening of trade unions and labour rights, and the creation of social welfare states (Goda and Torres García, 2016).
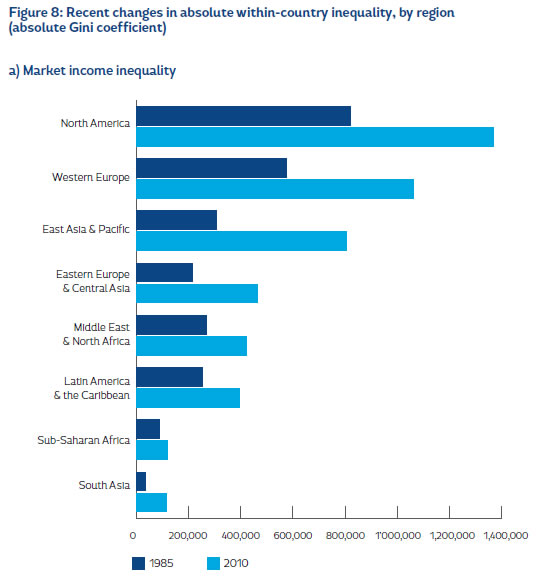
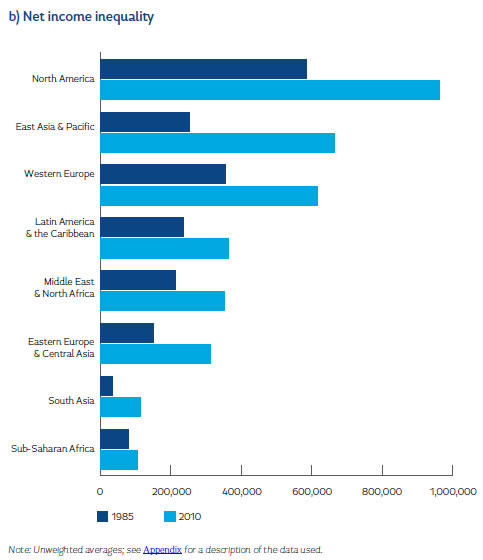
In contrast to relative within-country inequality, the level of absolute market and net income inequality increased in all regions between 1985 and 2010 (Figure 8).14 The relatively modest increase in Sub-Saharan Africa was mainly due to the low real absolute income growth within this region (on average, +341/capita in 1990 $PPP); whereas the relatively strong mean income growth of LAC (+3,180/capita) and the Middle East and North Africa (+3,440/capita) more than offset the relative inequality decrease within these regions (see Figure 6). The stark increase of absolute inequality in the other regions was due to the strong increase in real mean incomes and a large increase in relative inequality levels.
Unsurprisingly, this comparison also shows that those regions that include the most developed countries (North America, Europe, and East Asia and Pacific) are much more unequal in absolute terms than regions that primarily include developing countries. Finally, it is important to note that the differences between the regions are lower in net terms than in market income terms, suggesting that in absolute terms the developed countries in general, and the Western European countries in particular, are more redistributive than developing countries.
5 Historical trends in global income inequality
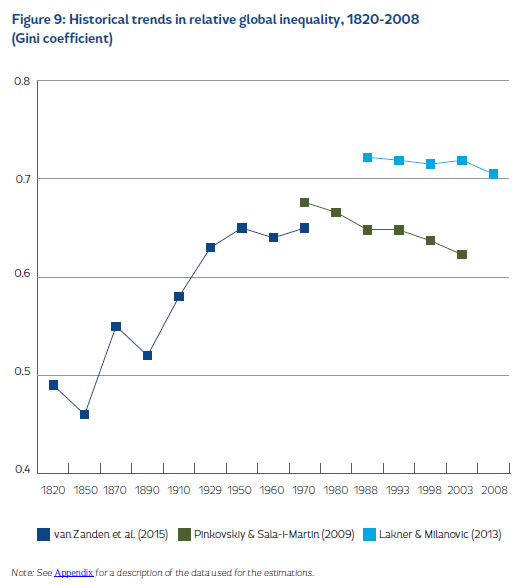
''It is not possible to reach a definite conclusion regarding the direction of the change in [relative] global inequality over the last three decades of the twentieth century'' (Anand and Segal, 2008, pg. 90), given the wide array of data sources and methodologies used to estimate the measures.15 And although recent estimates from two distinguished inequality researchers, Sala-i-Martin and Milanovic, suggest that it is likely that relative global inequality declined during the last two decades (Figure 9), ''these changes are probably not robust to plausible standard errors (if one could formulate and calculate them)'' (Lakner and Milanovic, 2013, pg.48). Having said that, there exists a broad consensus that relative global income inequality increased sharply between 1820 and 1950 (Bourguignon and Morrisson, 2002; van Zanden et al., 2014), and that today's relative global inequality levels are much higher than they were in 1820. Moreover, they are also much higher than today's inequality levels within countries (with the notable exception of Angola, Namibia, and South Africa) and between countries.
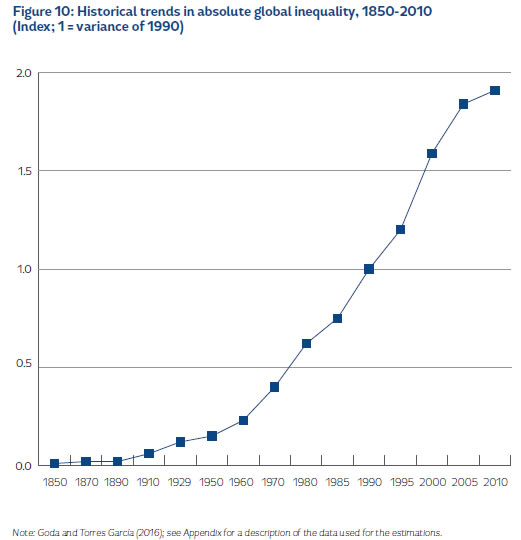
With regard to absolute global inequality, the three papers with these estimates unanimously report a sharp increase in inequality. Atkinson and Brandolini (2010) find that the absolute Gini coefficient increased strongly throughout the period 1820-1992 (with an especially sharp increase after 1950), while Anand and Segal (2015) report that this strong growth continued between 1992 and 2005. The most recent data presented by Goda and Torres García (2016) confirm these findings (Figure 10). More precisely, their estimates show a continuous increase in absolute global inequality during 1850-2010 that accelerated after 1950: ''in the first one hundred years of our sample, the average annual growth rate of absolute global inequality was 3.0%, whereas it was 4.3% between 1950 and 2010'' (pg. 8).
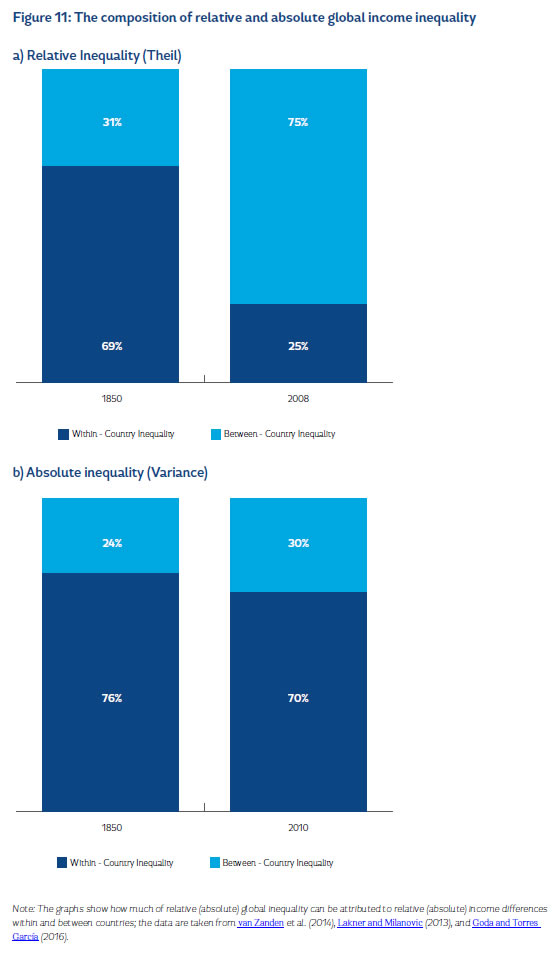
Finally, it is important to note that not only the trend changes of relative and global inequality differ considerably but also their composition. As explained in Section 2, global inequality can be decomposed into a within-country inequality component and a between-country inequality component (adjusted by the population size of the countries). Depending on which of these two components is more important, global inequality can be driven either by growing income differences within countries or by growing mean income differences between these countries. Figure 11 shows that in 1850 both relative and absolute global inequality were mainly explained by income inequality within countries (i.e. 69% and 76% of global inequality were due to differences between income groups within countries). In 2000, on the contrary, relative global inequality was mainly due to income differences between countries, whereas within-country inequality was still the main driver behind the growth in absolute global inequality.
6 Conclusions
The estimates presented in this paper demonstrate that today's global income inequality levels are much higher than they were in 1820, irrespective if measured in absolute or in relative terms. However, the historical trends of within-country and global inequality differ considerably, depending on the preferred measure. Absolute within-country inequality increased continuously on a global scale (with the exception of the period 1929-1950), with an especially large increase after 1950. The relative measures, on the contrary, report no clear trend prior to 1950, a strong decrease between 1950 and 1970, and a sharp increase from 1975 onwards. With regard to global inequality, the main discrepancy between the measures can be found after 1970. While relative inequality most probably decreased, absolute inequality grew much faster than in the pre-1970 period. Finally, it is important to note that regional differences are much more pronounced in absolute than in relative terms.
These findings show that one should abstain from general statements about inequality trends without clarifying whether the trends refer to relative or absolute inequality, and they also explain why there are conflicting assessments about the distributional outcomes of globalization. Moreover, these findings indicate that it is essential to choose the right inequality measure for a specific question at hand. For example, the usage of relative inequality data might lead to misleading results when investigating the potential effects of inequality on property crime, given that the expected utility of this illegal activity depends on the degree of absolute inequality.
Finally, it is important to note that the results of our study also suggest that different policies would be appropriate to reduce either absolute or relative global inequality. Given that today three-fourths of relative global inequality is explained by income differences between countries, migration would likely be the best option to reduce relative global inequality. On the contrary, redistributional policies within countries (instead of migration) would be the most efficient policy option to reduce absolute inequality levels, since currently within-country inequality explains more than two-thirds of absolute global inequality.
1 All of the four mentioned relative and absolute measures fulfil the property of normalization and symmetry and the transfer and population principle. To be more precise all of these measures are non-negative and have a value of zero if all incomes are equal, they are sensitive to the reordering of all incomes, a transfer from a poor to a rich increases inequality, and the level of inequality does not depend on population size (Chakravarty, 2001). Therefore, from a technical point of view, there is no reason to favour the Gini and Theil Index over the Absolute Gini Index and the variance.
2 The period 1820-2010 is dictated by data availability: (i) Maddison's database, which is typically used to calculate historical changes in between-country and global inequality, only provides GDP data up to 2010 at the time of writing; and (ii) within-country inequality estimates for a representative group of countries are only available from 1820 onwards.
3 The initial Gini coefficient between the countries in Figure 1 is 0.39 (light grey bars). After the income neutral change in relative terms (black bars) it is still 0.39, whereas it decreases to 0.27 after the income neutral change in absolute terms (dark grey bars).
4 The absolute Gini coefficient can also be calculated by multiplying the (relative) Gini coefficient by the mean income (Chakravarty, 2001).
5 As mentioned above, the Gini Index does not allow a precise decomposition of the global inequality into its withinand betweencountry component; notwithstanding, it allows the inclusion of population weights and the estimation of total global inequality: Global Gini coefficient = ![]() , where Gi is the Gini coefficient of the i-th country, pi is the population share of the i-th country, πi is the i-th country's share in world income, μ is the mean income of the world, yi is the mean income of the i-th country, yj is the mean income of the j-th country, pj is the population share of the j-th country, and L is a residual.
, where Gi is the Gini coefficient of the i-th country, pi is the population share of the i-th country, πi is the i-th country's share in world income, μ is the mean income of the world, yi is the mean income of the i-th country, yj is the mean income of the j-th country, pj is the population share of the j-th country, and L is a residual.
6 ''In the US in 2006, for instance, tax data excluding capital gains imply a top percentile share of 18.0% while survey data imply a share of 13.7%. Using data for 2006, the US Gini based on household survey data (the Current Population Survey) is 0.470, while correcting the top percentile's income using the tax data raises it by nearly 0.05 to 0.519. Moreover, the increase in the U.S. Gini from 1976 to 2006 using survey data alone (corrected for a change in definition) was 0.053, which more than doubles to an increase of 0.108 using the top income data (including capital gains)'' (Anand and Segal, 2015, pg. 948).
7 Estimates for hidden offshore wealth range from US$ 7.6 trillion (Zucman, 2015) to US$ 21 trillion (Henry, 2012).
8 In 1820 Korea had a GDP per capita of $335, whereas England had a GDP per capita of $2,074 (in 1990 $PPP). In 2000, the respective figures were $214 for Congo and $28,702 for the USA (Maddison Project, 2016).
9 Please note that the 2005 PPP estimates have been heavily criticized (e.g., Deaton, 2010; Breton and García, 2015) and that it seems that the newest PPP estimates (from the 2011 round) are similar to the pre-2005 estimates (Deaton and Aten, 2015). However, 2011 PPP data are only available from 1990 onwards. In any case, PPP revisions have little effect on the overall trend of between-country inequality on the grounds that national inflation and GDP growth rates are used to obtain the GDP per capita of previous years (Milanovic, 2012).
10 Between 2000 and 2011, the average annual growth rate of developing countries was 3.3% in Latin America and the Caribbean, 4.7% in Sub-Saharan Africa, and 4.1% in the Middle East and North Africa (WDI, 2016).
11 The variance has been calculated as shown in (4), where γi is the GDP per capita of the i-th country and μ is the average GDP per capita of all sample countries.
12 Please note that this regional comparison is hampered by the underrepresentation of Middle Eastern and African countries. Moreover, it is important to note that the SWIID data we use have been heavily criticised recently (Jenkins, 2015). However, most of the critique points that have been brought forward do not apply to the latest version of the dataset used in this paper (SWIID V5.0), and currently there is no better dataset available that provides a homogenized dataset including developed and developing countries net and market income Gini coefficients (Solt, 2015).
13 Kuznets argues that the increase happens due to the movement of labour from rural agricultural to urban industrial areas, whereas the decline starts when the majority of people work in modern sectors.
14 Absolute inequality was calculated by multiplying each countries Gini coefficient with its GDP per capita.
15 Studies have to choose between (different) PPP exchange rates and market exchange rates, household or national account means, expenditure or (gross or net) income, and grouped or individual-level data. Moreover, many studies estimate within-country distributions and and extrapolate some data — see Anand and Segal (2008), Goda (2013), and Lakner and Milanovic (2013) for an in-depth discussion.
References
Amiel, Y. and Cowell, F.A. (1999). Thinking about inequality: Personal judgment and income distributions. Cambridge: Cambridge University Press. [ Links ]
Anand, S. and Segal, P. (2008). What Do We Know about Global Income Inequality?. Journal of Economic Literature, 46(1): 57-94. [ Links ]
Anand, S. and Segal, P. (2015). The Global Distribution of Income. In Atkinson, A.B. and Bourguignon, F. (eds.): Handbook of Income Distribution. Oxford: North-Holland, Ch.11. [ Links ]
Agnew, R. (1985). A revised strain theory of delinquency. Social Forces, 64(1): 151-167. [ Links ]
Agnew, R. (1992). Foundation for a generalism strain theory of crime and delinquency. Criminology, 30(1): 47-87. [ Links ]
Atkinson, A.B. (1997). Bringing income distribution in from the cold. The Economic Journal, 107(441): 297-321. [ Links ]
Atkinson, A.B. and Brandolini, A. (2001). Promise and Pitfalls in the Use of 'Secondary' Data-Sets: Income Inequality in OECD Countries. Journal of Economic Literature, 39(3): 771-799. [ Links ]
Atkinson, A.B. and Brandolini, A. (2010). On Analyzing the World Distribution of Income. World Bank Economic Review, 24(1): 1-37. [ Links ]
Atkinson, A.B., Piketty, T. and Saez, E. (2011). Top Incomes in the Long Run of History. Journal of Economic Literature, 49(1): 3–71. [ Links ]
Ballano, C. and Ruiz-Castillo, J. (1993). Searching by questionnaire for the meaning of income inequality. Revista Español de Economía, 10(2): 233-259. [ Links ]
Bourguignon, F. and Morrisson, C. (2002). Inequality among World Citizens: 1820-1992. American Economic Review, 92(4): 727-744. [ Links ]
Breton, T. and García, J.J. (2015). ICP 2005 Construction Prices: Are They Underestimated in Developing Countries?. Review of Income and Wealth, DOI: 10.1111/roiw.12170. [ Links ]
Chakravarty, S.R. (2001). The variance as a subgroup decomposable measure of inequality. Social Indicators Research, 53(1): 79-95. [ Links ]
Chakravarty, S.R. and Tyagarupananda, S. (2009). The subgroup decomposable intermediate indices of inequality. Spanish Economic Review, 11(2): 83-97. [ Links ]
Cornia, G.A. (2010). Income Distribution under Latin America's New Left Regimes. Journal of Human Development and Capabilities, 11(1): 85-114. [ Links ]
Cowell, F.A. (2000). Measuring Income Inequality. London: Harvester Wheatsheaf. [ Links ]
Deaton, A. (2010). Price indexes, inequality, and the measurement of world poverty. American Economic Review, 100(1): 5-34. [ Links ]
Deaton, A. and Aten, B. (2015). ''Trying to Understand the PPPs in ICP2011: Why are the Results so Different?'', NBER Working Paper, No. 20244 (update March 2015). [ Links ]
Ehrlich, I. (1973). Participation in illegitimate activities: a theoretical and empirical investigation. Journal of Po litical Economy, 81(3): 521-65. [ Links ]
Ellis, L. and Kathryn S. (2010). The global upward trend in the profit share. Applied Economics Quarterly, 56(3): 231-255. [ Links ]
Fleisher, B.M. (1966). The effect of income on delinquency. American Economic Review, 56(1/2): 118-37. [ Links ]
Francois, J.F. and Rojas-Romagosa, H. (2007). 'The Construction and Interpretation of Combined Cross-Section and Time-Series Inequality Datasets'. IIDE Discussion Paper No. 200708-05. [ Links ]
Froud, J., Johal, S., Haslam, C. and Williams, K. (2001). Accumulation under conditions of inequality. Review of International Political Economy, 8(1):66-95. [ Links ]
Gasparini, L., Cruces, G. and Tornarolli, L. (2011). Recent Trends in Income Inequality in Latin America. Economía, 11(2):147-190. [ Links ]
Goda, T. (2013). 'Changes in income inequality from a global perspective: an overview'. PKSG Working Paper, No. 1303. [ Links ]
Goda, T. and Lysandrou, P. (2014). The contribution of wealth concentration to the subprime crisis: a quantitative estimation. Cambridge Journal of Economics, 38(2): 301-27. [ Links ]
Goda, T. and Torres García, A. (2016). The Rising Tide of Absolute Global Income Inequality During 1850–2010: Is It Driven by Inequality Within or Between Countries?. Social Indicators Research, first online, doi: 10.1007/s11205-015-1222-0. [ Links ]
Hagan, J., & Peterson, R.D. (1995). Criminal inequality in America: Patterns and consequences. In Hagan, J. and Peterson, R.D. (eds.): Crime and inequality. Stanford: Stanford University Press, pp. 14-36. [ Links ]
Halter, D., Oechslin, M. and Zweimüller, J. (2014). Inequality and growth: the neglected time dimension. Journal of Economic Growth, 19(1): 81-104. [ Links ]
Harrison, E. and Seidl, C. (1994). Perceptional inequality and preferential judgments: An empirical examination of distributional axioms. Public Choice, 79(1-2): 61-81. [ Links ]
Hein, E. (2012). The macroeconomics of finance-dominated capitalism and its crisis. Cheltenham:Edward Elgar. [ Links ]
Henry, J.S. (2012). 'The price of offshore revisited: New estimates for 'missing' global private wealth, income, inequality, and lost taxes'. Tax Justice Network Research Paper, 22nd July. [ Links ]
Herzer, D. and Vollmer, S. (2012). Inequality and growth: evidence from panel cointegration. Journal of Economic Inequality, 10(4): 489-503. [ Links ]
Herzer, D. and Vollmer, S. (2013). Rising top incomes do not raise the tide. Journal of Policy Modeling, 35(4): 504-19 ILO (2008). [ Links ] World of work report 2008: income inequalities in the age of financial globalization. Geneva: International Labour Organization. [ Links ]
Immervoll, H. and Richardson, L. (2011). Redistribution Policy and Inequality Reduction in OECD Countries: What Has Changed in Two Decades? OECD Social, Employment and Migration Working Paper No. 122. [ Links ]
Keister, L.A. (2014). The One Percent. Annual Review of Sociology, 40: 347-367. [ Links ]
Kumhof, M., Ranciére, R. and Winant, P. (2015). Inequality, Leverage, and Crises. American Economic Review, 105(3):1217-1245. [ Links ]
Kuznets, S. (1955). Economic growth and income inequality. American Economic Review, 45(1): 1-28. [ Links ]
Kuznets, S. (1965). Economic Growth and Structure: selected essays. London: Heinemann Educational Books. [ Links ]
Lakner, C. and Milanovic, B. (2013). Global Income Distribution: From the Fall of the Berlin Wall to the Great Recession. World Bank Policy Research Working Paper, No. 6719. [ Links ]
Lustig, N. and Gasparini, L. (2011). The Rise and Fall of Income Inequality in Latin America. In Ocampo, J.A. and Ros, J. (eds.): The Oxford Handbook of Latin American Economics. New York: Oxford University Press, pp. 691-714. [ Links ] Milanovic (2013). Global Income Inequality in Numbers: in History and Now. Global Policy, 4(2): 198-208. [ Links ]
Milanovic, B. (2005). Worlds Apart: Measuring International and Global Inequality. Princeton: Princeton Univer sity Press. [ Links ]
Milanovic, B. (2012). Global inequality recalculated and updated: the effect of new PPP estimates on global inequality and 2005 estimates. Journal of Economic Inequality, 10(1): 1-18. [ Links ]
OECD (2011). 'Growing Income Inequality in OECD Countries: What Drives it and How Can Policy Tackle it?'. OECD Forum on tackling inequality, Paris, 2 May. [ Links ]
Onaran, O. and Galanis, G. (2014). Income distribution and growth: a global model. Environment and Planning A, 46(10): 2489-2513. [ Links ]
Ostry, J.D., Berg, A., Tsangarides, C.G. (2014). Redistribution, Inequality, and Growth. IMF Staff Discussion Note, No. SDN/14/02. [ Links ]
Oxfam (2014). Even it Up. Time to end extreme inequality. Oxford: Oxfam. [ Links ]
Palan, R., Murphy, R. and Chavagneux, C. (2010). Tax Havens: How globalization really works. New York: Cornell University Press. [ Links ]
Piketty, T. (2014). Capital in the Twenty-First Century. Cambridge Mass: Belknap Press of Harvard University Press. [ Links ]
Pinkovskiy, M. and Sala-i-Martin, X. (2009). 'Parametric Estimations of the World Distribution of Income'. NBER Working Paper No. 15433. [ Links ]
Rajan, R.G. (2010). Fault Lines. How Hidden Fractures Still Threaten the World Economy. Princeton:Princeton University Press. [ Links ]
Ravallion, M. (2004). Competing Concepts of Inequality in the Globalization Debate. In Collins, S.M. and Graham, C. (eds.): Brookings Trade Forum 2004. Globalization, Poverty, and Inequality. Washington: Brookings Institution Press, pp. 1-38. [ Links ]
Sala-i-Martin, X. (2006). The world distribution of income: falling poverty and ... convergence, period. Quaterly Journal of Economics, 71(2): 351-397. [ Links ]
Seers, D. (1972). What are we trying to measure?. Journal of Development Studies, 8(3): 21-36. [ Links ]
Solt, F. (2014). The standardized world income inequality database. Retrieved at 19 January 2016 from https://dataverse.harvard.edu/dataset.xhtml?persistentId=hdl:1902.1/11992. [ Links ]
Stiglitz, J.E. (2012). The Price of Inequality. London: Penguin Books [ Links ]
Stockhammer, E. (2015). Rising Inequality as a cause of the present crisis. Cambridge Journal of Economics, 39(3): 935-958. [ Links ]
van Treeck, T. (2014). Did inequality cause the U.S. financial crisis?. Journal of Economic Surveys, 28(3):421-48. van [ Links ]
Zanden, J.L., Baten, J., Foldvari, P. and van Leeuwen, B. (2014). The Changing Shape of Global Inequality 1820-2000: Exploring a new dataset. Review of Income and Wealth, 60(2): 279-297. [ Links ]
Zucman, G. (2015). The hidden wealth of nations: The scourge of tax havens. Chicago: University of Chicago Press. [ Links ]