


Servicios Personalizados
Revista
Articulo
 Inglés (pdf)
 Articulo en XML
 Referencias del artículo
 Enviar articulo por email
Indicadores
-
 Citado por SciELO
 -
 Accesos
Links relacionados
 Citado por Google
 -
 Similares en
SciELO
Similares en
SciELO  Similares en Google
Compartir

 Permalink
Universitas Psychologica
versión impresa ISSN 1657-9267
Univ. Psychol. v.4 n.3 Bogotá dic. 2005
Time, speed and space perception in three modes of transport
Carlos F. Pardo*, Raúl Oyuela-Vargas, Juliana García, Natalia Ochoa**
Recibido: junio 3 de 2005 Revisado: julio 13 de 2005 Aceptado: agosto 8 de 2005
* Proyecto de transporte urbano sostenible para América Latina y el Caribe – SUTP LAC. Correspondencia relacionada con este artículo por favor enviarla a carlos.pardo@sutp.org/carlosfpardo@gmail.com
** Laboratorio de Psicología, Pontificia Universidad Javeriana
ABSTRACT
The project intended to see if people would perceive various aspects of a trip depending on the mode of transport used, being TransMilenio (Bogotá BRT) or bus. Though speed in TransMilenio was actually higher, passengers of the latter perceived it as faster and less safe. Distance was perceived as higher than real in TransMilenio and the contrary was found in regular bus passengers. Time was perceived as shorter in the case of TransMilenio passengers than in regular bus passengers. Further conclusions are drawn in the study regarding the usefulness of the data in passenger’s attitude toward services and perception of safety during public transport trips. As a theoretical issue, time and space perception are discussed relating them to speed perception.
Key words: Perception, time, speed, space, transport, transport psychology.
Tiempo, velocidad y percepción del espacio en tres formas de transporte
RESUMEN
El proyecto indagó sobre la percepción de varios aspectos de un viaje dependiendo del medio de transporte utilizado, siendo las opciones TransMilenio (Bus Rápido en Bogotá) o bus. Aunque la velocidad en TransMilenio era realmente más alta, los pasajeros del segundo grupo la percibieron más rápida y menos segura. La distancia recorrida fue percibida como mayor que la real en TransMilenio que en los que utilizaban transporte público informal. El tiempo fue percibido como más corto en el caso de los pasajeros de TransMilenio. Se extraen más conclusiones en el estudio de acuerdo con la utilidad de los datos de la actitud de los pasajeros hacia los servicios y la percepción de seguridad durante los viajes en transporte público. Como interés teórico, la percepción de tiempo y espacio son discutidas en relación con la percepción de velocidad.
Palabras clave: percepción, tiempo, velocidad, espacio, transporte, psicología del transporte.
This project addresses a key question to those interested in transportation psychology: how do people perceive three of reality’s dimensions (space, time and speed) in specific modes of transport? Seemingly a poetical question, it has various consequences in terms of perception research. Why would a ride on a regular bus bear different perceptual characteristics than a ride on a vehicle of Bus Rapid Transit (BRT)? If people were to perceive a ride on a vehicle as slow, would they be more comfortable perceiving a faster ride, or is there an opposite reaction? If these doubts were solved, it would be easier to influence policymakers in matters of road safety or just plain quality of life.
It is also of great relevance to question the “need for speed” as an innate characteristic of human beings. No rigorous psychological study has gone further into this topic, however interesting to all those studying space and time perception, such as the subcommittees from Transportation Research Board ADB10(1) and ADB10(4), which focus only on time use and perception of time and space, leaving speed as a not-so-interesting subject of research. In recent studies, Klein (2004) has posed similar questions to the ones addressed here, though in a different context (European and high-speed-train-related). Other research on speed includes Huber and Krist (2004), in which their intention is to directly analyze the perception of speed as such, with no contextual flavor.
There is also another need that would be worthwhile focusing on: the need to move a certain distance. How much distance do people need to move? Though there is little debate going on, there are some researchers (e.g. Mokhtarian 2003a, 2003b) who find it very relevant to emphasize on the apparent fact that people “need to drive” in order to get to a particular place, and they need to do so every day (the typical example used by Mokhtarian is the mother driving her children to school every day as an inavoidable activity for their psychological balance). The immediate question in this debate is if the distance should be necessarily covered in one mode or another, of if this really another dimension (e.g. speed or time-lapse) which is predominantly perceived as most important.
This research project intended to respond to the question about speed, while also referring to time and space in this task. Buses (informal public transport- IPT) and Bus Rapid Transit (BRT) were taken as the two modes of transport to compare, for reasons that will be outlined below. From the beginning of the research project, it was expected that there would be significant differences in the perception of time, distance, speed, comfort and safety depending on the mode of transport participants took. Results of the project were varied, and hold some initial suggestions to further deepen this subject in other modes of transport and situations, with a clear relevance to transportation policy.
It can be said that Psychology was born while researching perceptual processes. Two of these processes, as described by James (1890/1952), were perception of time and perception of space. In the first publication that tried to compile Psychology’s most relevant topics of study in the late nineteenth century, James gave these two physical characteristics two whole chapters. According to James, there are various types of perception such as space, time, speed and movement. Space perception is characterized by the fact that it is difficult (or nearly impossible) to distinguish definite divisions, directions, magnitudes or distances. This means that people are not subject to a static or “flickering” version of the universe.
Also, since human beings are in constant interaction with their environment, space is the utmost necessity of this experience (Dennett, 2003). In brief, our contact with reality implies that we perceive space, even if it may be completely different in other people. But the constant fact is that human beings (even blind people) have a perception of space that exists even before birth.
In the case of time, though at some times more than others, it has grown to become one of the most important aspects of reality as well. The evolution of these concepts in modernity is traced by Galison (2003). It is interesting to see that time has evolved as a concept that was once not so relevant to everyday life. Since monks of the XII century made it relevant to use clocks to time their prayers, the custom grew popular in common city life as well (McLuhan, 1971). From then on, time was a need of citizens, and this evolved into the need for punctuality, schedules and wristwatches in the working environment.
As for research studies focusing on transport and time, Metz (2004a, b) has given an account of how people need to move every day, but he has limited the amount of travel per day to one hour, since this constant is sometimes debated. He demonstrates that travel times and total yearly time of travel between people are constant (in one year, people travel around 360 hours).
Kang, Herr and Page (2003) take this somewhat further, analyzing the time perception of shoppers. They found that “for shopping trip decisions, consumers’ driving time knowledge (how long it takes to get there) is both more accessible from memory and more accurate than their corresponding driving distance knowledge.” (Kang, Herr & Page, 2003, p. 40). This is also very relevant to this discussion, as it questions the coherence in perception between perception of time and spatial characteristics or a journey which will be taken into account here.
A third component that has had comparably little research in psychology is the perception of speed, even though it is the quotient of both time and space (v = d/t). It is clear that speed was not of great concern in the beginning of psychology, since cars and other fast (and private) modes of transport had not been introduced en masse into society, so little attention was given to this dimension of human life. Speed has just become of scientists’ concern in recent years, in topics such as aeronautic transport and road safety, the latter which has become a critical topic for institutions such as the World Health Organization, which declared 2004 World Health Day with road safety as a central topic (WHO, 2004). The relationship to speed is described thus: “Speed has been identified as a key risk factor in road traffic injuries, influencing both the risk of a road crash as well as the severity of the injuries that result from crashes.” (WHO, 2004, facts annex). However, speed is not yet a mainstream topic for research in psychology, though its deepening would clearly promote a more socially sustainable transport.
Some psychological studies, such as those made by Horswill & Mckenna (1999), show that there are important aspects related to speed. For example, these researchers found that the perception of speed is influenced by noise, since this presence of noise increases the magnitude of the speed perceived. Thus, the topic could further be researched.
Speed has also been researched or documented by neurologists, such as Sacks (2004) and by philosophers (see Klein, 2004). Basically, speed is seen as a byproduct of modernity (or postmodernity) and it carries a strong link with the social characteristics of a city. For example, the argument that Parkins and Kraig give is that slowness should be a new value to promote in society (and transport), as has been done with the “slow food” movement in Europe.
This is related to the fact that various factors are constantly influencing the way in which city signs (streets, neighborhoods) are discriminated, and that citizens form an image of their cities that determines their preferences and behavior in these settings, as well as their future perception of them. There is a symbolic significance of an urban space that permits inhabitants to structure their city in their minds and move inside it.
An initial method to analyze people’s perception of an urban setting was developed by Kevin Lynch (1960). He analyzed the quality of three cities (Boston, Jersey City and Los Angeles) and developed a method to research their citizen’s perception that would become widely used afterwards (cognitive cartography). He simply asked participants to draw a map of their city, generating a static image of their urban setting, and showing the importance that they would give to each space inside it, their movement inside the city and their most important characteristics. This static image would need a dynamic method to complement it, while studying people’s perception while moving around the city.
The previous are some the examples that can be drawn to our attention when analyzing time, space and speed perception and how to do research on them from psychology. This research project looks forward to understand these factors further in a specific situation, namely, the use of a Bus Rapid Transit System (BRT) in Bogotá while comparing it to Informal Public Transport (IPT) in the same city.
The relevance of studying IPT and BRT in Bogotá is due to the conditions of both services. As has been described extensively by Wright (2003), Bogotá’s BRT is a mass transit system with dedicated lanes, high capacity buses, high platforms and stations, and a specific organizational structure in which a state enterprise controls the system’s routes and the buses’ frequencies, dividing the operation from the fare collection, among other key issues.
On the other hand, IPT has been extensively described by Pulido & Burbano (1997), as well as Montezuma (1996), where there is a highly informal structure, various buses run in fixed routes but there is little control over bus frequency and demand management. However, it is interesting to see that there is a very intricate cultural character in this service, constructed by its users and its operators. Thus, both services have reasons to influence distance, speed and time perceptions in their users. However, no studies have been made to understand these processes in Bogotá or Latin America. Hopefully, this study can motivate other researchers to deepen this knowledge.
Method
Design
The experimental design of this research project can be described as preexperimental (Hernández, Fernaández & Baptista, 2000), due to its minimal experimental control. It is based on the application of a treatment to a pair of groups and a measurement of variables looking forward to see what the participants’ responses meant in terms of the research question. It is a simple procedure which allows comparison between both groups, which have received the same treatment in each case, and may give different responses (in this case, reports of perception) to the events presented during the experimental situation.
Participants
The sample for this study was chosen randomly among passengers of informal public transport (IPT) and the BRT system TransMilenio (TM). There were 30 women and 30 men, 30 riding TM and 30 riding IPT (four groups in total). In the group of TM, 15 were taking an express service (stopping in few stations) and 15 took the regular service (stopping in all stations). In the IPT group, 15 used semantic differential as defined by Woodworth (1964) bus and 15 used buseta (smaller vehicle and less expensive and as shown in Table 1, and four basic questions that ride). The ages were between 17 and 50 years old. Socioeconomic strata between 2 and 4, and all except two rode on public transport between every day and every other day.
Instruments
Instruments for this project included a questionnaire and a stop watch. The questionnaire (Appendix A) included basic demographic information and two main sections: a semantic differential as defined by Woodworth (1964) and as shown in Table 1, and four basic questions that were read out loud to participants by researchers:
How much time in minutes do you think this ride lasted?;
How many blocks do you think we’ve moved?;
What was the top speed this vehicle reached (km/h)?
During the entire trip, which do you think was the average speed in km/h of this vehicle?
Table 1. Semantic differential format used during the experiment
| Very | More or less | Indifferent | More or less | Very | ||
| Long | 1 | 5 | Short | |||
| Slow | Fast | |||||
| uncomfortable | comfortable | |||||
| Unsafe | Safe | |||||
Questions in the semantic differential were given a score between 1 and 5 (very long, very slow, very uncomfortable and very unsafe were given a score of 1; whereas very short, very fast, very comfortable and very safe were given a score of 5). These four aspects of the ride were used to measure time-span, speed, comfort and safety of the trip.
On the other hand, the four open questions were used to measure the quantification participants gave of time-span, distance, top speed and average speed.
Procedure
The procedure was all developed inside vehicles, in the city of Bogotá. In the case of TM, researchers would start their ride in the northern terminal station (Portal del Norte) riding southbound, and in the case of IPT researchers chose a specific route (Av. 19) and rode from Calle 161 riding southbound. Once in the bus, they rode on them for 10 minutes (the specified time for the experiment) and asked a person riding the bus (sitting near a window towards the right) to answer to the questions and semantic differential. The questions were all read out loud and the semantic differential was read and shown to them and explained so they could point at the five scores to each question. Participants who were not able to respond to the questions or who did not understand the semantic differential were not taken into account for the data recollection. All data was analyzed through MS Excel and SPSS (Social Package for the Social Sciences) and is presented in the following chapter.
Results
The experiment results will be presented depending on the two components of the questionnaire, and with quantitative and correlational analysis. The first section will provide a thorough view of what the participants responded to the most relevant questions (variables) of the procedure, whereas the second section will analyze the relationships between these variables.
Descriptive analysis
The descriptive results for the quantification is presented in Table 2, and the last row shows the actual values of each answer (e.g. the real value for time was 10 minutes, and distance and average speed were average and calculated from data taken by researchers).
Based on this information, it is interesting to note various items. Regarding perceived time, the average for perceived time in the bus was higher in both cases. In the case of IPT, people perceived it as more than 3 times higher than reality, while TM users perceived it as twice as long. However, perceived distance was actually higher in both cases: TM users perceived they had ridden 2.3 km more than they actually traveled (39% higher), while IPT users perceived they had ridden 1.40 more km (35% higher) in average. Consequently, people perceived speeds higher in both cases, almost to the same extent than distance perceived, since TM users perceived an average speed of 51.33 km/h (while reality was 36), and IPT users perceived it as 38.70 km/h (while reality was 24 km/h). Nonetheless, maximum speeds gave no significant results.
As to the answers given to the semantic differentials, a summary of descriptive data is given in Table 3, including average, median, mode and variance of each variable answered.
According to Table 3, average scores for distance in TM were the same as IPT, 1.73, which would be somewhere between “very long” and “medium long”. Speed, on the other hand, was scored higher for TM than for IPT, the latter having a score close to “partially slow”, whereas TM users would score an average of 2.87, closer to indifference and towards “somewhat fast”. However, according to the median, half of the scores were 4.0 or higher (“somewhat fast” or “fast”) for TM, while half of the population of IPT scored 2.0 or lower (somewhat “slow” or “very slow”). Comfort and safety, which have little relevance to this study, were given scores in the same tendency, where TM users were close to indifference in terms of comfort and safety (average scores 2.93 and 2.73), but IPT users had lower scores, indicating some uncomfort and feeling of unsafety (average scores 2.33 and 2.37). In reality, comfort in TM is an issue, since there may be an average of 3 people per square meter inside the buses, which is not the case for IPT during the entire day (peak hours in IPT may have these uncomfortable situations, though there is no specific study which describes this).
According to Figure 1, it seems that participants perceived duration of trips as shorter for TM than IPT, as the distribution for IPT (bus or buseta) is towards “very long” or “medium long” in general. However, there was an overwhelming non-response from participants.

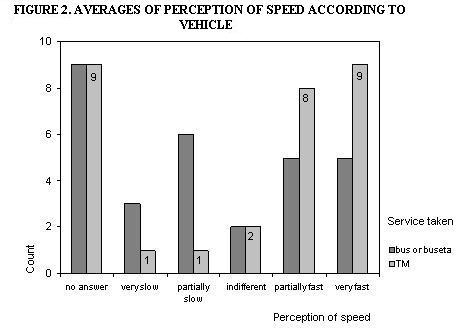
Though the “no answer” has a high frequency among participants, Figure 2 shows how participants perceived the ride as faster in the case of TM than for IPT. Participants who answered gave responses towards “very fast” and “partially fast”. Thus, perception seemed to correspond with actual values of speed, or at least in comparison.
Correlational analysis
The descriptive analysis presented above was complemented by a deeper analysis by means of correlations between variables (Pearson correlation). Table 4 shows the correlations between the aspects from the differential analysis. From these results, there are two relevant results (in bold): the correlation between distance in TM and safety in TM, and the one between IPT speed and safety. In the first case (TM distance vs. safety), it suggest that a significant amount of cases in which people perceive the distance to be long, they also perceive the trip to be unsafe (r= 0.6120). The inverse would also hold true. In the second case, a significant amount of cases of IPT users who feel that the speed of the vehicle is high also think that they are in an unsafe situation (r= 0.5316), while slow trips imply safety during the journey. Also, some minor correlations are interesting: for example, one of them implies that long distances are slightly correlated with TM speed (r= 0.4696) (see Table 4).
In Table 5, correlations are shown between the questions asked to quantify aspects of the trip in each mode. Only one of these correlations is of high significance: that of time and distance, meaning that quantifications to trips long in duration are correlated to trips that are long in distance, for users of TM (r= 0.732) and users of IPT (r= 0.436), as happens with inverse situations.
Discussion
The research results have given some preliminary suggestions to the topics addressed in this project. First of all, the fact that people who use TM have a different perception than those using IPT is of great relevance, since it demonstrates that the infrastructure (and organizational) implementations in transport may have consequences in perceptive processes, in this case space, time and speed perception.
In the quantifications, the fact that distance perception is higher than actual may respond to the fact that people are not adequately calculating a distance in blocks, however familiar this may sound. Nonetheless, it is interesting to note that distances are perceived as longer in TM (BRT) than in IPT. As marketing arrangements for the BRT project in Bogotá were developed, it may be that participants were influenced by the suggestion that TransMilenio would take them farther in less time.
Concerning average speed calculated, it is clear that participants are not used to calculating these measurements, and their higher-than-actual calculation confirms this suggestion. However, speed and distance are higher to a somewhat equal extent in both cases, which suggests that participants were accurately relating speed to distance. These findings are coherent with the fact that speed in the semantic differential was also perceived as relatively high in most cases. However, this is of interest to basic processes of Psychology, but has no direct link to transportation policy.
There are also other important findings for policy in transport, specifically the correlation between distance and safety, and in IPT the correlation between speed and unsafety. The fact that participants seem to perceive that a higher distance implies less safety is awkward, but may suggest that public transport modes are seen as an unsafe mode of transport. On the other hand, IPT participants saw speed as related to unsafety, but this was not the case for BRT (TM) (which was actually moving at a higher speed). The general notion that IPT is “reckless”, and that BRT is “speedy but seamless” may be what underlies these perceptions. Policy implications for this are very relevant. According to TransMilenio SA, accident rate in trunk lines has been reduced in 65% since the system was implemented in 2000 (Wright, 2003). This should mean that, in the case of public transport, speed does not have a necessary relation to unsafety, and people agree on this when perceiving TransMilenio as a safer vehicle regardless of their speed perception. If this is the case, speed management in policy for public transport should take into account that bus regulation is also a key factor when influencing road safety. Also, citizens should be aware of these facts so they perceive a system as safer regardless of the speed it travels with.
But this also takes the question further: is it necessary to have faster trips? To what extent is this necessary? The fact that a transportation system is faster may not necessarily mean that it is better, or it should mean so up to certain point. Thus, the fact that society is constantly speeding up is not the best indicator of life quality, and transportation policy should know this when designing a transport system for a city. This question has yet to be answered in future research.
On the other hand, correlations between time and distance perceptions are reinforcing the suggestion that people do have a notion of the relationship between these two factors. This is somewhat strange, since people are actually relating correctly both time and speed, but not time and distance. This may be due to various factors: erroneous perception of distance due to lack of experience in measuring it in any circumstance (e.g. an engineering student may have a more accurate perception of distance, which is not the case for a plumber), lack of experience in relating both time and distance or lack of interest towards this relationship. What this suggests is that time and speed are two basic factors in citizen life, but that distance in traveling is not of utmost importance to citizens. That is, people would give more importance to maintaining their travel speed and time than the distance they must carry. If examined correctly, this reflects a great importance to mode shift and land-use studies, since one of the key features of a sustainable city is that it has an adequate density (e.g. people per unit of space) (Newman and Kenworthy, 2000). If this is so, and we take into account Metz’s statement that citizen trips must be constant in one hour per day, then both of these issues could be solved if people used modes of transport which could promote a 30-minute ride twice a day. Moving from house to work or study place, this would be achieved in a walk of around 2 kilometers, or a bicycle ride of around 8.5 kilometers. On the other hand, in a car this is only achieved in a trip of around 20 km (if there is a constant speed of 40 km/ h), which would imply a greater sprawl (or lower city density). Thus, human beings’ “psychological need” of movement can be solved in a sustainable manner by promoting a society in which trips are done by bicycle, and the distances between home and work are shorter.
Also, this would have to be analyzed from the point of view of society’s apparent needs and probable evolution in terms of their needs for speed. If people are constantly seeking more speed (as suggested by Klein, 2004), this is in part promoted by the available modes of transport. If a policymaker were to take this into account while developing a new transportation model for his city, he would have to develop ways in which people are achieving an appropriate amount of trips and of appropriate distance, while looking forward to promote a slower society.
These initial findings justify the fact that psychology is introduced in policy dialogue for transportation measures and implementations. If these studies were integrated into decision-making, more information would be available in order to opt for the best choice when having various for a given city. Transportation policy decisions must not be based only in engineering detail or cost-benefit analysis, they should also include information from other sources such as urbanism and social sciences, with a special interest from psychology. For example, a discussion about transport must also include questions regarding the consequences of a speeding society and its correlates.
On the other hand, the two modes of transport described here should be further compared in order to find similarities, pros and cons to them. If BRT is dubbed to be the best transportation mode for a developing country, this is based on the facts that have been described earlier, that can be summarized in its greater formality, efficiency, environmental-friendliness, speed and cost-effectiveness. However, cultural characteristics of one mode of transport or another are seldom taken into account, as has been done by Pulido & Carvajal (2002) and the psychosociology of transport research group in Bogotá. For instance, the cultural identity constructed by drivers in their “cockpits” is never seen as a relevant object of study in transportation research, nor are paintings in buses (which are actually paid for by the drivers) or other cultural expressions which make part of transport as a city activity. However, it is also important to state that the high levels of inefficiency and environmental damage of IPT has to be taken as one of the key factors which influences the change of this system to another such as BRT.
From a strictly academic point of view, studies like this should be integrated to current discussions regarding other projects involving basic processes of space, time or speed perception, since they complement them with situations nearer to what actually happens in everyday life. They could also influence transportation policy and give a greater importance to psychological studies in transportation decision making, as well as an understanding of contemporary society and its characteristics in terms of speed and relationship to time.
References
Bauman, Z. (2000). Time and space reunited. Time & Society, 9(2-3), 171-185. [ Links ] Dennett, D. (2003). Consciousness explained. New York: Penguin. [ Links ] Galison, P. (2003). Einstein’s clock’s, Poincaré’s maps. New York: WW Norton. [ Links ]
Hernández, R., Fernández, C. & Baptista, P. (2000). Metodología de la investigación. Bogotá: McGraw-Hill. [ Links ]
Horwsill, M. S. & McKenna, F. P. (1999). The Development, validation and application of a video-based technique for measuring an everyday risk-taking behavior: drivers’ speed choice. Journal of Applied psychology, 84(6), 977-985. [ Links ]
Huber, S. & Krist, H. (2004). When is the ball going to hit the ground? Duration estimates, eye movements, and mental imagery of object motion. Experimental Psychology, Human Perception and Performance, 30(2), 431-444. [ Links ]
James, W. (1890/1952) Principles of psychology. Chicago: Encyclopaedia Britannica. [ Links ]
Kang, Y., Herr, P. M. & Page, C. M. (2003). Time and distance: Asymmetries in consumer trip knowledge and judgments. Journal of Consumer Research, 30(3), 420-431. [ Links ]
Klein, O. (2004). Social perception of time, distance and high-speed transportation. Time & Society, 13(2-3), 245-263. [ Links ]
Lynch, K. (1960). The Image of the City. Cambridge: MIT Press. [ Links ]
Maxim, P. (2002). Métodos cuantitativos aplicados a las ciencias sociales. México: Oxford. [ Links ]
McLuhan, M. (1971). Understanding media: the extensions of man. New York: Signet. [ Links ]
Metz, J. (2004a). Travel time – variable or constant? Journal of Transport Economics and Policy, 38(3), 333-344. [ Links ]
Metz, J. (2004b). Human mobility and transport policy. Ingenia [Royal Academy of Engineering], 18, 37-42. [ Links ]
Mokhtarian, P. (2003a). Driving by Choice or Necessity? The Case of the Soccer Mom and other Stories. 2003 Annual Meeting of the Transportation Research Board, January 15, 2003. [ Links ]
Mokhtarian, P. (2003b) Travel for the joy of it. En Institute for Transportation Studies Review, 26(1), 2-5. [ Links ]
Montezuma, R. (1996). Prólogo en R. Montezuma. (Ed.), El transporte urbano:Un desafío para el próximo milenio. Bogotá: CEJA. [ Links ]
Newman, P. & KenWorthy, J. (2000). Sustainable urban form: The big picture. In K. Williams, E. Burton & M. Jenks. (Eds.), Achieving sustainable urban form. New York: E & FN SPON. [ Links ]
Parkins, W. (2004). Out of time: fast subjects and slow living. Time & Society, 13(2-3), 363-382. [ Links ]
Pulido, H. C. & Burbano, J. (1997). Aproximación a la cultura del transporte urbano en Santafé de Bogotá. Bogotá: Pontificia Universidad Javeriana. [ Links ]
Pulido, H. C. & Carvajal, L. M. (2002). Identidad de conductores en debates de psicología No. 6: Organización, cultura y trabajo, Facultad de Psicología, Pontificia Universidad Javeriana. [ Links ]
Recarte, M. A. & Nunes, L. M. (1996). Perception of speed in an automobile: Estimation and production. Journal of Experimental Psychology: Applied. 1996, 2(4): 291-304. [ Links ]
Sacks, O. (2004). SPEED: a neurologist’s notebook. The New Yorker, 80(23), 60-70. [ Links ]
Woodworth, R. S. (1964). Psicología experimental. Tomo II. Buenos Aires: Eudeba. [ Links ]World Health Organization (2004). World report on road traffic injury prevention. Geneva: Author. [ Links ] Wright, L. (2003). Sustainable transport: A sourcebook for policy makers in developing cities. Module 3b: Bus Rapid Transit. Eschborn: GTZ. [ Links ]Appendixes
Appendix A. Format used for data logging
1. Servicio: (1) bus, (2) buseta, (3) expreso, (4)
2. Hora de inicio:
3. Sentido: (1) N-S, (2) S-N
4. Punto de inicio (Calle):
5. Punto de finalización (Calle):
Buenos días, usted ha realizado un recorrido en Bogotá, de un lugar a otro en __________.
De acuerdo con este recorrido, responda la siguiente nformación, marcando con una x en el espacio que mejor describa su experiencia del recorrido (puede pedir ayuda a la investigadora para responder):
El trayecto fue (marque con una x):
| Muy | Más o menos | Indif. | Más o menos | Muy | |||
| 6 | Largo | 1 | 5 | Corto | |||
| 7 | Lento | Rápido | |||||
| 8 | incómodo | Cómodo | |||||
| 9 | Inseguro | Seguro |
Ahora responda las siguientes preguntas:
10. ¿Cuánto tiempo en minutos cree que duró este recorrido?_______
11. ¿Cuánta distancia en cuadras cree que recorrió?____ corriente (TM)
12. ¿Cuál fue la máxima velocidad alcanzada por el vehículo (km/h)?_____
13. ¿Durante todo el viaje, a qué velocidad en kilómetros por hora cree que iba? _____
Responda la siguiente información de manera voluntaria:
14. Edad:_____
15. Sexo: M___ F___ (M = 1, F = 2)
16. De qué estrato son la mayoría de sus servicios:
1__ 2__3__4__5__6__
17. Su recorrido inició en (calle o estación):
___________________________________
18. Su recorrido terminará en (calle):
______________________________________
19. ¿Con cuánta frecuencia se transporta? (una sola opción)
A diario 1
Tres veces a la semana 2
Una vez a la semana 3
Quincenalmente 4
Cada mes o más 5
Nunca 6

