Servicios Personalizados
Revista
Articulo
 Inglés (pdf)
 Articulo en XML
 Referencias del artículo
 Enviar articulo por email
Indicadores
-
 Citado por SciELO
 -
 Accesos
Links relacionados
-
 Citado por Google
 -
 Similares en
SciELO
Similares en
SciELO -
 Similares en Google
Compartir

 Permalink
Universitas Psychologica
versión impresa ISSN 1657-9267
Univ. Psychol. v.10 n.2 Bogotá mayo/ago. 2011
Cliff's Delta Calculator: A non-parametric effect size program for two groups of observations*
Cliff's Delta Calculator: un programa para calcular el tamaño del efecto no paramétrico al comparar dos grupos de observaciones
GUILLERMO MACBETH**
EUGENIA RAZUMIEJCZYK
RUBÉN DANIEL LEDESMA
*Artículo de investigación-innovación.
**Consejo Nacional de Investigaciones Científicas y Técnicas (CONICET), Instituto de Investigaciones Psicológicas. Marcelo T de Alvear 1314, Buenos Aires (C1058AAV), Universidad del Salvador, University of Mar del Plata, Argentina. Tel: +54 11 4813 3400. Dirección web: http://www.iipus.com. Correos electrónicos: guimabeth@hotmail.com; eugeniaraz@fibertel.com.ar; rledesma@mdp.edu.ar
Recibido: noviembre 24 de 2009 Revisado: abril 15 de 2010 Aceptado: junio 25 de 2010
Para citar este artículo
Macbeth, G., Razumiejczyk, E. & Ledesma, R. D. (2011). Cliff's Delta Calculator: A non-parametric effect size program for two groups of observations. Universitas Psychologica, 10 (2), 545-555.
Abstract
The Cliff's Delta statistic is a non-parametric effect size measure that quantifies the amount of difference between two groups of observations beyond p-values interpretation. This measure can be understood as a useful complementary analysis for the corresponding hypothesis testing. During the last two decades the use of effect size measures has been strongly encouraged by methodologists and leading institutions of behavioral sciences. The aim of this contribution is to introduce the Cliff's Delta Calculator software that performs such analysis and offers some interpretation tips. Differences and similarities with the parametric case are analysed and illustrated. The implementation of this free program is fully described and compared with other calculators. Alternative algorithmic approaches are mathematically analysed and a basic linear algebra proof of its equivalence is formally presented. Two worked examples in cognitive psychology are commented. A visual interpretation of Cliff's Delta is suggested. Availability, installation and applications of the program are presented and discussed.
Key words authors: Statistical Software, Non-parametric Statistics, Effect Size, Cliff's Delta, Psychological Applications.
Key words plus: Behavioural Sciences, Psychological Research, Data Analysis.
Resumen
El estadístico Delta de Cliff permite cuantificar la magnitud de la diferencia entre dos grupos de observaciones que resultan incompatibles con el presupuesto de normalidad. El análisis de esta cuantificación complementa la interpretación del p-valor asociado a la correspondiente prueba de hipótesis. La aplicación de medidas del tamaño del efecto ha sido promovida, durante las últimas décadas, tanto por metodólogos, como por instituciones líderes en las ciencias del comportamiento. El propósito de la presente contribución es presentar un programa denominado Cliff's Delta Calculator con capacidad para calcular y graficar el valor del tamaño del efecto no paramétrico para dos grupos de observaciones. Se ofrece una comparación de este programa con otras calculadoras comerciales y no comerciales actualmente disponibles. Se describe su funcionamiento, sus fundamentos matemáticos y se presentan y discuten dos ejemplos de aplicación en la investigación psicológica. Se concluye que este programa presenta algunas ventajas, en comparación con otras calculadoras comerciales disponibles.
Palabras clave autores: Programa estadístico, estadística no paramétrica, tamaño del efecto, Delta de Cliff, aplicaciones psicológicas.
Palabras clave descriptores: Ciencias del comportamiento, investigación psicológica, análisis de datos.
Effect size measures and statistical significance in behavioral research
Hypothesis testing in behavioral research has traditionally focused on the statistical significance of the null hypothesis rejection (Gigerenzer, Swijtink, Porter, Daston, Beatty & Krüger, 1989). Researchers rely heavily on p-values to decide about the importance of the evidence obtained in experimental and non-experimental designs (Cortina & Dunlap, 1997). A p-value equal to or lower than 0.05 gives the authorization to report a difference as significant but greater p -values do not suffice to contribute findings to the state-of-the-art (Cohen, 1994; Krueger, 2001) in this traditional misconception that neglects sample size and other critical issues (Gillett, 2001; Strube, 2006).
During the last two or three decades many methodologists and institutions have warned about some problems related to these conceptions concerning the meaning of the evidence in the behavioral sciences (Hunter & Schmidt, 2004; Thompson, 1994; Valera-Espín & Sánchez-Meca, 1997; Wilkinson & Task Force on Statistical Inference, 1999). Although reporting type I and type II errors include an implicit warning about the complexity of the data analysis, the daily work of most researchers often neglects the relevance of other important features besides p-values. Sample size, homogeneity of variances, data normality, and effect size estimation, among many others, are important issues that critically impact on the quality of the evidence (Bakeman, 2005; Grissom & Kim, 2005; Strube, 2006).
In this context, effect size measures (ESMs) provide a valuable tool for data analysis (Frías -Navarro, Llobell & García-Pérez, 2000; Gigerenzer, 1993). The main contribution of ESMs to the correct interpretation of hypothesis testing has been earlier noticed by Fisher (1925), who argued that p-values do not really inform about the magnitude of a difference between two groups of observations. For example, if treatments A and B produce a statistically significant difference on the dependent variable, the amount of such discrepancy remains unknown. It is correctly concluded that the difference is important, but the researcher can not claim how important it is. To obtain a sound quantification of this discrepancy, ESMs are the convenient method. In this context, a difference between two groups of observations can be considered not only significant versus non-significant but also small (Cohen's d ≈ 0.2), medium (Cohen's d ≈ 0.5) or large (Cohen's d ≈ 0.8) after Cohen's proposed convention for some effect size estimates (Cohen, 1988; Grisson & Kim, 2005). This effect size can be understood as the magnitude of the impact that the manipulation of the independent variable causes on the dependent variable. Hence, ESMs are some sort of quantification of the treatment importance (Hunter & Schmidt, 2004).
Varieties of effect size measures
The quantification of a difference between two groups of observations depends on specific restrictions of the observed frequency distributions. For the case of two distributions compatible with normality and homoscedasticity assumptions, the most adequate ESMs are Cohen's d, Hedges' g and Glass' delta (Hess & Kromrey, 2004). These measures are specifically recommended for such cases because they depend on the mean and standard deviation (Ledesma, Macbeth & Cortada de Kohan, 2008, 2009). Their use is limited by the violation of normality and variance homogeneity assumptions (Grissom & Kim, 2005).
Other ESMs have been developed for asymmetric or non-normal distributions. These non-parametric ESMs for two groups of observations do not rely on the mean, they depend rather on a dominance concept (Cliff, 1993). This approach considers the ordinal instead of the interval properties of the data (Hess & Kromrey, 2004). The most direct and simple variety of ordinal ESM is known as Cliff's Delta, wich is a more powerful and robust measure than Cohen's d under certain conditions like skewed marginal distributions and for the analysis of Likert scales (Kromrey & Hogarty, 1998). The aim of this paper is to introduce a freely available software that computes this specific measure.
The Cliff's Delta estimator can be obtained with Equation 1.
(1)
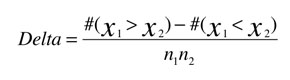
In this expression, x1 and x2 are scores within group 1 (e.g. treatment A) and group 2 (e.g. treatment B), and n1 and n2 are the sizes of the sample groups. The cardinality symbol # indicates counting. This statistic estimates the probability that a value selected from one of the groups is greater than a value selected from the other group, minus the reverse probability. Cliff (1993) interprets that this is a measure of dominance, a concept that refers to the degree of overlap between two distributions. All possible values of Cliff's Delta measures are in the closed interval [-1, +1]. An effect size of +1.0 or -1.0 indicates the absence of overlap between the two groups, whereas a 0.0 indicates that group distributions overlap completely. When a significant p-value is obtained, the associated ESM is expected to be near +1.0 or -1.0 because the difference between the groups is important. The extreme Delta = ± 1 occurs when the intersection between both groups is the empty set. When a non-significant p-value is found, the compared groups tend to overlap and the Cliff's Delta statistic approches near to 0.0.
The ordinal structure of Cliff's Delta makes it an appropiate ESM when the data distribution deviate from the normal model, or when the variables being compared correspond to an ordinal level of measurement. The non-parametric nature of Cliff's Delta reduces the influence of factors such as the groups' variance differences or the presence of outliers (Sun, 2008).
An algorithm for Cliff's Delta
The value of this estimator can also be obtained thro ugh matrix algebra tools. Since any collection of observations can be treated as a vector and the comparisons between vectors stated in Equ ation 1 are a function that generates a matrix, an algorithm for Cliff's Delta can be proposed.
Let Groupl and Group2 be vectors in ℜ, such that Group1 ∈ ℜm, ∀m ∈ N and Group2 ∈ ℜn, ∀m ∈ N. Note that these vectors can have different sizes, namely m and n. It is not an assumption in Equation 1 that both groups have the same number of observations, i.e. m ≠ n is an acceptable condition for this ESM. The dominance matrix proposed by Cliff (2003) expressed by δ ∈ ℜmXn can be obtained by the function δ : (ℜm, ℜn) → ℜmXn, as indicated in Equation 2.
(2)
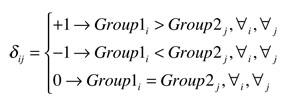
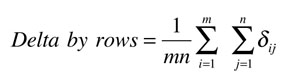
This application generates a matrix of m rows and n columns with only three possible values on each element δij., namely +1, -1, and 0. These values are assigned to the element δij, in the i-th row and j-th column according to the rule of Equation 2. If the i-th element in the vector labeled Group 1 is greater than the j-th element in the vector labeled Group2, the value of the element δij is +1. The opposite inequality generates a -1 and the congruency gives a 0. The Cliff's Delta value can be indistinctly obtained computing means for rows or means for columns as indicated in Equations 3 and 4, respectively.
(3)
(4)
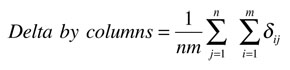
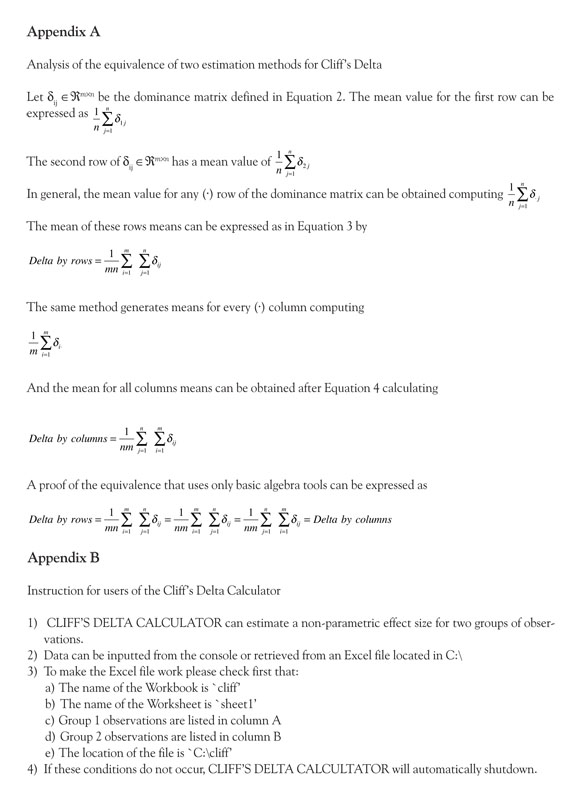
Although the equivalence of Equations 3 and 4 is intuitive, Appendix A presents an analysis of such identity to demonstrate the truth of their interchangeability. Both expressions compute mean values for each line of the dominance matrix, i.e. row or column, and a second mean for the lines means. The final value of this computing is Cliff's Delta as expressed in Equation 1 (Cliff, 1993).
Cliff's Delta Calculator
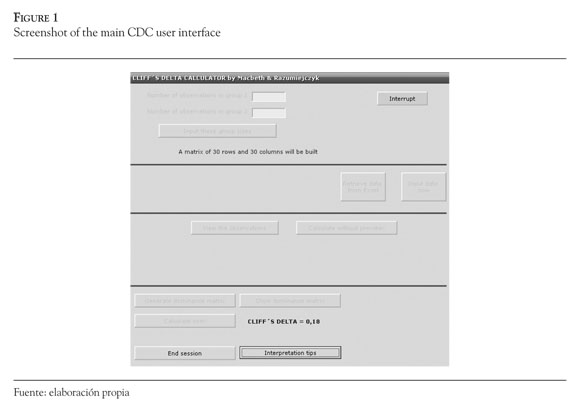
The algorithm described above has been applied for the development of an easy-to-use software. Cliff's Delta Calcultator (CDC) is a non-commercial program wrote in Visual Basic 6.0 that runs under Windows operating systems for personal computers. The original code has been developed in R and later rewritten in Visual Basic to obtain a more friendly user interface. The CDC can be installed through a .exe file that can be freely obtained from a website indicated below. Once installed, the CDC can be opened as any other Windows program by clicking on the desktop icon or by selecting the program from the start→program→CLIFF'S DELTA CALCULATOR menu. After the welcome screen pops up, an instruction note for the user is presented. This instruction is shown in Appendix B. The navigation through commands and fill boxes can be performed by mouse clicking or by the arrows (→, ←, ↑, ↓) and enter buttons in the console. The program first asks the user for information about the number of observations in Groupl and Group2. These numbers must be indicated in the blank boxes presented for that purpose. Then, a button with the label 'Input these group sizes' should be pressed. These inputs generate an empty matrix to work with. The construction of this object is informed to the user. In the next step the data management for the session should be specified. Data can be inputted from the console to the main screen of the CDC or retreived from an Excel file previously prepared and located in the root of C, as indicated in the initial instruction for users (Appendix B). Both options are easy to follow and friendly. The user can view all the inputted observations or calculate them without preview. Then, a button generates the dominance matrix indicated in Equation 2. The user can choose to see this matrix or to get the result without preview. A 'Calculate now!' button finally shows the sought statistic. An example of the sequence of interactions is shown in Figure 1.
After knowing the Cliff's Delta value, the user can end the session or get some interpretation tips by choosing the button indicated for that purpose. The interpretation tips option opens a new screen with a visual representation of the effect size and some comments about the meaning of the obtained result. An example of this results screen is shown in Figure 2.
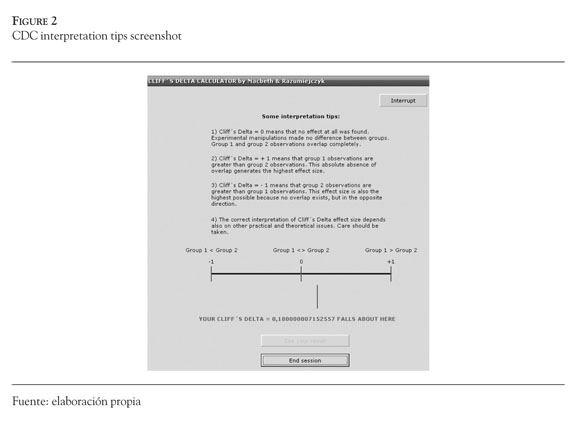
Finally, the user might choose the 'End session' button to close the program. All screens of the CDC offer the user the possibility to interrupt the program anytime by selecting a red button that remains available permanently.
Application examples
Example 1 is taken from a gustative priming experiment conducted by Razumiejczyk, Macbeth and López Alonso (2008). Response times for the recognition of gustative stimuli in two different experimental conditions were compared. The frequency distribution of these two paired groups of observations was not compatible with the normality assumption, but compatible with the variances homogeneity assumption. The Wilcoxon test showed a non-significant difference. After inputting the corresponding observations in an Excel file, as indicated in Appendix B, the CDC obtained an effect size of 0.18. The same result was found with two other programs that are commented below in the discussion section. Interpretation tips of the CDC indicate that these groups are close to the overlap situation, i.e. they do not differ much. Experimental manipulations did not generate a significant effect, as the p-value suggests, and the size of the effect was really low, as Cliff's Delta indicates. This result was consistent with the cognitive model applied (Razumiejczyk et al., 2008). Both statistics, effect size and p-value, suggested the same interpretation of the data. In other cases, when the p-value and effect size measures do not converge, a statistical power analysis is recommended because a type I or a type II error might have ocurred (Cohen, 1988; Cousineau, 2007).
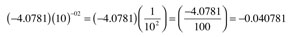
CDC occasionally gives a Cliff's Delta value in scientific notation because the result is very closed to zero. In that case the CDC value has the as pect of a real number a followed by the letter E and an integer exponent b that means (a) (10)b. For example, a Cliff's Delta = -4.0781E-02 includes an a = -4.0781, an E that indicates the exponential scientific notation in base ten and an integer exponent b = -2. The visual representation that the program optionally offers in this case might be obtained after equation 5. When the CDC gives a result in scientific notation, a tool tip text that pops up above the Delta value shows these computations.
(5)
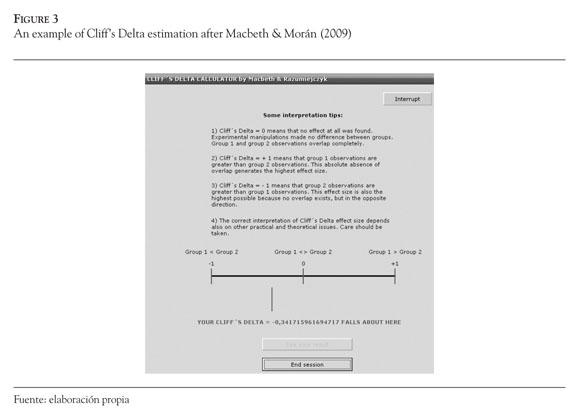
Example 2 is taken from an heuristics and biases experiment conducted by Macbeth & Morán (2009). Some calibration phenomena known as underconfidence biases were experimentally generated by comparing the subjective and the objective success achieved by a group of persons in a series of cognitive tasks. In this case, the comparison was within-group. Parametric effect size measures were informed in the original report because the variables' frequency distributions were compatible with normality and homoscedasticity assumptions. Although Cohen's d is the recommended ESM for the case, non-parametric alternatives are also pertinent and informative. Macbeth and Morán (2009) found a statistically significant difference between the compared groups and a parametric medium effect size of Cohen's d = 0.63. The correspoding Cliff's Delta obtained with CDC is Delta = -0.35. The same result was found with two other calculators that are discussed below. The interpretation of this result is coherent with the p-value and the parametric ESM reported in the original study. Because the computed frequency distributions were compatible with the normality assumption, the parametric Cohen's d gives a better estimate, but Cliff's Delta can also be included in a thorough analysis of experimental results (Hess & Kromrey, 2004). Example 2 application of the CDC is shown in Figure 3.
Availability
The program might be freely downloaded from the website of the Institute for Psychological Research at Universidad del Salvador (IIPUS) located in the web address http://www.iipus.com. The CDC program can be found in the Descargas/Downloads folder.
Discussion
Effect size measures are useful tools for data analysis. When hypothesis testing is limited to p-values interpretation, important complementary information about the evidence is lost (Cohen, 1994). Statisticians and behavioral sciences methodologists have repeatedly promoted the use of these measures (Dunleavy, Barr, Glenn & Miller, 2006). Organizations like the American Psychological Association have also recommended its systematic inclusion in statistical analyses as a standard methodological procedure (American Psychological Association, 2001; Hunter & Schmidt, 2004; Sun, 2008; Thompson, 1998; Wilkinson & Task Force on Statistical Inference, 1999).
Since the use of most technical resources strongly depends on the availaibility of technologies, the aim of this article is to add a freely available software to the methodological toolbox of researchers in the behavioral sciences and other related areas. Cliff's Delta Calculator is an easy-to-use program that calculates the non-parametric effect size for two groups of observations. This statistic is not often included in the most used packages for data analysis. Some freely available statistical languages like R can perform the task but doing so requires programming skills (Venables & Ripley, 2002). In some other cases, commercial packages include some effect size estimators, but mainly for parametric distributions. An important free software that calculates many measures of effect size for two groups of observations is the ES-calc plug-in developed in the environment of ViSta, the Visual Statistics Software (Ledesma et al., 2008, 2009; Young, 1996; Young, Valero-Mora & Friendly, 2006). This useful program includes parametric measures like Cohen's d, Hedges' g, and Glass' delta among other alternatives, but also non-parametric methods like the estimator of Cliff's Delta. To obtain a comprehensive collection of simultaneous effect size measures for two groups of observations, the use of the ES-Calc plug-in for ViSta is recommended.
An important commercial package that calculates this effect size statistic is SAS (Hogarty & Kromrey, 1999). The SAS macro for Cliff's Delta has advantages and disadvantages when compared with the CDC program. Some SAS disadvantages are: 1) the license is very expensive, specially for researchers and institutions in developing countries, 2) it requires programming skills, 3) data cannot be easily inputted as in CDC program and, 4) it offers no interpretation tips. The main advantage is that the SAS output offers confidence intervals for the Delta estimate, but the CDC does not. Future versions of the CDC program will include confidence bands, both numerically and graphically.
The aim of the present article is to promote the use of the Cliff's Delta statistic. The specific contribution of this work is the free availability of a friendly software that facilitates the visualization and interpretation of the effect size for non-parametric comparisons of two groups of observations. The interpretation tips and graphical representations that complement the numerical results are probably interesting features of the CDC program when compared with other calculators like the Es-calc for ViSta (Ledesma et al., 2008, 2009) and the discussed macro for SAS (Hogarty & Kromrey, 1999).
Our future developments in this line of research include the design of new statistical programs related to the complementary analysis of data that might promote the evidence interpretation beyond p-values like confidence intervals for several effect size measures and meta-analytical methods.
References
American Psychological Association. (2001). Publication Manual of the American Psychological Association (5 th ed.). Washington, DC: Author. [ Links ]
Bakeman, R. (2005). Recommended effect size statistics for repeated measures designs. Behavior Research Methods, 37 (3), 379-384. [ Links ]
Cliff, N. (1993). Dominance statistics: Ordinal analyses to answer ordinal questions. Psychological Bulletin, 114, 494-509. [ Links ]
Cohen, J. (1988). Statistical Power Analysis for the Behavioral Sciences (2nd ed.). Hillsdate, NJ: LEA. [ Links ]
Cohen, J. (1994). The earth is round (p < .05). American Psychologist, 49, 997-1003. [ Links ]
Cortina, J. M. & Dunlap, W. P (1997). On the logic and purpose of significance testing. Psychological Methods, 2 (2), 161-172. [ Links ]
Cousineau, D. (2007). Computing the power of a t test. Tutorials in Quantitative Methods for Psychology, 3 (2), 60-62. [ Links ]
Dunleavy, E. M., Barr, C. D., Glenn, D. M. & Miller, K. M. (2006). Effect size reporting in applied psychology: How are we doing? The Industrial- Organizational Psychologist, 43 (4), 29-37. [ Links ]
Fisher, R. A. (1925). Statistical Methods for Research Workers. London: Oliver & Boyd. [ Links ]
Frías-Navarro, M. D., Llobell, J. P & García-Pérez, J. F. (2000). Effect size and statistical significance. Psicothema, 12, 236-240. [ Links ]
Hess, M. R. & Kromrey, J. D. (2004, April). Robust confidence intervals for effect sizes: A comparative study of Cohen's d and Cliff's delta under non-normality and heterogeneous variances. Paper presented at the annual meeting of the American Educational Research Association, San Diego, CA, USA. [ Links ]
Gigerenzer, G. (1993). The superego, the ego, and the id in statistical reasoning. In G. Keren & C. Lewis (Eds.), A Handbook for Data Analysis in the Behavioral Sciences: Methodological Issues (pp. 311-339). Hillsdale, NJ: LEA. [ Links ]
Gigerenzer, G., Swijtink, Z., Porter, T., Daston, L., Beatty, J. & Krüger, L. (1989). The Empire of Chance. How Probability Changed Science and Everyday Life. Cambridge, UK: Cambridge University Press. [ Links ]
Gillett, R. (2001). Sample size determination for a t test given a t value from a previous study: A FORTRAN 77 program. Behavior Research Methods, Instruments, & Computers, 33 (4), 544-548. [ Links ]
Grissom, R. J. & Kim, J. J. (2005). Effect Sizes for Research. Mahwah, NJ: Lawrence Erlbaum Editors. [ Links ]
Hogarty, K. Y. & Kromrey, J. D. (1999, abril). Using SAS to calculate tests of Cliff's Delta. Poster presented at the Twenty-fourth Annual SAS Users Group International Conference, Miami Beach, FL, USA. [ Links ]
Hunter, J. E. & Schmidt, F. L. (2004). Methods of MetaAnalysis. Correcting Error and Bias in Research Findings. Second Edition. Thousand Oaks, CA: Sage. [ Links ]
Kromrey, J. D. & Hogarty, K. Y. (1998). Analysis options for testing group differences on ordered categorical variables: An empirical investigation of type I error control and statistical power. Multiple Linear Regression Viewpoints, 25, 70-82. [ Links ]
Krueger, J. (2001). Null hypothesis significance testing. On the survival of a flawed method. American Psychologist, 56 (1), 16-26. [ Links ]
Ledesma, R., Macbeth, G. & Cortada de Kohan, N. (2008). Effect size: A conceptual review and applications with the ViSta statistical system. Revista Latinoamericana de Psicología, 40 (3), 425-439. [ Links ]
Ledesma, R., Macbeth, G. & Cortada de Kohan, N. (2009). Computing effect size measures with ViSta - The Visual Statistics System. Tutorials in Quantitative Methods for Psychology, 5 (1), 25-34. [ Links ]
Macbeth, G. & Morán, V. (2009). Underconfidence bias as a specific-domain phenomenon. Revista Latinoamericana de Psicología, 41 (1), 47-57. [ Links ]
Razumiejczyk, E., Macbeth, G. & López Alonso, A. O. (2008). Evidence of gustative priming and its dissociation with the explicit memory. Universitas Psychologica, 7 (2), 549-556. [ Links ]
Strube, M. J. (2006). SNOOP: A program for demonstrating the consequences of premature and repeated null hypothesis testing. Behavior Research Methods, 38 (1), 24-27. [ Links ]
Sun, S. (2008). A comprehensive review of effect size reporting and interpreting practices in academic journals in Education and Psychology. Published master's thesis, University of Cincinnati. Available online: http://www.ohiolink.edu/etd/ [ Links ]
Thompson, B. (1994). The concept of statistical significance testing. Practical Assessment, Research & Evaluation, 4, 5. Available online: http://PAREonline.net/getvn.asp?v=4&n=5 [ Links ]
Thompson, B. (1998). Statistical significance and effect size reporting: Portrait of a possible future. Research in the Schools, 5 (2), 33-38. [ Links ]
Valera-Espín, A. & Sánchez-Meca, J. (1997). Significance tests and effect magnitude: Reflections and proposals. Anales de Psicología, 13 (1), 85-90. [ Links ]
Venables, W. N. & Ripley, B. D. (2002). Modern Applied Statistics With S. (4th ed.). Berin: Springer. [ Links ]
Wilkinson, L. & Task Force On Statistical Inference. (1999). Statistical methods in Psychology journals: Guidelines and explanations. American Psychologist, 54, 594-604. [ Links ]
Young, F. W. (1996). ViSta: The Visual Statistics System (Research Memorandum 94-1). North Carolina: UNC L. L. Thurstone Psychometric Laboratory. Young, F. W., Valero-Mora, P M. & Friendly, M. (2006). Visual statistic: Seeing data with dynamic interactive graphics. Hoboken, NJ: John Wiley & Sons. [ Links ] [ Links ]