


Serviços Personalizados
Journal
Artigo
 Inglês (pdf)
 Artigo em XML
 Referências do artigo
 Enviar este artigo por email
Indicadores
-
 Citado por SciELO
 -
 Acessos
Links relacionados
-
 Citado por Google
 -
 Similares em
SciELO
Similares em
SciELO -
 Similares em Google
Compartilhar

 Permalink
Universitas Psychologica
versão impressa ISSN 1657-9267
Univ. Psychol. vol.13 no.1 Bogotá jan./mar. 2014
Validation of the Cognitive Structure of an Arithmetic Test with the Least Squares Distance Model (LSDM)*
Validación de la estructura cognitiva de una prueba aritmética con el Modelo de Distancia Mínima de Cuadrados (LSDM)
Sonia J. Romero**
Universidad a Distancia de Madrid, España
Xavier G. Ordóñez***
Universidad Complutense de Madrid, España
*Artículo de investigación.
**Profesor asociado. Departamento de Psicología. Universidad a Distancia de Madrid, España. E-mail: soniajaneth.romero@udima.es
***Profesor Ayudante Doctor, Facultad de Educación. Universidad Complutense de Madrid. E-mail: xavor@edu.ucm.es
Recibido: octubre 3 de 2012 | Revisado: febrero 21 de 2013 | Aceptado: junio 11 de 2013
Para citar este artículo
Romero, S. J., & Ordonez, X. G. (2014).Validation of the cognitive structure of an arithmetic test with the Least Squares Distance Model (LSDM). Uníversítas Psychologica, 13(1), 333344. doi:10.11144/Javeriana.UPSY13-1.vcsa
Abstract
The aim of the present paper is to collect evidence about validity of the cognitive structure proposed to solve the items of an arithmetic test using an cognitive diagnosis model (based on the Item Response Theory) called Least Squares Distance Model (LSDM). The test was applied to a sample of 382 students of 7th grade from five public high schools in Bogotá-Colombia. With this data the objective was addressed in three ways: first, the analysis of two statistical validity indices; second by a cross -validation of the LSDM results on attribute difficulties using other cognitive model (LLTM), and third, by comparing the LSDM results with the observed scores on individual attributes. The logical behavior of the probability curves for the five attributes under study provides important evidence for their overall validity. Additional specific evidences of validity are also presented in the results.
Keywords authors: cognitive diagnosis models; least squares distance model; arithmetic test; Q-matrix
Keywords plus: Validaty; statistical methods; quantitative research
Resumen
El objetivo del presente trabajo ha sido reunir evidencias sobre la validez de la estructura cognitiva propuesta para resolver los ítems de un test de aritmética, mediante la aplicación de un modelo de diagnóstico cognitivo basado en la Teoría de Respuesta al Item llamado Modelo de las Distancias Mínimo Cuadráticas (LSDM, por sus siglas en inglés). El test se aplicó a una muestra de 382 estudiantes de séptimo grado en cinco colegios públicos en Bogotá-Colombia. Usando estos datos el objetivo se abordó de tres maneras: en primer lugar se analizaron dos índices estadísticos de validez, en segundo lugar, se realizó una validación cruzada de los resultados del LSDM sobre las dificultades de atributos utilizando otro modelo cognitivo (LLTM) y en tercer lugar, se compararon los resultados del modelo con las puntuaciones observadas en atributos individuales. El comportamiento lógico de las curvas de probabilidad para los cinco atributos estudiados proporciona importante evidencia para su validez general. En los resultados se presentan también otras evidencias concretas de validez de la estructura propuesta.
Palabras clave autores: modelos de diagnostico cognitivo; modelo de las distancias mínimo cuadráticas; test de aritmética; matriz Q
Palabras clave descriptores: validez; métodos estadísticos; investigación cuantitativa
The purpose of the cognitive diagnostic measure is to study the cognitive structures, (e.g specific knowledge and processing skills) underlying correct execution of test items. This type of measurement is intended to provide information on the cognitive strengths and weaknesses of the examinees. Interest in development of psychometric models that incorporate attributes, rules or cognitive processes is relatively new but has advanced to the extent that there is now a wide range of models (e.g., De la Torre & Douglas, 2004; Dimitrov, 2007; Henson & Douglas, 2005; Junker & Sijtsma, 2001). Some of these models are based in the Item Response Theory (IRT) like the Linear Logistic Test Model ([LLTM]; Fischer, 1973, 1995), the Multicomponent and General Latent Trait Models ([MLTM-GLTM]; Embretson, 1984, 1993), the Rule Space Model (Tatsuoka, 1985) or the more recently proposed Least Squares Distance Model (Dimitrov & Atanasov, 2011).
One of the key elements of cognitive diagnosis is the specification of the cognitive structure underlying the test, this means, to determine the type, amount and relationships between components or cognitive attributes and their links to specific items or tasks. The links between attributes and items are usually represented in a binary matrix called Q-matrix (Tatsuoka, 1985). The elements of Q specify whether the attribute k is required to successfully complete the item j (qjk = 1) or not (qjk = 0).
Knowledge about cognitive structures can help test developers and educators to construct test items with desirable measurement and cognitive characteristics, better understand of attributes of thinking, learning, and performance, and to develop teaching strategies focusing on specific cognitive and processing criteria, however, is very important to evaluate whether the attributes considered are actually used by the examinees to solve the items. In other words, the validation of the cognitive structure is a key issue in the development of cognitive measurement.
Traditionally, the validation process involves the analysis of the Q-matrix, some of the proposed statistical methods for validation of cognitive structures are: likelihood ratio test (Embretson, 1984), quadratic assignment (Medina-Diaz, 1993), cluster analysis (Corter, 1995), classification rates (Tatsuoka, 1995), structural equation modeling (Dimitrov & Raykov, 2003), parameter estimation (Rupp & Templin, 2008), delta method (De la Torre, 2008), and more recently, the LSDM (Dimitrov & Atanasov, 2011).
Although there is a considerable amount of psychometric models and Q-matrix validity methods, few applications have been made. In the mathematic testing field several works have been based on a test of fraction subtraction (De Carlo, 2011; De la Torre, 2009; De la Torre & Douglas, 2004, 2008; Rupp, Templin, & Henson, 2010) originally designed by Tatsuoka (1990). Other applications of cognitive diagnosis on mathematic test includes algebra tasks (Dimitrov & Raykov, 2003; Medina-Díaz, 1993); fraction addition and subtraction (López & Elosua, 2002), arithmetic tests (Romero, Ponsoda & Ximenez, 2006, 2008) and the analysis of mathematic skills in large scale assessments (Romero, Ordóñez, López & Navarro, 2009; Tatsuoka, Corter, & Tatsuoka, 2004).
This study investigates attributes that underlie the student performance on a test of basic arithmetic operations using the LSDM and to compare the results with observed scores on individual attributes.
For reach this aim, the present work have three specific objectives: 1) to apply the LSDM to collect evidence about validity of the cognitive structure proposed for an arithmetic test by means of two indices: the Mean Absolute Difference (MAD) and the Least Squares Distance (LSD); 2) to use the Linear Logistic Test Model (Fischer, 1973) like cross-validation of the LSDM results on attribute difficulties and 3) to explore the validity of Attribute Probability Curves (APCs) by means of the descriptive comparison of LSDM estimated APCs and the IRT Item Characteristic Curves (ICCs) of the directly measure of individual attributes.
The Least Square Distance Model (LSDM)
The LSDM is a model for the validation of cognitive structures and analysis of binary items using his IRT parameters. This method use the parameters estimated with a model IRT and the Q-matrix to estimate the probability of mastering the attribute Ak in pre-fixed ability levels (in the logit scale). Like most of the cognitive diagnosis models, the LSDM assumes a conjunctive relation between attributes, in other words, the probability of correct answer to an item is the product of the likelihoods of all attributes required by that item, that is:
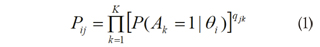
Where, Pij is the probability of correct response on item j for a person at ability level θi, P(Ak = 1 | θj ) is the probability of correct performance in attribute Ak for an examinee at the ability level θ. and qjk is the element of the Q-matrix for item j and attribute Ak.
The model expressed in equation (1) assumes that the correct execution of an attribute is statistically independent for an examinee in a fixed ability level. The LSDM estimates the attribute probabilities directly using the least squares approximation from the linear algebra.
The steps for the application of the LSDM are: a) fix a reasonable number of ability levels in the logit scale, b) having the IRT item parameters and the pre-fixed ability levels, find the probability of correct response on item j in each ability level Píj by applying the corresponding IRT model that fit the data, may be Rasch Model, 2 Parameter Logistic Model (2PLM), or 3 Parameter Logistic Model (3PLM), c), take the neperian logarithm in both sides of equation (1), d) with n binary items the equation (1) produce the following the system of linear equations: L= QX where L is a (known) matrix with elements In (P ), Q is the (known) Q-matrix and X is a (unknown) matrix with elements in P(Ak = 1 | θj ), e) find the values of X that minimize the Euclidean norm ||QX - L||, using matrix algebra (Lawson & Hanson, 1974). Finally, the probability to master the attribute Ak for an examinee with an ability level θ. is exp (Xk) the graphical representation of that probability across the pre-fixed ability levels is called Attribute Probability Curve (APC) for the attribute Ak.
MAD and LSD indices
Dimitrov (2007) proposed three validation criteria for the LSDM:
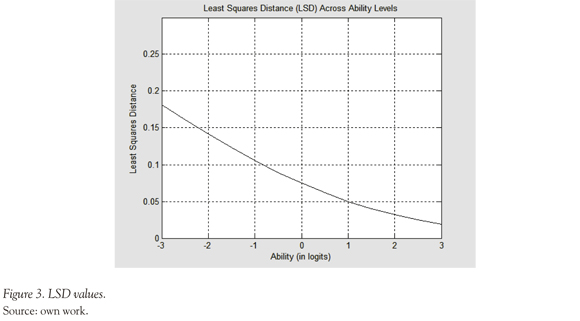
- Small LSD values. Least Squares Distance (LSD) values are the residuals after minimization of ||QX - L|| and they must be small to indicate a suitable solution for . Small LSD values indicates better general fit of the model.
- Monotonicity of the APCs. APCs should increase monotonically because higher attribute probabilities should correspond to higher abilities. The APCs also provide information about relative "difficulty" and "discrimination" of attributes: if the difference in the difficulty of the attributes is sufficiently large, the APCs will not cross and the attributes can be ordered in decreasing difficulty. The last feature of the LSDM allow to the research make a cross-validation of the results using other componential models like the LLTM. The APCs also offer information about attribute "discrimination": if the attributes discriminate suitably, the "difficult" attributes should discriminate well among high ability examinees and, conversely, "easy" attributes should discriminate well among low ability examinees.
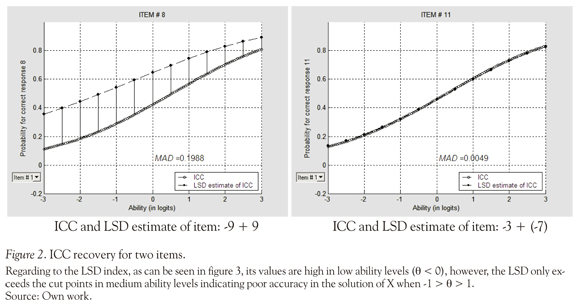
- Adequate recovery of the ICCs: a graphical comparison between the two sides of equation (1) for each item should show similar curves; this comparison is made by means of the Mean Absolute Difference (MAD) of probabilities, as can be seen in the following expression:

Where, F is the number of fixed ability levels, Pij is the matrix of IRT probabilities and PiJ is the matrix of probabilities recovered by the product of APCs estimated with the LSDM according to the matrix. Ideally, MAD = 0 would indicate perfect ICC recovery. Dimitrov (2007) presents the following classification for degree of ICC recovery: very good (0 < MAD < 0.02), good (0.02 < MAD < 0.05), somewhat good (0.05 < MAD < 0.1), somewhat poor (0.1 < MAD < 0.15), poor (0.15 < MAD < 0.2) and very poor (MAD > 0.2).
Romero, Ordoñez and Ponsoda (2012)), using simulation procedures, propose the following cut points (over which the MAD values indicate a possible Q-matrix misspecification in those particular item), according to the sample size (N = 300) and number of attributes required by the item (k): 0.166 (k = 1); 0.115 (k = 2); 0.085 (k = 3); 0.106 (k = 4). These authors also present the following cut points for LSD values in the sample of N = 300, that also were used for the present work in order to evaluate the global fit of the model: 0.253 (θ = -3), 0.161 ((θ = -2), 0.086 (θ = -1), 0.043 (θ = 0), 0.031 (θ = 1), 0.032 (θ = 2), 0.027 (θ = 3).
Procedure
Defining the Cognitive Structure
A cognitive structure based in five attributes was proposed in order to explain the solution process of the arithmetic tasks. This structure was based in verbal protocols, interviews with mathematics teachers of the schools in which the test was applied; study of curriculums and mathematic courses offered in the target schools. Also, the cognitive theory and systematical analysis of the solution processes of addition and subtraction (Kamii & Joseph, 1989; Maza, 1991, 1999; Mialaret, 1984) were used to select the attributes that compose the cognitive structure.
The basic operations that are learned in early primary education are called for some authors "numerical facts" (Maza, 1991; 1999). If a and b are natural numbers, the "additive fact" consist in the sum of quantities involved, while the "subtractive fact" consist in subtract the quantities (when a > b). According to the interviewed teachers, once the students acquire control over the "numerical facts", they begin to teach operations with integer numbers. Commonly, the teaching process of sum with integer numbers starts with the absolute value and straight-line notion. Then it is introduced the addition with the same sign numbers; a common rule to teach this operation is: "sum the quantities and put to the result the sign of the involved numbers". This rule is reflected in the cognitive structure as attribute A5.
The addition with different sign numbers is then introduced, a usual rule for this operation is: "subtract greatest minus a lesser number in absolute value and put at the result the sign of the greatest value", this rule is reflected in the cognitive structure in the attribute A3. Another ordinary way for teaching subtraction between integer numbers is by using the inverse additive property: -a + b = b - a (attribute A4).
Finally, teachers refer two additional rules to solve parenthesis:
1. a - (-b) = a + b and -a - (-b) = -a + b (Attribute A1)
2. a + (-b) = a - b and -a + (-b) = -a - b (Attribute A2)
Based in these common processes of teaching learning of the arithmetical operations with integer numbers the following attributes were proposed:A1 Solve parenthesis in subtraction [-a - (- b) = - a + b; a - (-b) = a + b]
A2 Solve parenthesis in addition [-a + (-b) = -a - b; a + (-b) = a - b]
A3 Subtraction when a < b [a - b = - (b - a)]
A4. Addition with different sign numbers [-a + b = (b - a)]
A5 Subtraction with different sign numbers [-a - b = -(a + b)]
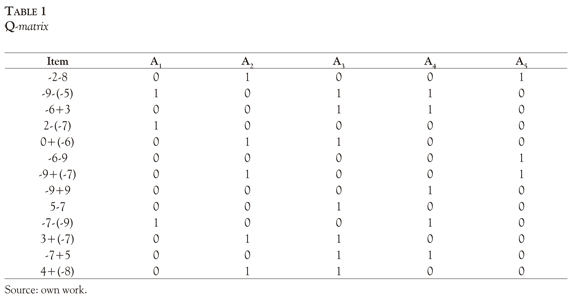
The Arithmetic Test and Q-Matrix
A test of 13 items was designed according to the theoretic cognitive structure defined previously and expressed in the following Q-matrix: (See table 1)
Characteristics of the Arithmetic Test
Additionally to the 13 items presented in the Q-ma-trix (see Table 1) 20 "individual" items were included in the test with the intention to measure examinee knowledge of individual rules or attributes. For example, the correct answer of the item: "-2 + (8) = a. -10 b. -6 c. 6 d. 10" implied the correct use of two attributes: first, A2: -2 + (-8) = -2 - 8 and then A5: - 2 — 8 = - (2+8) = -10. The individual items were designed with the objective of obtaining scores of student proficiency in each of these steps. According to this aim the individual items that correspond to the two attributes exemplified above are: "-2 + (-8) = a. -2 + 8 b. -2 - 8 c. 2 + 8 d. 2 - 8" for A2 and "-2 — 8 = a. -(2+8) b.-(2-8) c.2+8 d. 2-8" for A5. The general item and its corresponding individual items are not continued; its position in the test was assigned at random.
Sample
The arithmetic test was applied to an intentional sample of 382 students of 7th grade from five public schools in Bogotá-Colombia. The test was applied as an additional exercise of the mathematics class in order to guarantee students attention to develop the evaluation. The test was made in a mean of 40 minutes.
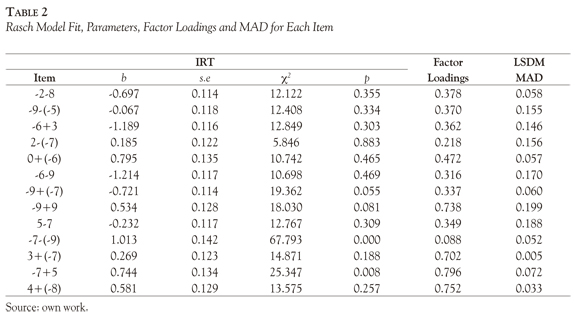
IRT calibration and application of the models
The data matrix was calibrated using the Rasch model, the Table 2 present the item fit and parameters used to the LSDM analysis. In order to accomplish the first objective, the LSDM criteria (MAD, and LSD) were studied according to the referred cut points; also the monotonicity of the APCs was evaluated.Second, the LLTM were applied, with the 13 general items, and cross-validation on attribute relative "difficulties" was made using the LLTM basic parameters. Finally, comparison between LSDM estimated APCs and the ICCs product of the calibration of the observed scores on individual attributes (individual items) was made to study the quality of the APCs estimation.
Software and data analysis
Data analysis includes: checking of dimensionality of the arithmetic test ([NOHARM]; Fraser & McDonald, 1988); item calibration ([RASCAL]. Assessment System Co, 1996); LSDM application ([MATLAB], Dimitrov, 2007) and LLTM application ([LPCM-Win]; Fischer & Ponocny-Seliger, 1998).
Results
Dimensionality and IRT Calibration
The fit of the Rasch model, difficulty parameters and its standard error are presented in Table 2. In this table can be seen that the item -7 - (-9) does not present good fit to the Rasch model, but in general, the test fits the IRT model. Table 2 also presents the factor loadings to the unidimensional model. The factorial structure was analyzed by means of a normal ogive compensatory multidimensional model implemented in NOHARM. The fit of the unidimensional model was evaluated by the Tanaka Index (T), although there is not a common rule of interpretation for this index, it is proposed that values above 0.9 indicate acceptable fit (Tanaka & Huba, 1985). The Tanaka index for the unidimensional model is T = 0.961 and the Root Mean Square of the Residuals (RMSR = 0.031) indicating, as expected, the adequacy of the unidimensional solution. Additionally, all the items have high loading to the factor except the item -7 - (-9).
Evidence about Validity of Cognitive Structure
The APCs obtained with LSDM are provided in Figure 1.
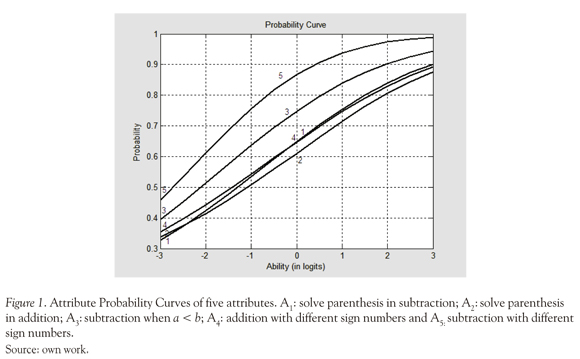
As can be seen, these curves exhibit logical monotonic behavior: a) the higher the ability, the higher the chances of the examinees to correctly perform each attribute and b) more difficult attributes (e.g., A2) discriminate well among high ability examinees, but not among low ability examinees and, conversely, relatively easy attributes (e.g., A5) discriminate well among low ability examinees, but not among high ability examinees.
The logical behavior of the APCs is an important criterion for their validity, in this case, the attributes exhibit a logical behavior, the "easiest" attribute is A5 (subtraction with different sign numbers), this is theoretically expected because it is an operation that only requires to sum the numbers and attach the negative sign: -a - b = -(a+b). By the contrary, the most "difficult" attributes were A1: solve parenthesis in subtraction; A2: solve parenthesis in addition and A4: addition with different sign numbers, the difficulty of this attributes may be explained because they are the last operations taught because require the mastery of previous skills.
Another validation perspective of the attributes under study is the degree to which the ICC for each item is recovered with the product of LSDM estimates of the probabilities for correct performance on the attributes required by the item. Ideally, MAD = 0 would indicate perfect ICC recovery. Last column of the Table 2 presents the MAD values of the arithmetic test items and signaled in bold the poor recovered items according to the cut points proposed by Romero, Or-dóñez and Ponsoda (2012), only 30% of items present poor recovery according to MAD index, and the worst recovered is the item -9 + 9 (MAD = 0.19), this may be caused because it is an item that involve the "inverse additive" property. The right side of Figure 2 exhibits the ICC and LSDM curves for the best recovered item and the left side for the worst recovered item.
Comparison of APCs and ICCs of step-items of Individual Attributes
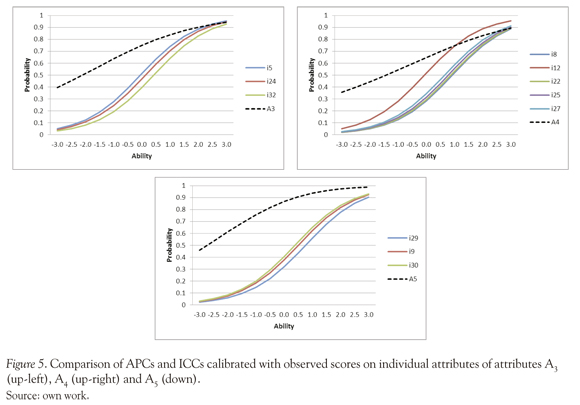
In order to explore the APCs behavior with respect to the observed scores on individual attributes, figures 4 and 5 compare the APCs obtained with the LSDM with the ICCs of the respective "individual" items calibrated with the Rasch model.
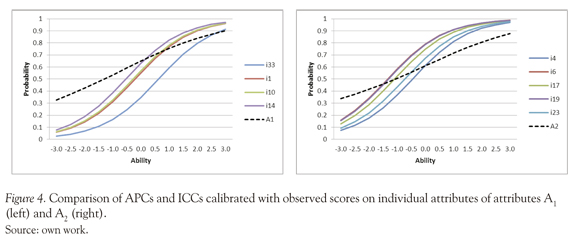
Figure 4 shows that the ICCs and APCs are very similar in the case of A1 and A2. The graphic exhibits a slight LSDM trend of overestimates the probabilities in low ability levels, and conversely, underestimates the probabilities in high ability levels. Figure 5 present the attributes A3, A4 and A5; these figures exhibit some differences between ICCs for individual items and the APCs estimated with the LSDM, it seems clear that LSDM tends to overestimate the probabilities, especially in low ability levels, this discrepancy may be caused by the conjunctive nature of the model.
Cross-Validation of the LSDM Results Using the LLTM
Finally, a cross-validation of the attribute of relative difficulty was made by means of other IRT based model called LLTM (Fischer, 1973). The LLTM allows estimating the contribution of different attributes to the difficulty item by a linear decomposition of the IRT difficulty parameter. To use properly the model, two requirements must be met: a) the Rasch model fit, and, b) the accurate reproduction of the Rasch difficulty parameters. In the present context the LLTM shows somewhat good fit statistics: the correlation between the Rasch and LLTM item difficulties was 0.81, although the statistically significant LR test (X2 = 164,98; df =6, p < 0.01) indicate that the proposed attributes do not fully explain the difficulties of the item.
Table 3 presents the basic parameters for each attribute that represents the linear contribution of the attribute to the overall Rasch difficult item and its statistical significance.
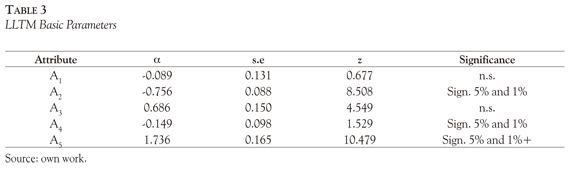
The five attributes of the present study can be ordered by increasing difficulty as follows: A5, A3, A1, A4 and A2. This order is a perfect match to the LLTM order of attributes "relatively difficult" providing a cross-validation of the LSDM results.
Conclusions
This study illustrated the application of the LSDM in the validation and analysis of cognitive attributes that were hypothesized to underlie the correct solution of items with two arithmetic operations (addition and subtraction) of integer numbers. The logical behavior of the probability curves for the five attributes under study provides important evidence for their overall validity. The LSD values, as global fit indicators, shows that the model exhibit less accuracy in medium ability levels, while the MAD values allow us to identify particular items with cognitive misspecifications, as it is the case of items: "-9 - (-5)", "-6 + 3", "9 + (9)" and " 5- 7". When such problems are signaled, the search for plausible explanations may also contribute to better understanding (and possibly revise) the attributes and their links to items in the -matrix.
Results of the LSDM performance with observed scores on individual attributes shows that the APCs recovered with LSDM match well the ICCs of individual items for operations A1 and A2 but for A3 A4 and A5 the APCs tends to be over the ICCs on all the ability levels; these results may be explained by the conjunctive nature of the model, moreover, the product of logistic curves is not logistic, for this reason this work presents a descriptive and exploratory explanation, more than a statistical comparison between curves.
For the other hand, a perfect match between LLTM basic parameters and LSDM relative attribute difficulties was found, therefore the LSDM results was confirmed, as well as the plausibility of the overall cognitive structure proposed for the arithmetic test.
The mentioned results show the importance of cognitive diagnosis assessment, not only on the large scale assessment, but also in the classroom evaluation; for example, the results obtained in this study may have important implications for the practice of teaching arithmetic operations in the target schools. The illustrated approach with using the LSDM can be applied in other areas of learning and cognition in the theory and practice of education.
References
Assessment Systems Corporation. (1996). RASCAL: Rasch analysis program. St. Paul, MN: Author. [ Links ]
Corter, J. E. (1995). Using clustering methods to explore the structure of diagnostic tests. In P. D. Nichols., S. F. Chipman & R. L. Brennan (Eds.), Cognitively diagnostic assessment. (pp. 305-326). Hillsdale, NJ: Lawrence Erlbaum Associates, Inc. [ Links ]
De Carlo, L. T. (2011). On the analysis of fraction subtraction data: The DINA model, classification, latent class sizes, and the Q-matrix. Applied Psychological Measurement, 35(1), 8-26. [ Links ]
De la Torre, J. (2008). An empirically based method of Q-Matrix Validation for the DINA Model: Development and applications. Journal of Educational Measurement, 45(4), 343-362. [ Links ]
De la Torre, J. (2009). DINA model and parameter estimation: A didactic. Journal of Educational and Behavioral Statistics, 34, 115-130. [ Links ]
De La Torre, J., & Douglas, J. A. (2004). Higher-order latent trait models for cognitive diagnosis. Psy-chometrika, 69(3), 333-353. [ Links ]
De La Torre, J., & Douglas, J. A. (2008). Model evaluation and multiple strategies in cognitive diagnosis analysis of fraction subtraction data. Psychometri-ka, 73(4), 595-624. [ Links ]
Dimitrov, D. M. (2007). Least squares distance method of cognitive validation and analysis for binary items using their item response theory parameters. Applied Psychological Measurement, 31 (5), 367-387. doi: 10.1177/0146621606295199 [ Links ]
Dimitrov, D. M., & Atanasov, D. V. (2011). Conjunctive and disjunctive extensions of the least squares distance model of cognitive diagnosis. Educational and Psychological Measurement, 72(1), 120-238. doi: 10.1177/0013164411402324 [ Links ]
Dimitrov, D. M., & Raykov, T. (2003). Validation of cognitive structures: A structural equation modeling approach. Multivariate Behavioral Research, 38(1), 1-23. doi: 10.1207/S15327906MBR3801_1 [ Links ]
Embretson, S. (1984). A general latent trait model for response processes. Psychometrika, 49(2), 175-186. doi: 10.1007/BF02294171 [ Links ]
Embretson, S. (1993). Psychometric models for learning and cognitive processes. In N. Frederiksen, R. J. Mislevy & I. I. Bejar (Eds.), Test theory for a new generation of tests (pp. 125-150). Hillsdale, NJ: Erlbaum. [ Links ]
Fischer, G. H. (1973). The linear logistic test model as an instrument in educational research. Acta Psychologica, 37(6), 359-374. [ Links ]
Fischer, G. H. (1995). The linear logistic test model. In G. H. Fisher & I. W. Molenaar (Eds.), Rasch models: Foundations, recent developments, and applications (pp. 131-156). New York: Springer-Verlag. [ Links ]
Fischer, G. H., & Ponocny-Seliger, E. (1998). Structural Rasch modeling. Handbook of the usage of PLCM-WIN 1.0. Groningen, the Netherlands: proGAMMA. [ Links ]
Fraser, C., & McDonald, R. P. (1988). NOHARM: Least squares item factor analysis. Multivariate Behavioural Research, 23(2), 267-269. [ Links ]
Henson, R. A., & Douglas, J. (2005). Test construction for cognitive diagnosis. Applied Psychological Measurement, 29(4), 262-277. doi: 10.1177/0146621604272623 [ Links ]
Junker, B. W., & Sijtsma, K. (2001). Cognitive assessment models with few assumptions and connections with nonparametric item response theory. Applied Psychological Measurement, 25(3), 258-272. doi: 10.1177/01466210122032064 [ Links ]
Kamii, C., & Joseph, L. L. (1989). Young children continue to reinvent arithmetic-2nd grade: Implications of Piagets theory. New York: Teachers College Press. [ Links ]
Lawson, C. L., & Hanson, R. J. (1974). Solving least squares problems. Englewood Cliffs, NJ: Prentice-Hall. [ Links ]
López, A., & Elousa, P. (2002). Formulación y validación de un modelo logístico lineal para la tarea de adición y sustracción de fracciones y números mixtos. Psicothema, 14(4), 802-809. [ Links ]
Maza, C. (1991). Enseñanza de la suma y de la resta. Madrid: Síntesis. [ Links ]
Maza, C. (2001). Adición y sustracción. In E. de Castro (Ed.), Didáctica de la Matemática en la Educación Primaria (pp. 177-202). Madrid: Síntesis. [ Links ]
Medina-Diaz, M. (1993). Analysis of cognitive structure using the linear logistic test model and quadratic assignment. Applied Psychological Measurement, 17(2), 117-130. doi: 10.1177/014662169301700202 [ Links ]
Miaralet, G. (1984). Las matemáticas: ¿cómo se aprenden, cómo se enseñan? Madrid: Visor. [ Links ]
Romero, S. J., Ordóñez, X., & Ponsoda, V. (April, 2012). Distribution and properties of three criteria for validation of cognitive structures by means of the LSDM. Paper presented at the 2012 NCME Annual Meeting, Vancouver, Ca. [ Links ]
Romero, S. J., Ordoñez, X., López, E., & Navarro, E. (2009). Análisis de la estructura cognitiva de la competencia científica en PISA 2006 mediante el LSDM: el caso español. Psicothema, 21 , 509-514. [ Links ]
Romero, S. J., Ponsoda, V., & Ximénez, C. (2006). Validación de la estructura cognitiva del test de signos mediante modelos de ecuaciones estructurales. Psicothema, 18(4), 835-840. [ Links ]
Romero, S. J., Ponsoda, V., & Ximénez, C. (2008). Análisis de un test de aritmética mediante el modelo logístico lineal de rasgo latente. Revista Latinoamericana de Psicología, 40(1), 85-95. [ Links ]
Rupp, A. A., & Templin, J. L. (2008). The effects of Q-matrix misspecification on parameter estimates and classification accuracy in the DINA model. Educational and Psychological Measurement, 68(1), 78-96. [ Links ]
Rupp, A. A., Templin, J. L., & Henson, R. A. (2010). Diagnostic measurement: Theory, methods, and applications. New York: The Guilford Press. [ Links ]
Tanaka, J. S., & Huba, G. J. (1985). A fit index for co-variance structure models under arbitrary GLS estimation. British Journal of Mathematical and Statistical Psychology, 38(2), 197-201. [ Links ]
Tatsuoka, K. K. (1985). A probabilistic model for diagnosing misconceptions by the pattern classification approach. Journal of Educational Statistics, 10(1), 55-73. [ Links ]
Tatsuoka, K. K. (1990). Toward an integration of item-response theory and cognitive error diagnosis. In N. Frederiksen, R. Glaser, A. Lesgold & M. Shafto (Eds.), Diagnostic monitoring of skill and knowledge acquisition (pp. 453-488). Hillsdale, NJ: Erlbaum. [ Links ]
Tatsuoka, K. K., Corter, J. E., & Tatsuoka, C. (2004). Patterns of diagnosed mathematical content and process skills in TIMSS-R across a sample of 20 countries. American Educational Research Journal, 41(4), 901-926. [ Links ]
