


Services on Demand
Journal
Article
 English (pdf)
 Article in xml format
 Article references
 Send this article by e-mail
Indicators
-
 Cited by SciELO
 -
 Access statistics
Related links
-
 Cited by Google
 -
 Similars in
SciELO
Similars in
SciELO -
 Similars in Google
Share

 Permalink
Colombia Médica
On-line version ISSN 1657-9534
Colomb. Med. vol.39 no.3 Cali July/Sept. 2008
Posterior elevation maps and mean power keratometric maps to evaluate keratoconus and guide Intacs implantation: a step towards improving Intacs nomogram
María Ximena Núñez, MD1, Claudia Blanco, MD2
1. Assistant Professor, Ophthalmology Service, Universidad del Valle. Cornea and Refractive Surgery Department, Clínica de Oftalmología de Cali, Cali, Colombia. e-mail: mavinunez@univalle.edu.co
2. Auxiliar Professor, Ophthalmology Service, Universidad del Valle. Cornea and Refractive Surgery Department, Clínica de Oftalmología de Cali, Cali, Colombia. e-mail: clablanco@univalle.edu.co
Recibido para publicación diciembre 18, 2007 Aceptado para publicación junio 26, 2008
SUMMARY
Introduction: Keratoconos is a cornea disorder that affects young people and is a contraindication for refractive surgery; it could be treated with contact lens, corneal transplantation or with intracorneal ring segments (Intacs) insertion. Purpose: To compare mean power keratometric maps and posterior elevation maps in delineating keratoconus characteristics and guide Intacs implantation.
Methods: 23 eyes with keratoconus, 12 subjects, cone area, cone radii, cone peak area and coordinates were measured using both maps and were compared using t test. Statistical significance was defined as p<0.05. Correlations were assessed with Pearsons coefficient.
Results: Mean cone area was 17.65 mm² ± 4.63 and 35.68 mm² ± 9.72 in posterior elevation map and mean power keratometric analysis respectively (p 0.00). Both posterior elevation and mean power keratometric maps finds a similar percentage split between centre cones (CC) and de-centered cones (DC) of 78:22. However, 9% cases were found not to match after case to case evaluation.
Conclusion: Based on the cases that not matched the cone centration, we suggest a new way to define the cone centre using the mean power keratometric map. Therefore, it should be review the decisions to implant symmetric rings vs. asymmetric rings using posterior elevation map. A new parameter is discussed «cone peak centration» in de-centered cones (DC).
Keywords: Mean power keratrometric map; Posterior elevation map; Cone peak; Cone centered; Cone de-centered; Intacs.
Mapas de elevación posterior y «mean power keratometric» para evaluar el queratocono y guiar el implante de «Intacs»: un paso hacia el mejoramiento del nomograma de «Intacs»
RESUMEN
Introducción: El queratocono es una enfermedad que afecta individuos jóvenes y es una contraindicación para realizar cirugía refractiva; se puede manejar con lentes de contacto, queratoplastia o anillos intraestromales («Intacs»).Propósito: Comparar los mapas topográficos «mean power keratometric» y elevación posterior en la delineación de las características del queratocono y guiar el implante de «Intacs».
Métodos: Se evaluaron 23 ojos con queratocono en 12 sujetos. Se midió el área del cono, el radio del cono, el área del pico del cono y sus coordenadas, en ambos mapas y se compararon usando la prueba t. La diferencia estadística se definió como p<0.05. Se realizaron correlaciones con el coeficiente de Pearson.
Resultados: La media del área del cono fue de 17.65 mm² ± 4.63 y 35.68 mm² ± 9.72 en el análisis con el mapa de elevación posterior y el «mean power keratometric» respectivamente (p 0.00). En ambos mapas se encontró un porcentaje de distribución similar entre conos centrados (CC) y conos descentrados (DC) de 78:22. Sin embargo, en la evaluación caso a caso, en 9% de los casos no hubo concordancia.
Conclusión: Soportados en los resultados de la no concordancia con respecto a la centración del cono, se sugiere una nueva manera de definir el centramiento del queratocono usando el mapa «mean power keratometric» y por tanto la decisión de implantar «Intacs» simétricos o asimétricos sobre el modo tradicional con elevación posterior. Se discute un nuevo parámetro la centración del pico del cono en DC.
Palabras clave: «Mean power keratrometric»; Elevación posterior; Pico de cono; Cono centrado; Cono descentrado; «Intacs».
Keratoconus is characterized by non inflammatory stromal thinning and anterior protrusion of the cornea1. Refractive outcome due to such corneal distortion includes myopia, and regular or irregular astigmatism. Intacs, also known as intrastromal corneal ring segments (ICRS) is used to manage patients with keratoconus, as an alternative to contact lenses or transplant surgery.
Addition technology recommends Intacs surgery using Mark Swansons nomogram which is based on parameters as posterior elevation map, spherical equivalent and the incision is located on the steep meridian or topographic axis of positive cylinder. This nomogram uses the posterior elevation map to define cone position.
Although the posterior surface is not optically as important as the anterior surface2, it is structurally more fluid and therefore a sensitive indicator of abnormality. This occurs because corneal lamellar disposition and proteoglycan composition allow posterior fibers to buckle inward, while anterior fibers remain under tension and retain their shape. Often, rather than magnitude of posterior irregularity the posterior elevation map is a better indicator of corneal instability whether due to disease, healing or ectasia.
While this nomogram works well for a substantial number of keratoconus patients, minute percentage of patients do not improve due to limitations in the current nomogram. Recently Swanson reported the data of 1000 ICRS surgeries and noted that 10% cases of this large series did not observe any change in the postoperative visual acuity, (data presented in the Intacs Users Meeting performed in Bogotá, Colombia; on November 29-30, 2006 (datos sin publicar). Swanson did not observe any reason for this result. One of the hypotheses to explain this phenomenon could be plausible incorrect delineation of cone position using posterior elevation maps. We examined an alternative way to define cone and cones peak from mean power map and compared this data with the one obtained from posterior elevation maps.
Curvature mapping is a corneal topography descriptor. It is proportional to the paraxial power of a surface, and is the most well-established method for depicting corneal shape3. The curvature topographic maps are classified as axial, meridional, mean and toricity curvature in accordance to the American National Standards Institute, Standards in Corneal Topography, ANSI Z80.23-1999. The traditional names are axial or sagital, tangential, mean power and astigmatic power maps. Axial and tangential power maps are the most commonly available curvature map outputs in most topographers. However, the recognition of the keratoconus on these maps is not easy because there is no simple characteristic pattern.
Mean curvature map is commercially available on Orbscan topographer. This map is potentially a better method for detecting corneal ectatic conditions4. It is computed at each point on the corneal surface by averaging the curvature along two orthogonal principal directions. Tang et al.5 examined the use of mean curvature maps to define keratoconus cone characteristics and found mean corneal maps to more exactly define cone characteristics than the conventional axial and tangential power maps. This paper compares the cone characteristics of diagnosed keratoconus patients using both posterior elevation maps and mean curvature maps and evaluates the possibility of the use of mean power maps to improve the Intacs nomogram and allow us to take better decision on the size and symmetricity of the Intacs procedure and potentially improve predictability of postoperative results with ICRS.
METHODS
This observational case series study compares the characteristics of keratoconus evaluated with mean power keratometric and posterior elevation mapping. Twenty three eyes of 12 patients with bilateral keratoconus were recruited between April and July of 2006 and underwent intrastromal inserts (Intacs) placement at the Clínica de Oftalmolgía de Cali, Colombia. The mean age of the recruits was 35±5.4 years, mean± standard deviation (with range: 22 to 45 years). Institutional review board/ethics committee approval was obtained. Informed consent was obtained from all study participants. Patients had a previous diagnosis of keratoconus in both eyes on the basis of clinical features, slit lamp findings and/ corneal topographic data obtained with scanning- slit videokeratography (Orbscan II, Orbtek, Inc.) and Placido disk videokeratography (TMS-1). While mean power and posterior elevation maps were generated on Orbscan, TMS-1 was used to detect the corneal warpage taking advantage of its relative scale in the axial map. One eye of a patient was not included in analysis because the topography maps did not yield qualitative and quantitative information, due to the severity of the keratoconus.
All clinical examinations were performed by cornea specialists (MXN and CB). All Orbscan and TMS-1 examinations were performed by trained and experienced examiners. Patients wearing contact lenses were instructed to remove them at least 15 days before the videokeratographic examination.
Orbscan maps with poor central coverage were repeated to avoid BFS fitting errors. Default settings for the Orbscan BFS and curvature maps were used. A TMS-1 examination was carefully checked to ensure proper alignment of laser focusing beams and central crosshair in the center of the pupil for each examination taken. The best videokeratography for each eye was selected based on the regularity of the photokeratoscopy mires and quality of the color-coded map.
Each eye included in the study had stage I, II or III keratoconus based on the Amsler- Krumeich classification6,7. In this study, keratoconus suspects were included as stage I. Patients were excluded if corneal warpage, central corneal scarring, hydrops, and severe thinning of the cornea (300 microns or less) were present.
When we used the mean power map, we defined the cone area as the corneal zone with keratometry power more than 47 diopters. This cone area was measured from the maximum diameter (which was horizontal in all cases) using the formula
A=pi d2/4
With the posterior elevation map, the cone area was defined as the corneal zone with elevations above 50 microns, (this data was obtained by Orbscan II software).
The cone peak area was defined as the maximum keratometry power or elevation zone inside the cone area. This cone peak area was measured from the peaks maximum diameter (which followed either of horizontal or vertical meridian). The cone peak co-ordinates were obtained from the central point of this diameter (Orbscan II software). The center of the topographic map was aligned with the apex of the topography system.
Data analysis was conducted using Windows SPSS 10.0 software, mean power keratometric and posterior elevation maps were compared using t test. Statistical significance was defined as p<0.05. Correlations were assessed with Pearsons coefficient.
RESULTS
Cone area and radii were measured, the preoperative cone area for the 23 keratoconus was 17.65 mm² ± 4.63 and 35.68 mm² ± 9.72 in posterior elevation and mean power keratometric analysis respectively (p 0.00). Cone preoperative radius was 2.56 mm ± 1.20 and 3.33 mm ± 0.48 in posterior elevation and mean power keratometric analysis respectively (p 0.00).
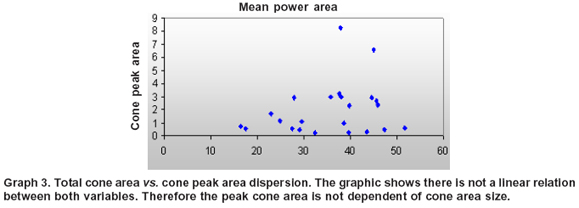
Similarly, mean cone peak area was 3.91 mm² ± 3.78 and 2.01mm² ± 2.01 in posterior elevation and mean power keratometric analysis (p 0.01). Cone Peak radius was 1.02 mm ± 0.52 and 0.71 mm ± 0.36 in posterior elevation and mean power keratometric analysis (p 0.01). The correlation coefficient between cone area and cone peak area was 0.24 in mean power keratometric analysis.
In 78% (18) of cases more than 50% of the cone was located in the central 3 mm what we will call centered cone (CC), and 22% (5) (outside this area called de-centered cone (DC), in both posterior elevation and mean power keratometric analysis. However, the cone location inside or outside the central 3 mm, matched in only 91% of cases when compared in these two different analysis. In two cases 16 and 18, when we did the analysis the cone was classified CC and with the other map was classified as DC.
Cone peak coordinates were found to be located in the inferotemporal quadrant in 81% and 63% of right eye cases in posterior elevation and mean power keratometric analysis respectively (Graph 1). Similarly, cone peak coordinates were found to be located in the inferotemporal quadrant in 83% and 66% of left eye cases in posterior elevation and mean power keratometric analysis respectively (Graph 2).
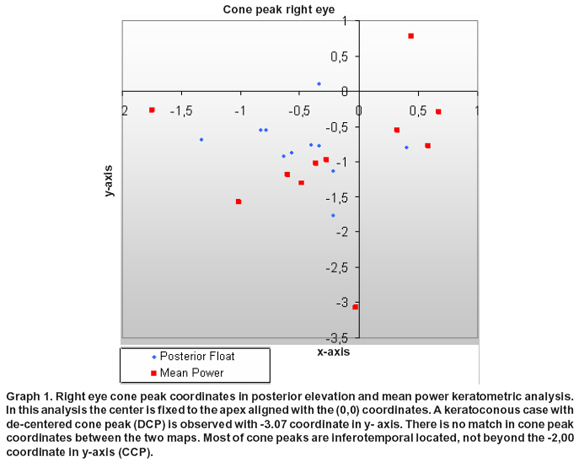
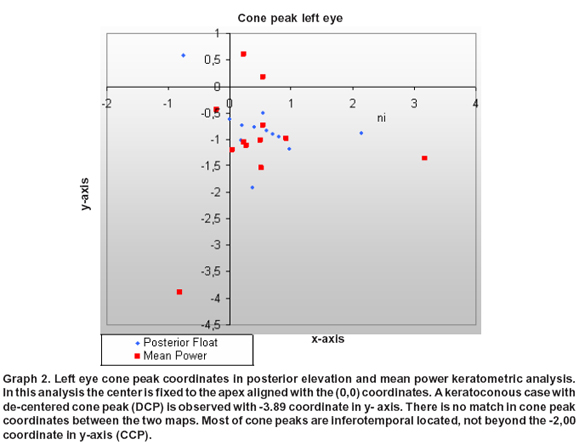
Sixty four percent of the right eye cone peaks were coincident in the same quadrant in both maps (superotemporal, inferotemporal, superonasal or inferonasal), but when the peak coordinates were compared between the two maps, they never matched for the same point (Graph 1). Fifty eight percent of the left eye cone peaks were coincident in the same quadrant in both maps (superotemporal, inferotemporal, superonasal or inferonasal), but when the peak coordinates were compared between the two maps they never matched for the same point (Graph 2).
DISCUSSION
Swanson´s nomogram assesses posterior float in relation to the central 3 mm in order to take the decision to insert symmetric or asymmetric rings. We found that, when posterior elevation maps were used to define the cone characteristics, 78% eyes with CC were prone to symmetric ICRS insertion. This figure of 78% requiring symmetric Intacs implantation remained the same when an alternative method of mean curvature maps was used to define the cone characteristics.
However, when case to case evaluation was performed, it was found that in approximately 9% of cases, the cone location with relation to the central 3 mm optical zone in the elevation map and mean power keratometric map did not match. We hypothesized that the 10% of Swanson´s cases which demonstrated unexplained absence of changes in postoperative parameters could be due to the plausible incorrect measurements of the cone using posterior elevation maps. The finding of these 9% eyes in which cone characteristics measured with mean curvature map differed so much (compared to posterior elevation maps) as to change the decision between symmetric and asymmetric Intacs implantation points in favor of the suggested hypothesis.
Mean power keratometric map was selected because in a previous study Harris et al.8 found that it was a better indicator of cone locations over tangential and axial curvature maps. Similarly Tang et al.5 demonstrated that mean power keratometric maps captures the essence of keratoconus and other corneal ectasias much better than axial and tangential power maps and therefore, are better suited to detect shape abnormalities in corneal ectasias.
Tang et al.5, discusses three advantages of using mean cuvature maps: First, it characterizes the local surfaces more completely by averaging curvatures along two principal axes at a given point on the cornea. However, it needs to be understood that mean power maps display mean surface curvature (local sphericity) scaled by the interface refractive index difference. Mean keratometric power in diopters is equivalent to local paraxial power, but is not a true optical power. Therefore, keratometric mean curvature should only be used to detect shape abnormality rather than compute corneal refractive power. This means curvature calculation is done over the whole cornea at every point independent of axial and other biases. This map is useful for determining the exact location and effect of corneal surface anomalies regardless of where they appear, because each point is independently defined. Each point is a representation of its local sphere4. Second, it captures the stretching of the surface in corneal ectasia and the stretched surface area increases in proportion to the mean curvature value.
Finally, mean curvature map is insensitive to astigmatism and therefore, gives better information about diameter, cone location and cone peak. An astigmatic surface appears relatively normal (no bowtie pattern) on mean curvature map because the curvature is averaged along the two perpendicular directions. Ectasia produces local increase in mean curvature that is not affected by astigmatism or location relative to center of the cornea9. This feature makes it easier to identify the «cone» in keratoconus using mean power keratoconus maps.
Another method10 used Zernike series decomposition to remove astigmatism from the anterior elevation maps and extract cone characteristics. It is, however, believed that the process of removing lower order Zernike terms also removes components of the cone shape and cause distortions that depend on cone location5. Therefore, mean curvature mapping is expected to remove the effect of astigmatism more cleanly without subtracting from the cone.
In our study, the statistically significant difference found between areas and radii measured by posterior elevation and mean power keratometric analysis was very well expected, because the former informs us about the posterior corneal surface in terms of elevation and the latter tells us about anterior corneal surface in terms of power. On the contrary, «cone peak» characteristics -area and radius- have been found to be larger in posterior elevation maps. The reason for this finding may lie in the micro-anatomical structure of the posterior corneal fibres, which may bulge and deform easier and earlier than the anterior corneal fibres.
In the present study 22% of the eyes with DC are suitable for asymmetric ICRS implants following Swanson´s nomogram, which suggests the implantation of the thicker segment superiorly and the thinner one inferiorly so that the superior segments acts as a pulling force, drawing the cone centrally.
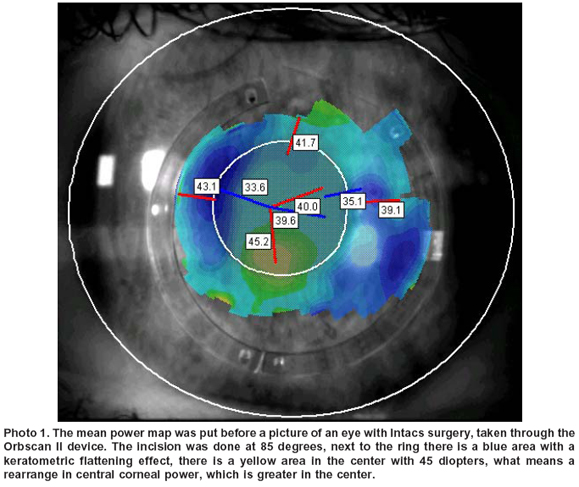
In Graphs 1 and 2, 21 cone peaks are located within -2.00 coordinate on vertical axis what we identify as centered cone peak (CCP) and the cone peaks of two cases (when measured using mean power keratometric maps) were found to be displaced inferiorly much below this vertical coordinate of -2.00 and were denoted as de-centered cone peak (DCP). Finally we have 5 DC eyes in which cases asymmetric rings will be placed, 3 with CCP and 2 with DCP. In these two situations, a different biomechanical effect is expected to work in rearranging maximum corneal power towards the centre of the optical zone. Postoperative mean power keratometric maps demonstrate a steeper central zone surrounded by a flatter circumferential zone adjacent to the inner side of Intacs rings (Photo 1). This biomechanical change keeps corneal asphericity (with a prolate tendency) as found in previous studies11,12.
There has also been reported surgical success using the thicker ring segment inferiorly and the thinner ring segment superiorly13-16 opposite to Swanson´s nomogram. Therefore we suggest that cone peak location should be taken into account to select location of thicker vs. thinner ring segments. Our hypothesis is that in DC eyes, if the cone peak coordinates are displaced far inferiorly (beyond -2.00 vertical coordinate i.e. DCP), we should place the thicker segment inferiorly and if it is located with in -2.00 vertical co-ordinates (CCP) we should place the thicker segment superiorly.
In this study the cone peaks tend to group on the temporal side of the cornea. This finding coincides with Demirbas & Pflugfelder17 results, who found that majority of cone apices on elevation displays were located in the inferotemporal quadrant.
The low correlation coefficient of 24% found between the cone area and the cone peak is corroborated by the huge data dispersion (Graph 3) and shows that the cone size is not directly or inversely proportional to the cone peak size. This confirms that both variables should be measured in the nomogram´s adjustment.
Of the 23 keratoconus eyes, 2 eyes were diagnosed with early keratoconus or keratoconus suspects since they presented topographic anomalies without slit lamp signs. When radii of all the cones were included in the calculations, mean radius was found to be 3.33 mm±0.48. However, the radii of the cones of two keratoconus suspects were 2.30 mm and 2.37 mm. similarly, mean cone area (using all the cones) was 35.68 mm² ± 9.72 and individual areas in the 2 cases of keratoconus suspects were 16.58 mm² and 17.60 mm² (Table 1). The difference in cone parameters between advanced and early keratoconus was statistically significant but was opposite to Tang et al.5 findings, who reported a mean diameter of 2.94 mm in both advanced and early keratoconus.

A prospective ICRS implantation study should be performed, measuring cone area cone peak area and location on posterior elevation and mean power keratometric maps, to determine which factors affect visual and biomechanical results.
Smolek & Klyce18 considers keratoconus as an extreme form of corneal warpage caused by lack of structural integrity brought on by stromal degeneration and external forces. Edmund19 compared the elastic modulus of normal corneas and corneas with keratoconus and found that the viscoelastic tissue properties differed. For this reason, additionally to topographic information, it may be important to measure corneal viscoelastic properties in the nomogram adjustment.
Based on the cases that not matched the cone centration, we suggest a new way to define the cone centre using the mean power keratometric map. Therefore, it should be reviewing the decisions to implant Symmetric rings vs. Asymmetric rings using posterior elevation map. A new parameter is discussed «cone peak centration» in de-centered cones (DC).
REFERENCES
1. Rabinowitz YS. Keratoconus. Surv Ophthalmol. 1998; 42: 297-319. [ Links ]
2. Turner T. What corneal topography can tell you about corneal shape. In: Customized corneal ablation: The quest for supervision. Grove Road: Slack Inc.; 2001. p. 221-7. [ Links ]
3. Cairns G, McGhee CN. Orbscan computerized topography: attributes, applications, and limitations. J Cataract Refract Surg. 2005; 31: 205-20. [ Links ]
4. Orbscan by Orbtek. Operators manual. Version 3; 1999. [ Links ]
5. Tang M, Shekhar R, Miranda D, Huang D. Characteristics of keratoconus and pellucid marginal degeneration in mean curvature maps. Am J Ophthalmol. 2005; 140: 993-1001. [ Links ]
6. Lovisolo CF, Colossi A, Ottone AC. Intrstromal inserts in keratoconus and ecstatic corneal conditions. In: Lovisolo CF, Fleming JF, Pesando PM, editores. Intracorneal ring segments. Canelli: Fabiano Editore; 2000. p. 95-163. [ Links ]
7. Alio JL, Shabayek MH. Corneal higher order aberrations: a method to grade keratoconus. J Refract Surg. 2006; 22: 539-45. [ Links ]
8. Harris JW, Roberts C, Lembach RG. Topographic characteristics of keratoconus evaluated with the orbscan slit system. Invest Ophthalmol Vis Sci. 1997; 38 (suppl): 1090. [ Links ]
9. Tang M, Shekhar R, Huang D. Mean curvature mapping for detection of corneal shape abnormality. IEEE Trans Med Imaging. 2005; 24: 424-8. [ Links ]
10. Schwiegerling J. Cone dimensions in keratoconus using Zernike polynomials. Optom Vis Sci. 1997; 74: 963-9. [ Links ]
11. Furhman M, Haji Sa, Dualan IJ, Asban PA. Intacs for keratoconus. Invest Ophthalmol Vis Sci. 2002; 43: E-Abstract 3236. [ Links ]
12. Holmes-Higgin DK, Baker PC, Burris TE, Silvestini TA. Characterization of the aspheric corneal surface with intrastromal corneal ring segments. J Refract Surg. 1999; 15: 520-8. [ Links ]
13. Colin J, Cochener B, Savary G, Malet F, Holmes-Higgin D. Intacs inserts for treating keratoconus: one-year results. Ophthalmology. 2001; 108: 1409-14. [ Links ]
14. Colin J, Cochener B, Savary G, Malet F, Holes-Higgin D. Correcting keratoconus with intracorneal rings. J Cataract Refract Surg. 2000; 26: 1117-22. [ Links ]
15. Boxer Wachler BS, Christie JP, Chandra NS, Chou BK, Nepomuseno R. Intacs for keratoconus. Ophthalmology. 2003; 110: 1031-40. [ Links ]
16. Alio JL, Shabayek MH. Intracorneal asymmetrical rings for keratoconus: where should the thicker segment be implanted? J Refract Surg. 2006; 22: 307-9. [ Links ]
17. Demirbas NH, Pflugfelder SC. Topographic pattern and apex location of keratoconus on elevation topography maps. Cornea. 1998; 17: 476-84. [ Links ]
18. Smolek MK, Klyce SD. Is keratoconus a true ectasia? An evaluation of corneal surface area. Arch Ophthalmol. 2000; 118: 1179-86. [ Links ]
19. Edmund C. Corneal elasticity and ocular rigidity in normal and keratoconic eyes. Acta Ophthalmol. (Copenh) 1988; 66: 134-40. [ Links ]

