


Serviços Personalizados
Journal
Artigo
 Inglês (pdf)
 Artigo em XML
 Referências do artigo
 Enviar este artigo por email
Indicadores
-
 Citado por SciELO
 -
 Acessos
Links relacionados
-
 Citado por Google
 -
 Similares em
SciELO
Similares em
SciELO -
 Similares em Google
Compartilhar

 Permalink
Colombia Médica
versão On-line ISSN 1657-9534
Colomb. Med. v.41 n.4 Cali out./dez. 2010
Comparison of low-density lipoprotein obtained from the Friedewald formula and new formulae in a heterogeneous population
César Augusto Guevara-Cuéllar, MD1, Claudia Patricia Criollo-Díaz, MD2, Carlos Andrés Pineda-Cañar, MD3
1. Associated Professor, Faculty of Health, Department of Family Medicine, Universidad del Valle. Professor of Family Medicine, Universidad Santiago de Cali, Cali, Colombia. e-mail: cesarguevara75@yahoo.com
2. Auxiliary Professor, Faculty of Health, Department of Family Medicine, Universidad del Valle. Professor of Family Medicine, Universidad Santiago de Cali, Cali, Colombia. e-mail: crioll200@yahoo.com
3. Assistant Professor, Faculty of Health, Department of Family Medicine, Universidad del Valle. Professor of Family Medicine, Universidad Santiago de Cali, Cali, Colombia. e-mail: capineda1@gmail.com
Received for publication July 17, 2009 Accepted for publication March 15, 2010
SUMMARY
Introduction: Although the levels of low-density lipoprotein (LDL-C) should ideally be determined by beta quantification or enzymatic methods, there are limitations in developing countries. The goal of this study is to compare LDL-C obtained through three formulae (LDL-Cnf) with LDL-C obtained through the Friedewald formula (LDL-Cf) using LDL-C through enzymatic methods as the most-accepted reference method in clinical practice (LDL-Cr).
Methods: A concordance study was carried out in a reference laboratory in Cali, Colombia. The three formulae were (mg/dl): Men with triglycerides under 400 mg/dl: LDL-C = Total Cholesterol (TC) - triglycerides (TG) /6.5) - 45; men with triglycerides equal to or greater than 400 mg/dl: LDL-C = (TC - (TG/7)) -50 and women: LDL-C = (TC-(TG /6.5)) - 70.
Results: Three-hundred fifteen values were obtained of which 53% were for women. The mean age and LDL-Cr were 54 years (±15.8) and 112.1 mg/dl (±32.5), respectively. The median (interquartile range, mg/dl) of TC, high-density lipoprotein (HDL-C) and TG were 204 mg/dl (171-229), 51 mg/dl (41-61), and 156 mg/dl (99-237), respectively. There were no differences between mean values of LDL-Cr and LDL-Cnf (113.48 vs. 112.67 mg/dl; p=0.45). The intraclass correlation coefficient among LDL-Cr and LDL-Cf and LDL-Cnf were high (R=0.93 and 0.92, respectively). The correlation between LDL-Cf and LDL-Cnf was 0.95. There is no difference between the areas under the receiver operating characteristic (ROC) curve with the level of LDL-Cr at 160 mg/dl for LDL-Cnf and LDL-Cf. (0.94 vs. 0.93; p=0.27).
Conclusion: There is high concordance between LDL-Cf and LDL-Cnf. These formulae could be an alternative when there are limitations to determine LDL-C because of the lack of enzymatic methods or through Friedewald formula due to the absence of HDL-C.
Keywords: Cholesterol; LDL-C; Direct LDL- Friedewald formula.
Comparación de lipoproteínas de baja densidad obtenidas por formula de Friedewald y nuevas fórmulas en una población heterogénea
RESUMEN
Introducción: Aunque los niveles de colesterol de lipoproteínas de baja densidad (LDL-C) deben ser determinados idealmente por betacuantificación o métodos enzimáticos, hay limitaciones en países en vía de desarrollo. El objetivo de este estudio es comparar LDL-C obtenido a través de tres fórmulas (LDL-Cnf) con LDL-C obtenido a través de la fórmula de Friedewald (LDL-Cf) usando LDL-C (LDL-Cr) enzimático considerado como referente más aceptado clínicamente.
Métodos: Se realizó un estudio de pruebas diagnósticas en un laboratorio de referencia en Cali, Colombia. Las tres fórmulas fueron (mg/dl): Hombres con triglicéridos menores de 400 mg/dl: LDL-C= Colesterol total (CT) - triglicéridos (TG)/6.5)- 45; hombres con triglicéridos iguales a o mayores de 400 mg/dl: LDL-C= (CT- (TG/7))- 50 y mujeres: LDL-C= (CT- (TG/6.5))- 70.
Resultados: Se obtuvieron 315 valores de los cuales 53% eran mujeres. El promedio de edad y LDL-Cr fueron 54 años (±15.8) y 112.1 mg/dl (±32.5), respectivamente. La mediana (rango intercuartil) de CT, lipoproteínas de alta densidad (HDL-C) y TG fueron de 204 mg/dl (171-229), 51 mg/dl (41-61) y 156 mg/dl (99-237), respectivamente. No hubo diferencia en los valores promedio de LDL-Cr y LDL-Cnf (113.48 vs. 112.67 mg/dl; p=0.45). Los coeficientes de correlación intraclase entre LDL-Cr y LDL-Cf y LDL-Cnf fueron altos (r=0.93 y 0.92, respectivamente). La correlación entre LDL-Cf y LDL-Cnf fue de 0.95. No hubo diferencias en las áreas bajo la curvas de características operativas del receptor (COR) con niveles de LDL-Cr de 160 mg/dl (0.94 vs. 093; p=0.27).
Conclusión: Existe una alta correlación entre LDL-Cf y LDL-Cnf. Estas formulas podrían ser una alternativa cuando existen limitaciones para determinar el LDL-C.
Palabras clave: Colesterol; LDL-C; LDL-directo; Fórmula de Friedewald.
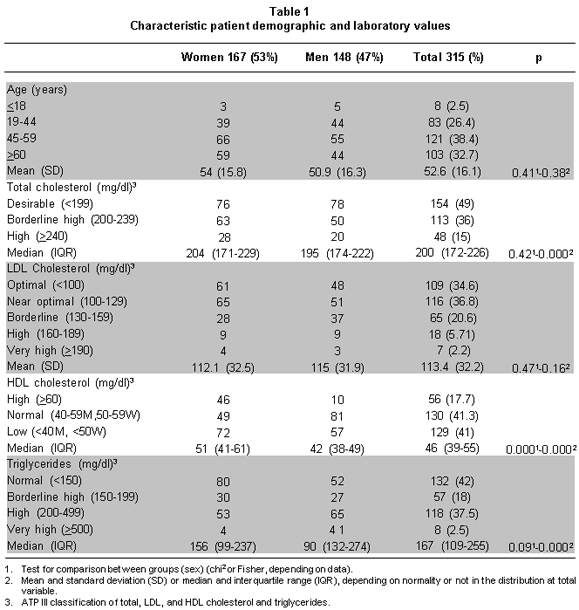
High levels of low-density lipoprotein cholesterol (LDL-C) are considered as important risk factor for cardiovascular disease and constitutes the main therapeutic target for dyslipidemia treatment. For this reason, the Adult Treatment Panel III (ATP III) recommends that the standard lipid profile should be measured in all patients 20 years of age or more every five years and stratifies the following ranges of this lipoprotein to evaluate cardiovascular risk: optimal: below 100 mg/dl; near optimal/above optimal: 100-129 mg/dl; borderline-high: 130-159 mg/dl; high: 160-189 mg/dl, and very high: >190 mg/dl1.
This lipoprotein can be determined through different methods. The Working Group on Lipoprotein Measurement (WGLM) recommended the beta quantification as the gold standard in its guide published in 1995; however, the Group has recognized that this method is expensive, unpractical, and delayed for clinical purposes. Alternative methods, such as colorimetric enzymatic methods, have been accepted as more practical than beta quantification. But accessibility to these methods is still limited. Hence, this group recommends the determination of LDL-C by means of the Friedewald formula (LDL-Cf) in many clinical scenarios; while new, practical, and accurate techniques are being developed2. The National Cholesterol Education Program (NCEP) has established that the new techniques should have a total analytical error <12%, imprecision <4% and inaccuracy <4% compared with beta quantification.
The Friedewald formula has been widely used in many epidemiological studies that have established the close relation between LDL-C elevated levels and cardiovascular risk. It is currently the main method in determining these levels in clinical scenarios. This formula can not to be used in the presence of chylomicron triglyceride concentration exceeding 400 mg/dl or type III hyperlipidemia; several studies have shown its inaccuracy in patients with diabetes3, hepatopathies, and nepropathies4. Although this formula has several limitations, the NCEP recommends it because of its low costs, accessibility, and ease of use1.
Difficulties in accessing health care have been considered factors that could increase the risk of poor cardiovascular outcomes. This could be because precarious care hinders a real estimation of cardiovascular risk, especially in people from low socioeconomic levels in developed countries, but factors such as race, nutrition, and age play significant roles5-7.
This phenomenon could be more accentuated with individuals without healthcare insurance coverage in developing countries, where a significant proportion of the population has no access to health care services. However, no studies have established this association in these countries. Within this limited scenario, a strategy could be useful to determine LDL-C values based only on cholesterol and triglycerides. Therefore, it is imperative to develop alternative ways of determining LDL-C in people with barriers to health care services.
The goal of this study is to correlate LDL-C values obtained by enzymatic methods (LDL-Cr) to LDL-C values obtained by means of new formulae (LDL-Cnf), based on levels of total cholesterol and triglycerides.
METHODS
The new formulae were obtained by means of a data mining procedure using total cholesterol (TC) values, high-density lipoprotein cholesterol (HDL-C), triglycerides (TG), and low-density lipoprotein (LDL-C) obtained via the Friedewald formula. Several options of formulae that only included TC and TG were obtained and evaluated for the Pearson correlation with LDL-Cf using Excel 2007 (Microsoft®). Those formulae with moderate or high Pearson correlation were accepted (r >0.80) for proof. Additionally, correction factors were applied to minimize differences between LDL-Cf and LDL-Cnf. Thus, three different formulae were obtained:
. Men with triglycerides under 400 mg/dl
. LDL-C (mg/dl) = (TC (mg/dl) - TG (mg/dl) /6.5) -45
. Men with triglycerides equal to or greater than 400 mg/dl
. LDL-C (mg/dl) = (TC (mg/dl) - TG (mg/dl)/7) -50
. Women
. LDL-C (mg/dl) = (TC (mg/dl) - TG (mg/dl)/6,5) - 70
Subsequently, these formulae were evaluated with LDL-Cr values in a reference laboratory in Cali, Colombia. We took some registers from January 2008 to March 2009 that only included sex, age, and CT, HDL-C, TG, and LDL-Cr levels. Registers not including any of these variables were excluded. The levels of LDL-Cr were determined by using direct enzymatic methods. In this laboratory, blood samples are obtained in the morning after 12 hours of fasting, according to the protocol Manual of Laboratory Operations and Standardization program for Lipid Measurement.
This study was approved by the Institutional Review Board at Universidad del Valle in Cali, Colombia.
The statistical analysis was carried out by using STATA v.10. The univariate analysis included proportion for categorical variables, means with standard deviation, and median with interquartile range for numeric variables according to distribution and statistical requirements. Global and stratified Pearson coefficients for women and men with TG greater to or equal to 400 mg/dl and men with TG under 400 mg/dl were obtained to estimate correlation among LDL-Cr, LDL-Cf, and LDL-Cnf. The intraclass correlation coefficient between LDL-Cr and LDL-Cnf was determined with a confidence interval of 95%. After verification of statistical assumptions and in accordance with the distribution, the paired t test was carried out to compare the values of LDL-C as determined by the different formulae. The comparison of medians was carried out by means of the Wilcoxon signs test. To estimate the performance of these formulae a curve of receptor operative characteristics (ROC) was obtained with a cut off point at 160 mg/dl (mg/dl).
RESULTS
Three-hundred fifteen registers were collected. There were 167 (53%) females and 148 (47%) males. The average age was 54 years (±15.8) and 50.9 years (±16.3), respectively. Table 1 shows demographics and laboratory values according to gender. There were no differences regarding age, TC, LDL-Cr, and TG between women and men, but there were differences in HDL-C. TC, HDL-C and TG exhibited non-normal distribution in the sample.
LDL-C levels obtained through enzymatic methods, the Friedewald formula, and new formulae are shown in Table 2. There was no difference between the mean of LDL-C obtained through different methods. In relation with relative errors shown in Table 3, it is important to note a narrow dispersion between LDL-Cr - LDL-Cnf (IQR=-0.112 – 0.092) and LDL-Cf-LDL-Cnf (IQR=-0.098 - 0.095). The two relative errors were lower than the 0.012 recommended by the WGLM. There were no statistical differences between the relative errors.
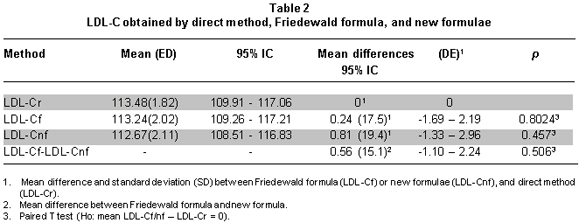
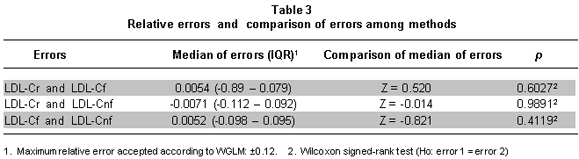
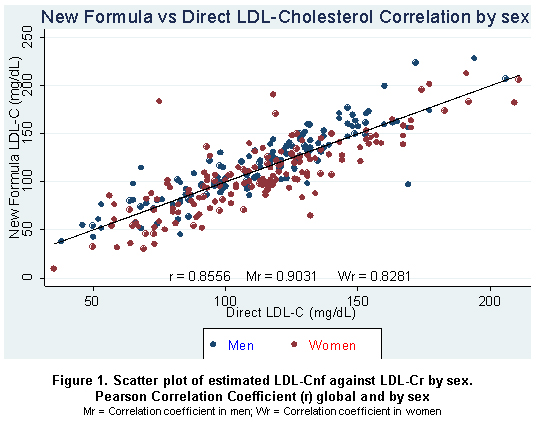
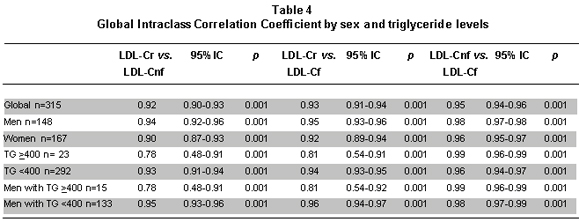
Figure 1 shows a scatter plot of estimated LDL-Cnf against global LDL-Cr global discriminated by sex. Additionally, Table 4 shows these discriminated intraclass correlation coefficients by sex and triglyceride levels greater than or equal to 400 mg/dl and under 400 mg/dl. Both LDL-Cf and LDL-Cnf showed regular correlation at TG levels equal to or greater than 400 mg/dl. Moreover, there was no significant number of observations in this range. The intraclass correlation coefficient between LDL-Cr and LDL-Nf was 0.917 (95% CI: 0.896-0.933; F: 11.98, p<0.001) and between LDL-Cr and LDL-Cf it was 0.929 (95% CI: 0.912-0.943; F: 14.10, p<0.001).
Statistical differences among different correlation coefficients were established by dependent correlations using the formula developed by Hotelling and Glass-Stanley. This test did not show statistical differences between r(rLDL-fLDL) and r(rLDL-nfLDL); (t=0.637 F: 0.318 p=0.728).
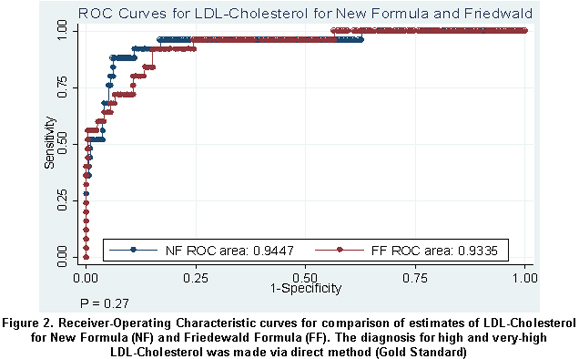
Figure 2 shows an ROC curve between LDL-Cf and LDL-Cnf at the cut off point of 160 mg/dl using LDL-Cr as the gold standard. In this graph there is no difference in the areas under the ROC curve in the two methods described initially.
DISCUSSION
Cardiovascular disease constitutes an important burden for public health today, suggesting a transition in the epidemiological profile in these countries.
In a recent study, the World Health Organization (WHO) estimates that cardiovascular disease is the leading cause of death in the world, particularly among women; such disease caused almost 32% of all deaths in women and 27% in men in 20048. This scenario calls for improving the approach and characterization of cardiovascular risk in the patients.
Although there is consensus about the importance of the accurate determination of LDL-C levels through enzymatic methods, especially in most patients with high cardiovascular risk, there are many barriers and limitations in developing countries to access this technology, particularly in low socioeconomic sectors. Development of alternatives and cheaper formulae can contribute to determining levels of this lipoprotein in individuals with limited economic resources.
Despite the fact that this study was developed by using the database from a reference center, it is remarkable that there is a predominance of women, who are the predominant sex representing 51.2% versus 48.8% in Colombia9. Regarding age, there is majority of adults above 45 years of age (71.1%) who are the most affected group in Colombia with dyslipidemia, hypertension, and diabetes mellitus, requiring strict monitoring or screening via this test10.
Considering the population of this study in a reference center, where a vast number of patients are expected to have multiple co-morbidities, 49% of TC values are optimal. One possibility is that these patients had been taking medications (e.g., statins or fibrates) or therapeutic changes in the life style have followed once the test had been carried out and these factors helped in reaching this goal.
The absence of these variables (co-morbidities and medications) represents a limitation to this study. Regarding HDL-C, 41% of the patients had low levels of this lipoprotein according to sex, 41.3% had normal levels, and 17.7% had high levels. Although there are statistically significant differences between men and women, the proportion of low levels of HDL-C was very similar (43.1% versus 38.5%). This result contrasts with those obtained in the 2005 National Survey of Demographics and Health, where 58.9% and 62.8% of the general population in Valle del Cauca and Colombia had HDL-C levels under 40 mg/dl, respectively; likewise, there are differences in the proportion of HDL-C values above 60 mg/dl from this study with those populations (17.7% versus 4.9% and 4.5%, respectively)10. These differences could be explained by the kinds of samples utilized in each study. Also, the proportion of patients with better values in this study in comparison with others probably reflects non-pharmacological and pharmacological interventions, but this can not to be established. Thus, there is no significant statistical difference in triglyceride levels between men and women. Nevertheless, one limitation of this study is the reduced number of patients with triglyceride levels over 400 mg/dl (7.3%), which hindered evaluating the performance of the new formulae in this range. The most frequently observed LDL-Cr levels were those under 130 mg/dl (71.4%) and did not show statistically significant differences; however, there were a reduced number of observations over 160 mg/dl (7.9%). Nevertheless, the strength of this study is that the distribution of the variables and selection of patients in a reference center increase the probability of it being a heterogeneous sample including a broad spectrum of patients.
The contrast of hypothesis did not show differences in relation to the mean, just as there are no differences in the medians of the errors relative to the different estimations. It is important to emphasize that the relative error obtained from the new formulae was less than the 12% recommended by WGLM but there was a wide dispersion (-0.07% IQR: (-0.112 – 0.092) however, the error shown by the Friedewald formula was similar (median: -0.07% and SD: ±17.3%). These results contrast with those of other studies that have demonstrated that the Friedewald formula exhibits errors ranging from 4.7% to 63.6%, depending on triglyceride levels11-14.
Moreover, the area under the ROC curves showed a similar performance for the Friedewald formula and the new formulae at cutoff values of 160 mg/dl. This cutoff value was chosen because it represents the limit of high levels according to ATP III.
Although the use of these new formulae could represent an alternative and economic way to determine LDL-C levels in deprived contexts, a cost-efficiency analysis is out of the scope of this study. Moreover, it is necessary to establish the accuracy of these formulae in other populations and to evaluate the performance with triglycerides and LDL-Cr levels over 400 mg/dl and 130 mg/dl, respectively.
Conflict of interest. None of the authors has conflicts of interest related to this study.
ACKNOWLEDGEMENTS
We thank Luz Edith Zamora for her support with the database from Laboratorios Ángel.
REFERENCES
1. Executive Summary of the Third Report of the National Cholesterol Education Program (NCEP) Expert Panel on Detection, Evaluation, and Treatment of High Blood Cholesterol in Adults (Adult Treatment Panel III). JAMA. 2001; 285: 2486-97. [ Links ]
2. Working Group on Lipoprotein Measurement. Recommendations on lipoprotein measurement. Bethesda: National Institute of Health, National Heart, Lung and Blood Institute; 1995. [ Links ]
3. Hirany S, Li D, Jialal I. A more valid measurement of low-density lipoprotein cholesterol in diabetic patients. Am J Med. 1997; 102: 48-53. [ Links ]
4. Akanji AO. Direct method for the measurement of low-density lipoprotein cholesterol levels in patients with chronic renal disease: a comparative assessment. Nephron. 1998; 79: 154-61. [ Links ]
5. Rooks RN, Simonsick EM, Miles T, Newman A, Kritchevsky SB, Schulz R, Harris T. The association of race and socioeconomic status with cardiovascular disease indicators among older adults in the health, aging and body composition study. J Gerontol B Psychol Sci Soc Sci. 2002; 57: S247-56. [ Links ]
6. Rooks RN, Simonsick EM, Klesges LM, Newman AB, Ayonayon HN, Harris TB. Racial disparities in health care access and cardiovascular disease indicators in black and white older adults in the Health ABC Study. J Aging Health. 2008; 20: 599-614. [ Links ]
7. Vorster HH, Kruger A. Poverty, malnutrition, underdevelopment and cardiovascular disease: A South Africa perspective. Cardiovasc J Afr. 2007; 18: 321-4. [ Links ]
8. Global Burden of Disease Update 2004. World Health Organization [online] 2004. Available: http://www.who.int/healthinfo/global_burden_disease/GBD_report_2004update_part2.pdf [ Links ]
9. Censo de Colombia. Departamento Administrativo de Estadística DANE [online] 2005.. Available: http://www.dane.gov.co/files/censo2005/gene_15_03_07.pdf [ Links ]
10. Encuesta Nacional de Demografía y Salud 2005-2006. Ministerio de la Protección Social [online]. 2005.. Available: www.colciencias.gov.co/portalcol/downloads/archivosSoporteConvocatorias/1509.pdf [ Links ]
11. Córdova CM, Schneider CR, Juttel ID, Córdova MM. Comparison of LDL-cholesterol direct measurement with the estimate using the Friedewald formula in a sample of 10,664 patients. Arq Bras Cardiol. 2004; 83: 482-7. [ Links ]
12. Teerakanchana T, Puavilai W, Suriyaprom K, Tungtrongchitr R. Comparative study of LDL-cholesterol levels in Thai patients by the direct method and using the Friedewald formula. Southeast Asian J Trop Med Public Health. 2007; 38: 519-27. [ Links ]
13. Eblen-Zajjur A, Eblen-Zajjur M. Estimation of low density lipoprotein cholesterol concentration: regression analysis versus Friedewalds formula. Rev Med Chil. 2001; 129: 1263-70. [ Links ]
14. Charuruks N, Milintagas A. Evaluation of calculated low-density lipoprotein against a direct assay. J Med Assoc Thai. 2005; 88 Suppl 4: S274-9. [ Links ]

