


Serviços Personalizados
Journal
Artigo
 Inglês (pdf)
 Artigo em XML
 Referências do artigo
 Enviar este artigo por email
Indicadores
-
 Citado por SciELO
 -
 Acessos
Links relacionados
-
 Citado por Google
 -
 Similares em
SciELO
Similares em
SciELO -
 Similares em Google
Compartilhar

 Permalink
Colombia Médica
versão On-line ISSN 1657-9534
Colomb. Med. v.42 n.1 Cali jan./mar. 2011
Analysis of the spatial and temporal distribution of birth defects between 2004-2008 at a third-level hospital in Cali, Colombia*
Daniel Elías Cuartas, Geographer1, Yoseth Ariza, MD1, Harry Pachajoa, MD2, Fabián Méndez, MD, PhD3
* This research was financed in part with resources from the Departamento Administrativo de Ciencias, Tecnología e Innovación (COLCIENCIAS), project code: 110634319204 and by Universidad del Valle, Cali, Colombia.
1. Group of Epidemiology and Population Health, School of Public Health, Faculty of Health, Universidad del Valle, Cali, Colombia. e-mail: decuartas@grupogesp.org, yariza@groupgesp.org
2. Group of Congenital Malformations, Department of Morphology, Faculty of Health, Universidad del Valle. Professor, Biomedial Sciencies, Faculty of Health Sciences, Universidad Icesi, Cali, Colombia. e-mail: hmpachajoa@icesi.edu.co
3. Professor, School of Public Health. Director, Group of Epidemiology and Population Health, Faculty of Health, Universidad del Valle, Cali, Colombia. e-mail: fmendez@grupogesp.org
Received for publication February 2, 2010 Accepted for publication May 25, 2010
SUMMARY
Objective: To describe the spatial and temporal distribution of major birth defects and to identify clusters at spatial, temporal and space-temporal levels.
Methods: A descriptive study was developed about the space and time distribution of defects registered in Cali between March 2004 and October 2008 using principles of spatial statistics, namely the spatial data exploratory analysis.
Results: Higher case density and prevalence was observed among neighborhoods of eastern Cali. Three districts («communes») of the 21 in the city showed a larger probability (50 to 100% larger) of major birth defects. Significant clusters (p<0.05) were proven in spatial, temporal and space-temporal analysis.
Conclusions: Birth defects were confirmed clustered in several communes at the poorest areas of the city. Occurrence of defects in this area may be associated, at least in part, to social and environmental inequities.
Keywords: Birth defects; Cluster analysis; Social inequity; Environmental risks.
Colomb Med. 2011; 42: 9-16
Análisis de la distribución espacial y temporal de los defectos congénitos registrados entre 2004 y 2008 en un hospital de tercer nivel en Cali, Colombia
RESUMEN
Objetivo: Describir la distribución espacial y temporal de los defectos congénitos mayores e identificar si existe agregación espacial, temporal y espacio-temporal.
Métodos: Se desarrolló un estudio descriptivo de la distribución espacial y temporal de los defectos congénitos registrados en Cali, Colombia, entre marzo de 2004 y octubre de 2008 utilizando los principios de la estadística espacial, específicamente del análisis exploratorio de datos espaciales.
Resultados: Se identificaron zonas en el oriente de Cali donde se presenta una mayor densidad y prevalencia de casos. Tres comunas de las 21 de la ciudad, presentaron una mayor probabilidad (entre 50% y 100% más alta) de presentar ocurrencia de defectos congénitos mayores y se comprobó con significancia estadística (p<0.05) la existencia de conglomerados espaciales, temporales y espacio-temporales.
Conclusiones: Se demostró la existencia de conglomerados de defectos congénitos en varias comunas ubicadas en las zonas más pobres de la ciudad. La ocurrencia de los defectos en esta zona podría estar asociada, al menos en parte, con inequidad social y ambiental.
Palabras clave: Anomalías congénitas; Análisis por conglomerados; Inequidad social; Riesgos ambientales.
Colomb Med. 2011; 42: 9-16
Since the 1990s, birth defects (BDs) are the main cause of child mortality in the United States.1 In Valle del Cauca and Colombia, they have been the second cause of mortality among children since 19942,3 for which there is growing interest in understanding the individual and collective factors that determine their distribution.
Several epidemiological surveillance programs of BDs are being carried out in the world to describe the prevalence, identify the occurrence of clusters, and contribute in the search for their causes. In Europe, several of these registers function within the EUROCAT4 and the Spanish Collaborative Study on Congenital Malformations (ECEMC for its name in Spanish)5. In Latin America there are various registers, the Cuban Register on Congenital Malformations (RECUMAC for its name in Spanish), the Costa Rican Register on Congenital Malformations, the Mexican System of Epidemiological Surveillance on External Congenital Malformations (RYVEMCE for its name in Spanish), and the Latin American Collaborative Study on Congenital Malformations (ECLAMC for its name in Spanish), which covers most of South America6.
In 1967, ECLAMC began in Argentina and included Colombia during different periods. Since 2001, several cities in Colombia have contributed information to the Latin American Study without interruption7,8. Initially, in the city of Bogotá9, then in Manizales and Ubaté, and since March 2004, in the city of Cali at Hospital Universitario del Valle (HUV)10. During the time ECLAMC has been operating in the HUV in Cali, it has been identified that the occurrence of various types of BDs surpasses the indicators observed in other similar hospitals in Latin America.
Particularly, some of those BDs could be explained, at least in part, by exposure to teratogenic agents in the environment11,12. The environmental conditions of the locations, experiences, and spatial relationships established (vicinity, displacement, connectivity, distance, affinity for specific places) are closely related to the distribution of an event in health13. To know the pattern how BDs are distributed may contribute to identifying risk factors for the population. The purpose of this study was to describe the spatial and temporal distribution of major BDs and identify if they are spatially, temporally, and spatially/temporally aggregated to explore the relationship between environmental factors and the occurrence of the defects.
METHODS
A descriptive study was developed of the spatial and temporal distribution of the BDs registered at the HUV between March 2004 and October 2008. The data was collected by the surveillance system for congenital malformations at HUV, which follows the ECLAMC methodology.
Specifically, the collection of the information of cases was carried out by the physician in charge of daily evaluations of all intra-hospital newborns, according to the description recommended by the ECLAMC operational manual 2002 version. According to this manual, a case was defined as every live or stillbirth newborn weighing e»500 grams attended at HUV, with the presence of one or more major congenital defect upon physical exam during the first 24 hours after birth6. Major BD was defined as every defect in which the normal function of an organ or system is affected and may lead to the cause of death. In comparison, a minor BD, was defined as every defect in which the compromise is merely aesthetic, and were not considered in the analysis14.
The case report forms for all major BDs were entered into a digital data base and were spatially located with the aid of a Geographic Information System (GIS). In particular, the cases were located on the intersection of the two roads of the address where the mother was living at the moment of giving birth. The prevalence was estimated for each analysis spatial unit (commune) based on the total number of births occurring in the commune during the period and its distribution was charted by quartiles. Thereafter, applying the principles of spatial statistics an Exploratory Analysis of Spatial Data (EASD) was developed to describe and visualize the distribution of the BDs, identify atypical localizations, patterns of spatial association, and the spatial structures of the distribution15,16.
Specifically, the EASD developed included:
- Case density analysis. This interpolation technique employs all the cases of major BDs (476), explores the distribution of points or cases of CD, converting it into a continuous surface of risk for the occurrence16, upon defining a 1-km radius; given that it is an initial exploratory technique, it does not calculate prevalence nor any type of adjustment (fit). ArcGis software17 was used for this analysis and mapping.
- Analysis of spatial tendency. The charted representation (maps) describes the spatial behavior of the prevalence of BDs in the geographic units (communes) making up the study area, through quantiles maps18. The ArcGis software was also used for the mapping.
- Analysis of spatial association. Through the calculation of the Moran Index, we were able to evaluate the existence of spatial self-correlation of the prevalence of CD cases to identify the coincidence of high or low values among neighboring areas18,19. Specifically, a Moran Index equal to one is interpreted as a perfect spatial self-correlation, and an Index of zero implies the total lack of correlation in the distribution of the cases. With the Moran Index we estimate the degree of spatial interaction among the different spatial units (communes), which expresses how changes of the variable in a spatial unit affect neighboring spatial units. Open-access Geoda20 and Sigepi21 software were employed for analysis.
- Spatial concentration analysis. With Moran's Local Index this technique examined the presence of clusters of outliers of major BDs prevalence around each geographic unit (commune) and conducted an evaluation of the statistical significance of the hypothesis of the dissimilarity between a commune and external values around such18. Open-access Geoda20 and Sigepi21 software were employed for analysis and ArcGis for the mapping.
- Clusters analysis. To perform this analysis, the «scan» statistical technique was used, where a circular window scans the whole area of study in search of clusters16,22. To carry out the temporal and spatial-temporal analysis, we used the dates of conception of the cases, and the number of live births per commune. Open-access Satscan software23 was used for this analysis, employing the scan technique for the whole area through circles that can include different groups of neighboring spatial units (communes). The technique compares the probability of the existence of a cluster within each circle against the probability of occurrence of the event outside of it, and estimates the likelihood function. The circle with the maximum value of likelihood is considered a cluster16.
This exploratory analysis kept in mind two complementary aspects to address the geographic variation: visual interpretation and analysis of patterns. The first furnished information on the spatial distribution and the latter evaluated the statistical significance of such distribution9.
Surveillance of congenital disorders at HUV is conducted under the approval and guidelines from the hospital and University ethics committees; the mothers sign the respective informed consent forms.
RESULTS
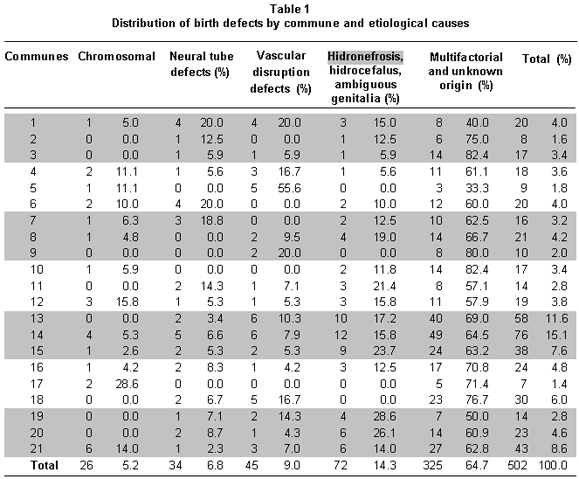
During the study period, a total of four years and seven months between 2004 and 2008, 32,995 births were attended, of which 735 presented at least one major CD and among them, 505 resided in the city of Cali. Based on information from the mother's address at the moment of giving birth, it was possible to locate 99.4% (502) of the cases with major BDs. Of these, only 5.2% (26 cases) could be classified of chromosomal origin (including syndromes like Down, Patau, Turner, Edwards, Karyotype 45X), another 30.1% (151 cases) includes defects of possible environmental origin (vascular disruption disorders, neural tube disorders, hydronephrosis, hydrocephalus, and ambiguous genitalia), and the remaining 64.7% (325 cases) could result from a combination of the previous factors or from unknown origin (Table 1).
The EASD used 94.8% (476) of the cases of major BDs (excluding cases of chromosomal origin) in which the visual interpretation of the geographic variation was developed with the case-density analysis (Figure 1). In particular, we identified areas in which there were concentrations of cases or «hot spots», mainly in the eastern side of the city, corresponding to communes 13, 14, 15, 16, and 21 in the District of Aguablanca, one of the areas of the city with the poorest socioeconomic condition. Additionally, we identified other two zones with concentrations of cases in communes 18 and 20 in the western side of Cali, which are part of another poor sector in the city, known as «the hillside».
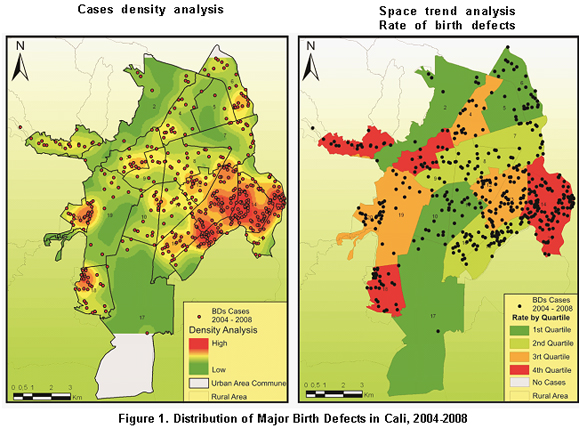
To identify the characteristics of the spatial distribution of the major BDs, we used tendency analysis techniques and evaluations of the spatial association and concentration. In the spatial tendency analysis (Figure 1), the four ordered categories of prevalence per commune are represented by using colors from green, for communes with prevalence in the lowest 25% (first quartile), to red in those communes with prevalence in the highest 25% (fourth quartile). The spatial tendency represented showed that communes with the highest prevalence values (fourth quartile) were communes 1, 3, 14, 18, and 21 and that communes (4, 12, 13, 19, and 20) with medium-high values (third quartile, in orange) are mostly neighboring communes or are proximal to those from the fourth quartile. In summary, based on the visual interpretation of the density and tendency analyses, it was noted that the cases and prevalence were concentrated in the same specific areas in the eastern and western sides of the city.
The analysis of spatial association permitted estimating a Moran Index of 0.02 for prevalence per commune, suggesting a positive spatial self-correlation (interaction) but weak in comparison to the Moran Index for the number of cases per commune, which was of 0.46. In other words, a low Moran Index for prevalence was interpreted as a low degree of spatial dependence, where the variations in prevalence in a commune do not affect the prevalence in neighboring communes.
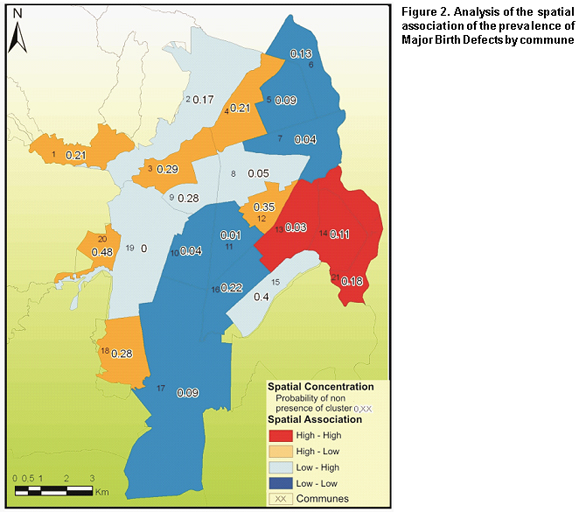
The global Moran Index informs the spatial interrelation or dependence of the variable, but it does not show the existence of clusters. In contrast, the spatial concentration analysis identified communes with high values of BD prevalence, which neighbor other communes with equally high prevalence values. For commune 13, in particular, it was found that such prevalence distribution per commune could not be randomly explained (p=0.03). Additionally, we estimated that in communes 13, 14, and 21 there was an 82% greater probability of spatial aggregation of major BDs (Figure 2). In these communes, the BD of possible environmental origin represented 10.7% (n=51) of the cases; although those of chromosomal origin were not used in the spatial distribution analysis, they only accounted for 2.1% (n=10) of all the cases localized in the city.
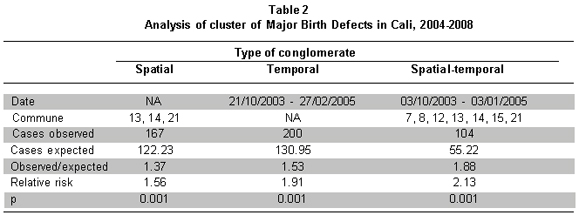
Complementarily, the analysis of clusters (Table 2) confirmed the presence of spatial, temporal, and spatial-temporal clusters in the BD distribution in Cali. We were able to confirm the existence of a spatial cluster of major BDs in communes 13, 14, and 21 (Relative risk (RR)=1.56, p=0.001) in which we observed 167 cases while only 122 would be expected by chance. This finding indicates that between March 2004 and October 2008, pregnant women from these communes had a 56% higher risk of occurrence of major BDs, than other pregnant women in the city. Additionally, the occurrence of a time cluster was identified between 21 October 2003 and 27 February 2005 (RR=1.91, p=0.001) along with a spatial-temporal conglomerate in communes 7, 8, 12, 13, 14, 15, and 21 between 03 October 2003 and 03 January 2005 (RR=2.13, p=0.001).
DISCUSSION
A spatial cluster is a significant aggregation of events that cannot be explained by chance13. This article describes the spatial and temporal distribution of major BDs in Cali and identifies the spatial, temporal, and spatial-temporal aggregations in the search for possible clusters. Based on records at HUV in Cali, it was possible to show evidence that during the period of analysis between 2004 and 2008 pregnant women from three communes (13, 14, and 21) presented a statistically significant increased risk, in comparison to all other pregnant women in the city. Additionally, during almost a year, around 2004, an area of the city (which also includes communes 13, 14, and 21) presented a spatial-temporal cluster in which the women had more than double the risk.
These results agree with those obtained in two previous studies11,12, which identified the occurrence of a temporal and spatial cluster of sirenomelia and cyclopia in the city of Cali. Those reports showed that three out of four cases of sirenomelia lived in commune 14 and that one of the four cases of cyclopia was located in commune 21; thereby, in total four of the eight cases were located in the communes where this study identified a spatial cluster of major BDs.
A study published in 2002 by the Department of Environment and Health from the State of Colorado (USA) estimated that 7%-10% of all CD in that area were explained by environmental factors; while multifactorial inheritance (combination between environmental and genetic factors) explained 20 to 25%; and unknown causes explained between 50 and 60%24. Nevertheless, in countries with low resources it is possible that the weight of environmental factors associated to place of residence in contaminated microenvironments may be higher than that referred to in wealthier countries.
Likewise, Barten25 suggests that, currently, rapid urbanization processes in cities bring concentration of poverty with health inequities affecting marginal communities, as is the case with communes 13, 14, and 21 in the city of Cali. These communes show poorly planned accelerated growth, with poor populations mainly displaced from the Pacific coast and the southern Departments of Colombia (Cauca, Nariño, and Putumayo)26. These communes represent 12% of the city's total area, and 20% of the city's population (420,722 inhabitants)27, which mostly belong to the lowest socioeconomic levels (1 and 2). While 26% of all city births (5,528 births in 2006) occur on these communes, 35% (167) of the major BDs are born in this area.
The distribution of BD types according to possible causes shows a low occurrence of those of chromosomal origin, and greater prevalence of disorders of possible environmental, multifactorial, or unknown origin. Local conditions with accelerated urbanization, and high occurrence and aggregation of the major BDs in some areas of the city, suggest that the greater risk for pregnant women from these communes could be the result of inequities in health (environmental and social), product of a complex interaction among environmental and social conditions, and behaviors, which expose the most susceptible women during child-bearing age to teratogenic agents in the places they inhabit. The possible sources of contaminants and the routes of exposure are currently being studied for the purpose of evaluating hypotheses that explain the occurrence of major BDs.
In summary, this article provides evidence of a significant cluster of BDs in an area of the city. Although this study did not seek to asses social inequities and their relationship with BDs it was able to indirectly establish that the poorest areas are the ones with the highest occurrence of BDs, making it necessary to have further studies to evaluate how social inequity could increase the exposure to contaminants and increase the susceptibility of the population.
ACKNOWLEDGMENTS
We thank the ECLAMC members who with valuable work conduct the surveillance of birth defects in the city of Cali.
Conflict of interest. The authors declare having no conflict of interest with the institution supporting the research or with where the research was conducted.
REFERENCES
1. Honein M, Kirby R, Meyer R, Xing J, Skerrette N, Yuskiv N, et al. The association between major birth defects and preterm birth. Matern Child Healt J. 2009; 13: 164-75. [ Links ]
2. Fernández N, Zarante I. Prevalencia y escala pronóstico para malformaciones congénitas en Colombia: La responsabilidad de pediatras y neonatólogos. Registro de 54.397 nacimientos. Rev Soc Colomb Neonatol UCIN. 2007; 7: 28-32. [ Links ]
3. Instituto Geográfico Agustín Codazzi. Atlas de salud. Bogotá: Imprenta Nacional de Colombia; 2008. [ Links ]
4. Eurocat Working Group. Surveillance of congenital anomalies 1980-1988. Eurocat Report N° 4. Brussels: Department of Epidemiology, Catholic University of Louvain; 1991. [ Links ]
5. Bermejo E, Cuevas L, Mendioroz J, Martínez Frías ML. Vigilancia epidemiológica de anomalías congénitas en España, en los últimos 24 años. Rev Dismorfol Epidemiol. 2004; 5: 57-82. [ Links ]
6. Castilla E, Orioli I. The Latin-American Collaborative Study of Congenital Malformations (ECLAMC). Community Genet. 2004; 7: 76-94. [ Links ]
7. Castilla EE, Orioli IM. Estudio Colaborativo Latinoamericano de Anomalías Congénitas (ECLAMC/MONITOR). Interciencia. 1983; 3: 271-8. [ Links ]
8. López-Camelo SJ, Orioli IM. Heterogeneous rates for birth defects in Latin America: hints of causality. Genet Epidemiol. 1996; 13: 469-81. [ Links ]
9. Zarante I, Castillo MC, García N, Suárez F, Gutiérrez CA, Umaña A. Análisis clínico epidemiológico de factores asociados a malformaciones congénitas ECLAMC-Hospital San Ignacio, junio-diciembre de 2001. Vniversitas Med. 2002; 43: 121-7. [ Links ]
10. Pachajoa H, Saldarriaga W, Isaza C. Gastrosquisis en un hospital de tercer nivel de la ciudad de Cali, Colombia durante el período marzo 2004 a febrero 2006. Colomb Med. 2008; 39: 35-40. [ Links ]
11. Castilla EE, Mastroiacovo P, López-Camelo JS, Saldarriaga W, Isaza C, Orioli IM. Sirenomelia and cyclopia cluster in Cali, Colombia. Am J Genet A. 2008; 146A: 2626-36. [ Links ]
12. Orioli IM, Mastroiacovo P, López-Camelo JS, Saldarriaga W, Isaza C, Aiello H, et al. Cluster of sirenomelia in South America. Birth Defects Res A Clin Mol Teratol. 2009; 85: 112-18. [ Links ]
13. Ministério da Saúde do Brazil, Fundação Oswaldo Cruz. Série: Capacitação e actualização em geoprocessamento em saúde. Abordagens espaciais na saúde pública. Vol 1. Brasilia: Ministério da Saúde; 2006. [ Links ]
14. Pinto P. Malformaciones congénitas. Bogotá: Ediciones Uninorte; 1998. [ Links ]
15. Anselin L. The future of spatial analysis in the social sciences. Ann GIS. 1999; 5: 67-76. [ Links ]
16. Ministério da Saúde do Brazil, Fundação Oswaldo Cruz. Série: Capacitação e actualização em geoprocessamento em saúde. Introdução à estadística espacial para a saúde pública. Vol 3. Brasilia: Ministério da Saúde; 2007. [ Links ]
17. ArcGis. Versión 9.3.1. ESRI. 2009. [ Links ]
18. Chasco C. Análisis estadístico de data geográficos en geomarketing: el programa GeoDa. Revista Distribución y Consumo. 2006: 131; 35-45. [ Links ]
19. Organización Panamericana de la Salud. Sigepi manual de usuario. (Manual in internet). versión 1.23. 2003 (date of access 25 June 2007). Available in: http://ais.paho.org/sigepi/index.asp?xml=sigepi/soporte.htm. [ Links ]
20. Anselin L. Exploring spatial data with GeoDa: A workbook. (Manual in internet). Illinois: 2005 (date of access 14 July 2008) Available in: http://sal.uiuc.edu/. [ Links ]
21. Sigepi. Versión 1.0. Organización Panamericana de la Salud. Ginebra: OPS/OMS; 2004. [ Links ]
22. Kulldorff M. SaTScan User Guide. (Manual in internet). 2009 (date of access 23 May 2009) Available in http://www.satscan.org/. [ Links ]
23. Satscan. Versión 8.0. Kulldorff M. Harvard Medical School Information Management Services Inc. 2004. [ Links ]
24. Colorado Department of Public Health and Environment. Analysis of birth defect data in the vicinity of the redfield plume area in the southeast Denver County: 1989-1999. Denver; 2002. [ Links ]
25. Barten F, Flores W, Hardoy A (eds). La inequidad en salud: Hacia un abordaje integral. Buenos Aires: IIED-América Latina Publicaciones; 2008. [ Links ]
26. Alcaldía de Santiago de Cali. Agenda ambiental comuna 13. Cali: Departamento Administrativo de Gestión y Manejo Ambiental (Dagma); 2003. [ Links ]
27. Alcaldía de Santiago de Cali. Cali en cifras 2008. Cali: Departamento Administrativo de Planeación; 2008. [ Links ]

