


Serviços Personalizados
Journal
Artigo
 Inglês (pdf)
 Artigo em XML
 Referências do artigo
 Enviar este artigo por email
Indicadores
-
 Citado por SciELO
 -
 Acessos
Links relacionados
-
 Citado por Google
 -
 Similares em
SciELO
Similares em
SciELO -
 Similares em Google
Compartilhar

 Permalink
Colombia Médica
versão On-line ISSN 1657-9534
Colomb. Med. v.42 n.2 Cali abr./jun. 2011
Real time PCR. Application in dengue studies
Jeanette Prada-Arismendy, MD, MSc1, Jaime E. Castellanos, OD, MSc, PhD2
1. Assistant Professor, Virology Group, Universidad El Bosque, Bogotá, Colombia. e-mail: jpradaarismendy@yahoo.es
2. Professor, Viral Pathogenesis Group, Universidad Nacional de Colombia, Bogotá, Colombia. e-mail: jecastellanosp@unal.edu.co
Received for publication September 18, 2009 Accepted for publication April 13, 2010
SUMMARY
PCR (polymerase chain reaction) is a routinely used tool in every diagnostic and research laboratory. This technique has been used in detection of mutations and pathogens, forensic investigation, and even is the base tool for human genome sequencing. A modification of PCR technique, real time PCR, allows the quantification of nucleic acids with higher sensibility, specificity and reproducibility. This article is intended to clarify the foundations of real-time PCR, using an application model for virology. In the actual work, it was quantified the viral load of dengue virus serotype 2 produced from infected murine macrophages; the obtained results in this work established that murine strain BALB/c presents a greater susceptibility to dengue virus infection, which establishes BALB/c murine strain as a best model of study for investigation of dengue virus infection physiopathology.
Keywords: PCR; Real time PCR; Molecular biology; Dengue virus; Housekeeping gene.
Colomb Med. 2011; 42: 243-58
PCR en tiempo real. Modelo de aplicación en dengue
RESUMEN
La reacción en cadena de la polimerasa (PCR) es una herramienta usada de rutina en todos los laboratorios de diagnóstico e investigación. Esta técnica se utiliza en detección de mutaciones y patógenos, investigación forense, e incluso es la base para la secuenciación del genoma humano. Una modificación de la PCR, la PCR en tiempo real, permite la cuantificación de ácidos nucléicos con mayor sensibilidad, especificidad y reproducibilidad. Este artículo pretende revisar los principios de PCR en tiempo real y exponer un modelo de aplicación en virología en el que se cuantificó el número de copias virales producido a partir de macrófagos murinos infectados con virus dengue 2; los resultados obtenidos establecieron que la cepa murina BALB/c presenta una mayor susceptibilidad a la infección por virus dengue, lo que permite establecer esta cepa de ratones como un mejor modelo de estudio para la investigación de la fisiopatología de la infección por virus dengue.
Palabras clave: PCR; PCR en tiempo real; Biología molecular; Virus dengue; Gen housekeeping.
Colomb Med. 2011; 42: 243-58
Polymerase chain reaction (PCR) is a powerful tool in the detection of minute quantities of nucleic acid. Due to the exponential amplification of the target sequence, this technique is highly sensitive, permitting detection of less than 10 copies of any nucleic acid template. PCR has become one of the most used tools in research and diagnosis. In spite of its technical versatility, its use as diagnostic tool has been limited primarily to the field of virology, and only to a reduced number of viruses, for which there are complete commercial kits for the detection of their nucleic acids.
The PCR technique was first developed by Mullis1 in 1986 and since then, it has turned into a basic and indispensable technique in any molecular biology laboratory. This technique calls for three great fundamental steps, which are: extraction of nucleic acids, enzymatic amplification of a nucleic acid fragment, and detection of the amplified fragments through electrophoresis or another system. The whole process could take approximately 24 hours, once it is completely standardized2. In spite of the important contributions made by PCR for the advancement of molecular biology, this technique has some disadvantages like:
- Relative low precision and sensitivity,
- The amplified fragments are only differentiated by size,
- The need for post-PCR manipulation generates contamination risk with apparition of false-positive results,
- In most cases, processing is not automated,
- It only permits quantifying nucleic acids in small ranges from 2-4 log, and
- Measurements of the intensity of ethidium bromide-stained products or other intercalators dyes are not quantitative.
These reasons led to the need for establishing an «improved» PCR system with greater versatility which can overcome the difficulties of conventional PCR. Northern blot techniques have also been extensively used along with the RNAse-protection assay to quantify cell and tissue messenger RNA, notwithstanding their low sensitivity and high complexity, as well as technical difficulty. Developments of real-time PCR have permitted quantifying genetic expression with greater speed, sensitivity, and precision, even from very small biological samples.
GENERALITIES OF REAL-TIME PCR
Quantification of target sequences via real-time PCR or quantitative PCR (qPCR) is based on the detection and measurement of amplified products (amplicons) during each cycle of the amplification reaction. This is accomplished through the continuous determination of the fluorescence signal increase during the reaction, which is directly proportional to the amount of DNA present at each reaction moment. In conventional PCR, the determination and quantification of the amplicons is done from products accumulated at the end of the PCR. Equipments for real-time PCR allow detect the number of amplified products generated in each cycle of the logarithmic amplification phase; hence, this technique has eliminated the need for sample manipulation allowing total automation of amplification and detection systems, which minimizes contamination risks3. The first development in real-time PCR was proposed by Holland et al.4, who managed to develop the fundamental principle of the technique, by taking advantage of the 5' to 3' exonuclease activity of Taq polymerase enzyme. In this work, researchers introduced onto the PCR reaction a non-extendable oligonucleotide probe in its 3' end and labeled with a radioactive phosphorus molecule at the 5' end. During amplification, the Taq polymerase exonuclease activity degrades the probe into small fragments, whose amount was measured via autoradiography and was directly proportional to the initial number of target molecules of the reaction. This technique is the basic principle used in real-time PCR especially that used in the detection system through TaqMan® probes, which will be discussed in detail further ahead.
Later, Higuchi et al.5 developed a methodology that permitted simultaneous amplification and detection of specific DNA sequences. Specific DNA sequences, by adding the ethidium bromide DNA intercalator to PCR reaction and coupling an optic fiber to each tube, which permitted detecting the fluorescence in each cycle after UV stimulation. Thus, the DNA quantification was accomplished through the determination of the fluorescence emitted by the amplicons as the enzymatic reaction takes place, therefore, the greater the amounts of DNA, the greater the fluorescence will be. Using the same principle, this group carried out the detection and identification of different alleles of a single gene by employing specific primers and utilizing optimal amplification conditions.
Stemming from this principle, the technique was used for quantitative detection of mRNA products (through reverse transcription and PCR, RT-PCR) using the double-stranded DNA (dsDNA) intercalator SYBR Green I, which fluoresces at 520 nm when excited with a 485 nm beam. This intercalating agent proved to be not only more secure in its use, but also much more sensitive than the ethidium bromide, presenting better linear relationship between the amount of PCR products and the fluorescence intensity6. According to previously reported data, the sensitivity of the SYBR green I in real-time PCR is between 100 to 2000 times greater compared to conventional PCR7,8.
Basically, equipments for real-time PCR are common thermo-cycler devices that have incorporated a light source that excites the reaction tube and the sample at the appropriate wavelength and a system to detect and quantify the emitted fluorescence. In this way, it is possible to follow in real time, the change in the amount of DNA generated in each cycle of the PCR by using the software and computer connected to the thermocycler. The pioneering equipment for the automation of this technique was the ABI Prism 7700 Sequence Detection System (Applied Biosystems) and the LightCycler (Roche). The latter adopted the technology used in flow cytometry to evaluate samples between 1-10 µl in glass capillary tubes. This equipment permits rapid and homogenous temperature control (10°C/s) along the whole sample through the circulation of air. Now, the systems include applications for quantification and analysis of nucleic acid dissociation curves to confirm the Tm of amplicons. One of the advantages of the LightCycler equipment is its micro-volumetric capacity, which permits analyzing scarce or difficult-to-obtain samples9.
Currently, there are numerous instruments available for real-time PCR. Differences among them lie on the emission and excitation wavelengths, speed, and number of reactions that can be simultaneously setted up. The most popular systems are adapted to process 96-well plates in parallel, among which are the systems from Applied Biosystems 7300 and 7500; the Exicycler system (Bioneer); the Chromo4, DNAEngine Opticon, iCycler, iQ, MyiQ and the iQ5 (BioRad); the RealPlex thermo-cycler (Eppendorf) and the Mx3000p, Mx3005p, and Mx4000 instruments (Stratagene). Likewise, the softwares connected to the real-time PCR thermocycler have the same characteristics, like tools to configure specific experiments and protocols, data processing, including calculation of the threshold cycle and the saturation of the base line. The cost of real-time PCR equipment varies according to performance and to the number of fluorochromes it is able to detect10.
DEFINITION OF SOME TERMS USED IN REAL-TIME PCR
FRET. Fluorescence resonance energy transfer (FRET) refers to the mechanism of energy transference among fluorochromes. It is based on that the light emitted by a fluorochrome can be transferred to another one nearby. These two fluorophores must have overlapping excitation and emission spectra, so that by being sufficiently close, the energy of the donor fluorophore is transferred to the receptor fluorophore. As a result of this transference, the mean lifetime of the donor is diminished, donor fluorescence is quenched, and receptor fluorescence intensity is enhanced. The efficiency of the energy transference between donor and «quencher» falls rapidly as physical distance increases between the two fluorophores increasing fluorescence emitted by the donor, which is then used in real-time PCR to quantify nucleic acids11. This system is used with TaqMan® probes, which are labeled with both fluorophores. These probes hybridize with the region to be amplified, whose limits are defined by the primers. During extension step of PCR amplification, the polymerase degrades the probe and separates the fluorochromes in such a manner that the light emitted by the donor is not extinguished and is detected by the equipment's detection system. Thus, the fluorescence intensity in the reaction will depend on the specific amplification in each cycle and will be proportional to the amount of DNA.
Base line. It is defined as the number of cycles in which the fluorescence signal accumulates below the equipment's level of detection. Most equipments adjust the base line between cycles 3 and 15; however, in some cases this should be adjusted manually.
ΔRn. It is the difference between the fluorescence emission of the product in any cycle and the base fluorescence emission3,12,13. Explaining, ΔRn = (Rn+) - (Rn), where Rn+ is the reporter fluorescence emission intensity/quencher fluorescence emission intensity at a point in time in a determined tube, and Rn is the reporter fluorescence emission intensity/quencher fluorescence emission intensity measured in the same reaction tube before the start of the PCR reaction.
Threshold. The threshold is the value of unspecific fluorescence before specific amplification of the target (background fluorescence). The threshold in some equipments are adjusted as 10 standard deviations of the base line (mean fluorescence obtained between cycles 3 and 15). Fluorescence signals detected above the threshold level are considered positive amplifications.
CT (Cycle threshold). CT is the PCR amplification cycle in which the reporter fluorescence exceeds the chosen threshold above the background fluorescence. CT is the basic principle of real-time PCR and it is an essential component to obtain precise and reproducible data. With higher amounts of templates at the beginning of the reaction, the threshold level is reached in a lower number of cycles. This CT value occurs during the exponential phase of the amplification, a moment in which none of the reaction components has been exhausted and, hence, the CT value will be proportional to the initial number of copies of the gene of interest3,12.
Housekeeping gene. It is a cellular reference nucleic acid, which is quantified in parallel with the RNA or DNA of interest to minimize quantification errors due to differences in the initial amount of the sample placed in the tube, the quality of nucleicacid, or differences in the efficiency of the cDNA synthesis (for RT-PCR) or of the PCR amplification process. Usually, these genes are cellular maintenance genes that regulate the basic and ubiquitous functions of the cell. Some of these genes codify for components of the cytoskeleton (β-actin), components of the mayor histocompatibility complex (β2-microglobulin), enzymes of the glycolytic pathway (glyceraldehyde 3-phosphate dehydrogenase), enzymes of the salvage pathway of nucleotide synthesis (hypoxanthine ribosyltransferase), proteins involved in the peptide folding (cyclophilin), or ribosomal RNA. The idea of a housekeeping gene is that it should be uniformly expressed throughout all the experimental or environmental conditions of a given system14.
Design of primers and TaqMan®probes15. The design of primers and probes for real-time PCR should be very careful and follow some parameters to ensure amplification quality and efficiency. Some of these parameters are identical to those followed for primer design in conventional PCR; however, some are specific for this technique:
- The amplified product should be ideally smaller than 250 pb, with a range between 100 and 250 pb. This improves the efficiency of the amplification. In the TaqMan® system, the amplicon size must be between 60 and 150 pb.
- The GC content should be between 35 and 65%, both in the primers as in the TaqMan® probes. Very low GC contents induce a low rate of primers binding to the template, while very high GC contents cause incorrect alignment of the primers, or mispriming.
- The melting point (Tm) is the most important factor to assure optimal primer alignment. This temperature should be between 58 and 60°C, and both primers should have similar Tm. The primers and probes should be carefully designed, seeking to make them highly specific. This is accomplished by using tools like BLAST (http://blast.ncbi.nlm.nih.gov/Blast.cgi?CMD=Web&PAGE_TYPE=Blast Home), which permits comparison via nucleotide sequence similarity against the GenBank data base.
- The primers should have a length between 16 and 28 nucleotides. Very short primers alter the specificity of the amplification and very long primers generate secondary structures and dimers.
- The primers and probes should not form secondary structures, nor should they be complementary to regions generating these types of structures in DNA. It is not recommended to use primers with high 3' end stability, or primers with low sequence complexity, given that they can generate mispriming.
- Ideally, primers should be designed so their sequence extends to two consecutive exons. This is done to avoid undesirable amplification of contaminant DNA.
- The TaqMan® probes should have a Tm 10°C greater than the primers used. These probes should not include a guanine nucleotide in the 5' end, because such nucleotide generates quenching of the reporter fluorescence.
- The probe should be placed as close as possible to the primers, without overlapping nucleotides in its sequence.
DETECTION SYSTEMS USED IN REAL-TIME PCR
In the quantification system for real-time PCR, as already mentioned, the amount of amplified product is detected through the quantification of the fluorescence emitted as the PCR reaction takes place. The thermocycler equipments used for this technique, incorporate a fluorescence sensor that measures at any given moment the fluorescence emitted in each of the wells. There are two types of detection systems via fluorescence: intercalating agents and labeled specific probes.
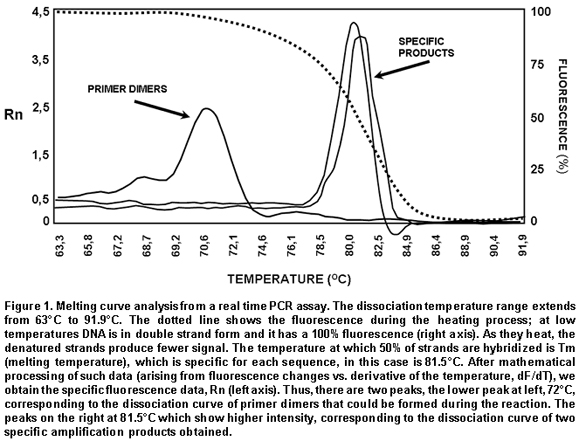
Intercalating agents. SYBR Green I and ethidium bromide are found within this group, the former being the one most often used. Using these intercalating agents results in the most economic, simplest, and easiest standardization in quantitative PCR protocols. SYBR Green I only fluoresces when it is intercalated in dsDNA, thus, the fluorescence signal intensity is directly proportional to the amount of dsDNA present in the reaction. The main disadvantage is its lack of specificity, given that SYBR Green I will intercalate in any dsDNA product present in the reaction, including contaminant amplicons and primer dimers. To diminish the risk of non-specific amplifications, aside from a careful design of primers and the use of optimal reaction conditions, the analysis of a real-time PCR carried out with SYBR Green I must include doing a dissociation curve by measuring the fluorescence emitted by the SYBR Green I along a temperature range; the denaturing of the amplicon will be observed as a loss of fluorescence at point near the Tm of the specific product. The shape and position of this DNA dissociation curve are functions of the GC/AT ratio, the length of the amplicon and its sequence, and it may be used to differentiate amplification products whose dissociation curves are separated by less than 2°C (Figure 1)3,16,17.
Fluorescent probes. This system includes the use of small single strand DNA sequences of approximately 20-25 nucleotides, labeled with a fluorochrome donor and a fluorochrome receptor (quencher). This system is based on FRET between two molecules. Within this detection system there are several types, the most used are hydrolysis probes (known as TaqMan® probes), dual hybridization probes or FRET probes and molecular beacon probes.
TaqMan® probes are oligonucleotides covalently joined at the 5' end to a fluorochrome donor and at the 3' end to a fluorochrome quencher that absorbs the fluorescence emitted by the donor. This TaqMan® probe system utilizes the principle developed by Holland, previously described, where the Taq polymerase hydrolyzes the probe and release the fluorochrome, which now can be detected and quantified by the equipment, because its fluorescent emission is no longer absorbed by the quencher.
Molecular beacon probes are similar to the TaqMan® probes as far as the position of the donor and quenching fluorochrome; the difference lies in that the molecular beacon probes have a secondary loop-shaped structure in which the sequence forming the loop is complementary to the sequence of interest. When the probe loses the secondary structure and the loop is hybridized with its complementary sequence, the donor and quencher separate physically, thus, permitting fluorescent emission by the donor.
The FRET probe system, or dual hybridization probes consists of two probes, one of them labeled with a receptor fluorochrome at the 5' end and another labeled with a fluorochrome donor at the 3' end. Hybridization of both probes permits their physical closeness, inducing energy transference from the donor to the receptor, which emits fluorescence and can be detected by the equipment detector2-4.
QUANTIFICATION METHODS IN REAL TIME PCR
Before real-time PCR was available, conventional PCR methods were adapted to quantify specific products. These methods, like competitive PCR or limit dilution PCR, are always based on the analysis of the product at the end of 30 or more amplification cycles and determine the amount of products amplified after the reaction has ended. These end-product methods have some disadvantages when used as semi-quantitative methods, given that they use the result obtained in the reaction plateau phase as point of analysis, for which reactions with a low number of initial copies could reach the same plateau level as reactions starting with a higher number of copies due to efficiency differences in each reaction.
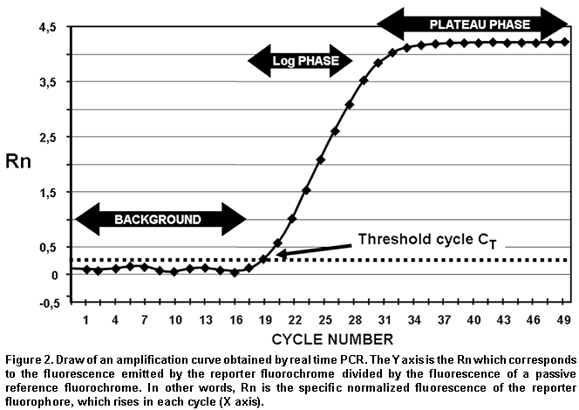
Real-time quantification permits visualizing the PCR curve, which contains an initial background phase, persisting until the specific fluorescence of the amplified product exceeds the non-specific fluorescence; a phase of exponential growth (log phase) where the amplification is constant and the reaction efficiency can be determined, and a final plateau phase where very few additional amplifications take place. As noted previously, CT is the cycle number in which the specific fluorescence produced by the genuine amplification of the target product surpasses in intensity the non-specific background fluorescence. This is why CT is considered the most precise point for quantification, given that it is proportional to the sample amount at the beginning of the reaction (Figure 2). Unlike conventional PCR, real-time PCR permits accure and kinetic quantification because it analyzes the amount of product amplified during the logarithmic phase (log phase), where the amplification efficiency of each reaction is constant.
There are two main methods for real-time PCR quantification: absolute quantification and relative quantification. In absolute quantification, the amount of initial target product is expressed through an absolute value, generally copies/ml. To use absolute quantification, an external standard should be simultaneously amplified, denominated calibration curve or standard curve, in which known amounts of the template are amplified and the CT is obtained for each of them. With these data, a vector is generated and through linear regression analysis the vector equation is obtained, which is used to extrapolate the CT data from each of the problem samples; this way, the number of copies will be known in the initial sample prior to the amplification. The calibration curves are highly precise and generate sensitive and reproducible data. Nevertheless, care must be exercised in the validation of the standard, since quantification precision depends totally on the precision of the curve. The calibration curves can be DNA standards of known concentration, e.g., a recombinant plasmid with an insert of a fragment of the same DNA that is being quantified in the samples. Absolute quantification is necessary when there is no specimen or sample that can be established as the basal state to compare changes in the expression levels of the gene evaluated18.
Relative quantification describes changes in the quantity of the gene of interest compared to its level in a basal or non treated sample; this quantity is expressed as a ratio between the concentration of the target product and a reference gene. Relative quantification, therefore, does not require a known concentration standard, but uses a housekeeping gene as reference gene16. To carry out the relative quantification of the expression of a gene, several mathematical models have been established, some of which calculate without correcting the efficiency of the reaction, assuming an ideal amplification efficiency of 2 (each cycle would produce 2 new copies of each original copy); meanwhile others calculate the efficiency by correcting the data per reaction, requiring more complex mathematical calculations18,19.
APPLICATIONS OF REAL-TIME PCR
Real-time PCR is used in multiple applications, among which there are viral quantification and genetic expression quantification, furthermore, it serves as methodology to validate data obtained from microarrays, measure therapeutic effectiveness, measure DNA damage from diverse mutagens, detect pathogens and genotyping, determine polymorphisms and mutations, as well as applications in pharmacogenetic studies, among others. Due to its high versatility and power in such diverse applications, its usefulness has been proven in various fields, including biomedical research where real-time PCR has impacted on genetic expression studies, while it also permits genotyping knock-out, knock-down organisms and transgenic models. Furthermore, with the use of real-time PCR for allelic discrimination, advancements have been made in the detection of polymorphisms involved in some diseases susceptibility, which facilitates epidemiological studies20.
Another application field of this technology is in microbiological molecular diagnosis for viral and bacterial infections. The determination of viral load has allowed monitoring the progression of viral disease and measuring the effectiveness of antiviral therapies. Additionally, mutational studies of viral genomes permit conducting epidemiological studies of co-infections and analyzing viral quasispecies21. Likewise, in bacteriological studies, quantitative PCR allows to use better selected antibiotic therapies and helps to reduce the use of broad-spectrum antibiotics, thus diminishing the appearance of resistant strains. This technique has been used for detection of multiple mycobacterium, Legionella pneumophila, Listeria monocytogenes, diverse strains of Neisseria and Streptococcus, Escherichia coli, Bordetella pertussis, Mycoplasma pneumoniae, Haemophilus influenzae, Borrelia burgdorferi, Bacillus anthracis, Yersinia pestis and in studies of antibiotic resistance22.
Quantitative PCR is widely used in the field of oncology, because it can detect and quantify chromosomal translocations or transcripts generated by gene fusion in samples from patients, which permits determining the progression of the disease, or the presence of residual minimal disease. An example of this is the determination of the AML-1/MTG8 fusion transcript in myeloid leukemia, the detection of genetic products by fusion in acute lymphoid leukemia, or the response to treatment via quantification of the BCR-ABL product in chronic myeloid leukemia. Also, real-time PCR may be used to analyze gene expression in solid tumors from very small samples, which helps not only to understand the biology of cancer, but also to establish more effective therapeutic strategies21.
APPLICATIONS IN VIROLOGY
Recent advancements in molecular biology have generated great contributions in virological detection and diagnosis. The development of methodologies like PCR, RT-PCR, and quantitative PCR has substantially improved the sensitivity of virus detection. The evaluation of viral load via real-time PCR offers information on the proliferation dynamics of an infectious pathogen, the presence of active infection, the host-pathogen interaction, and the response to antiviral therapy, all of which is relevant in patient prognosis and may serve as a guide for optimal therapeutic interventions23,24.
Given the marked importance achieved by real-time PCR in diagnosis and monitoring of viral infections, currently, there are multiple commercial kits for the detection of some of the most important viruses involved in human disease (human immunodeficiency virus, hepatitis B and C virus, cytomegalovirus, human papillomavirus, and coronavirus). Furthermore, bearing in mind that quantitative monitoring of infectious virus has turned indispensable, not merely in the clinical study of the patient, but also in research of the viral infection pathogenesis, a great number of tests have been developed in each laboratory (home-made) for diverse viruses, including: adenovirus, enterovirus, herpes virus, rhinovirus, lymphotropic virus, influenza virus, parvovirus, flavivirus, among many others23.
In the most recent porcine influenza pandemia (2009), real-time PCR has shown its broad potential as a diagnostic potential. The Center for Disease Control (CDC) has developed a protocol for the confirmation of infection through porcine A H1N1 influenza by using real-time PCR, utilizing hydrolysis probes (TaqMan® probes), which permit the detection and characterization of this virus in diverse specimens including samples of bronchoalveolar lavage (BAL), tracheal aspirates, nasopharyngeal or oropharyngeal swabs, among others25.
In the present study was conducted a literature review on real-time PCR to study and broaden on the fundamental and technical aspects of such. Additionally, this work is a potential introductory manual for this molecular biology tool for other laboratories and research groups. In the second place, we describe one of the protocols used for viral quantification through this technique, which serves as an applied model of quantitative PCR for its use in the field of virology.
MATERIALS AND METHODS
Cell culture, infection, and RNA isolation. Peritoneal macrophages of two strains of mouse (BALB/c and ICR) were obtained, as described previously26. The macrophage cultures were infected with a human isolate dengue virus serotype 2 grown in Aedes albopictus C6/36 mosquito cells. After titration of viral inoculum (2.8 x 10⁶ UFP/ml), the virus was placed in contact with macrophages for 1 h at 37°C and CO2 8% and at a multiplicity of infection (MOI) of 0.1. Then, the inoculum was removed and replaced with fresh RPMI medium supplemented with 10% FBS. The cultures were incubated for additional 24 and 48 hours to allow viral replication. At each post-infection time, RNA was extracted from the supernatants and the macrophage monolayer, using the guanidine/chlorophorm thiocyanate method27. Spectrophotometry quantification was made at 260 nm and RNA quality was verified by measuring the absorbance ratio at 260/280 nm.
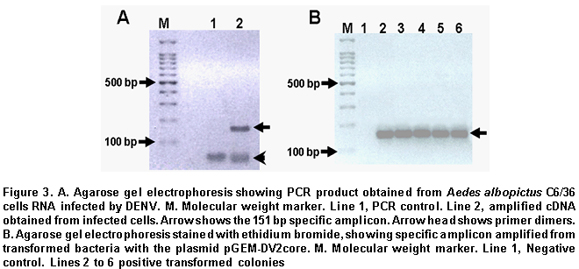
Calibration curve for absolute quantification. Conventional RT-PCR was performed from isolated RNA, using DV2C-L 5'- CAATATGCTGAAACGC GAGA-3' and DV2C-R: 5'-TGCTGTTGGTGGGA TTGTTA-3' primers, which were designed by using the bio-informaticts tool Primer3 (http://frodo.wi.mit.edu/cgi-bin/primer3/primer3_www.cgi), based on the NC_001474 sequence reference. These primers amplify a 151-pb fragment of the dengue virus capsid gene. This PCR amplified product was separated in an agarose electrophoresis at 2% and visualized with ethidium bromide under UV light (Figure 3A). The agarose band that contained the amplified was cut and purified by using the SV Gel kit and PCR Clean Up System (Promega), following manufacturer's recommendation. This purified fragment was linked to the plasmid pGEM-T-Easy Vector System (Promega), by using T4 DNA ligase, and then this recombinant vector was used to transform highly efficient competent E.coli bacteria from the DH5a strain, by following previously reported protocols28. Clones of transforming bacteria were selected and confirmed via PCR, as observed in Figure 3B. The transformed bacteria were cultivated in LB broth and the pGEM-DV2core plasmid was purified by using the Wizard® Plus SV Minipreps DNA Purification System kit. The recombinant plasmid was confirmed via PCR by using primers that amplify the 151-pb fragment of the dengue virus capsid gene. Once the DENV capsid gene fragment was cloned, the purified recombinant plasmid was quantified through spectrophotometry at 260 nm to prepare a dilution containing 1010 copies of plasmid/ml, using the formula:
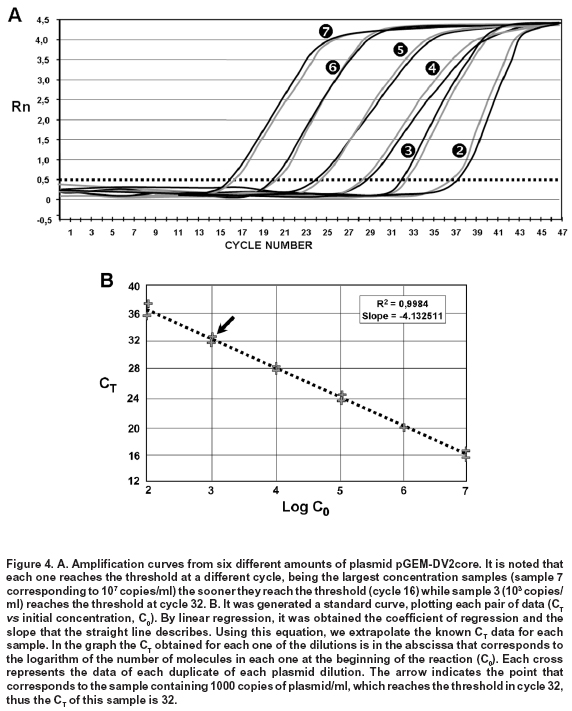
From this result, serial dilutions were prepared from 109 to 102 copies/ml of the plasmid. These dilutions were used to build the standard curve with which the absolute quantification of viral copies was done via real-time PCR from RNA obtained from supernatants of macrophages. This standard curve was initially tested, yielding an R2=0.9984 and a slope = -4.132511 (Figure 4).
Real-time PCR test. From 1 mg of total RNA from each experimental condition, reverse transcription was performed by using random primers (Promega) at a concentration of 0.025 µg/µl and the reverse transcriptase enzyme M-MLV (200 U/ml) (Promega) at 37°C for 1 h to obtain cDNA.
For real-time PCR amplification, it was used SYBR Green I (DyNAmo, Finnzymes) using the GeneAmp 5700 Sequence Detection System apparatus (Perkin-Elmer Corporation). The reaction mix contained 4 ml of cDNA, 10 ml of Master Mix 2x,which contains Thermus brockianus DNA polymerase, SYBR Green I, optimized PCR buffer, MgCl2 5 mM, dNTPs including dUTP; and 0.2 mM of primers: DV2C-L and DV2C-R. Samples without cDNA were used as negative controls, and as positive controls we used samples of cDNA obtained from the viral inoculum produced in mosquito cells. The amplification protocol included 2 min at 50°C, 10 min at 95°C, and 40 cycles at 95°C for 15 s and 1 min at 60°C. Finally, a dissociation curve was generated heating the PCR products from 50°C to 95°C to confirm primer dimers absence.
DATA ANALYSIS
The data obtained from infected macrophages was analyzed by two ways:
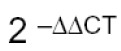
- when the data source was the infected monolayer, we use the relative quantification method, based on the supposition of ideal amplification efficiency with twice the product in each cycle, accompanied by a duplication of the fluorescence intensity that can be calculated by using the 2-ΔΔCT formula and using β-actin as normalizing gene29,30.
- when the data was obtained from the supernatants, absolute quantification was done through the generation of a standard curve from the pGEM-DV2core plasmid, using 5 serial dilutions of plasmid (107, 106, 105, 104, 103, 102 molecules). Linear regression was done from data obtained on this curve31, normalizing this amount for each µg of extracted RNA. In total, two animals were used from each mouse strain, and from each of these it was obtained two independent cell cultures. Upon doing the real-time PCR assay, two replicas were done from which it was obtained the average and standard deviation. Data were analyzed via a Student t test.
RESULTS
Quantification of viral copies produced by peritoneal macrofages from two different mice strains
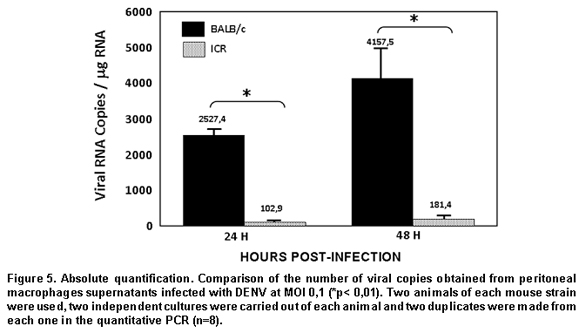
- Absolute quantification. The susceptibility of peritoneal macrophages from mice strains studied was analyzed via real-time PCR from RNA obtained from supernatant of these cells infected for 24 and 48 h at MOI 0.1, through the quantification of viral copies detected; this way, we evaluated the number of viral copies released from macrophages onto the medium. As observed in Figure 5, the number of viral copies obtained from macrophage supernatants of BALB/c mice infected with dengue virus with MOI 0.1 were approximately 20 times greater than that obtained in macrophage supernatant of ICR mice (2527.4 vs. 102.9 copies/ml at 24 h post-infection).
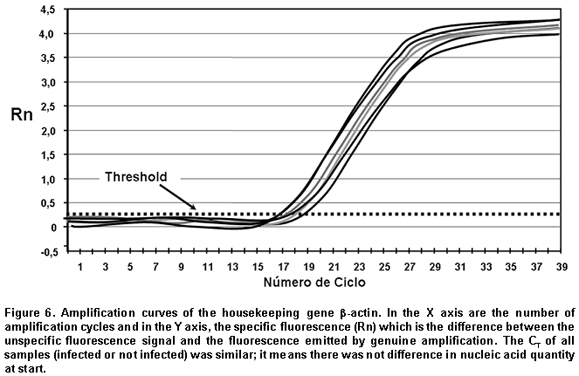
- Relative quantification. To corroborate and complement the results found in the macrophage supernatants, we conducted viral quantification in RNA obtained from the monolayers of the same macrophages. This permits evaluating the amount of the intracellular virus and comparing with the amount of virus released onto the supernatant. For this test, real-time PCR was used employing relative quantification, using β-actin as housekeeping gene, to normalize the data obtained. Through conventional PCR, we proved that the β-actin expression does not change with dengue virus infection and, additionally, this finding was confirmed via real-time PCR. CT found for β-actin in the different conditions oscillates between 18 and 20 (Figure 6).
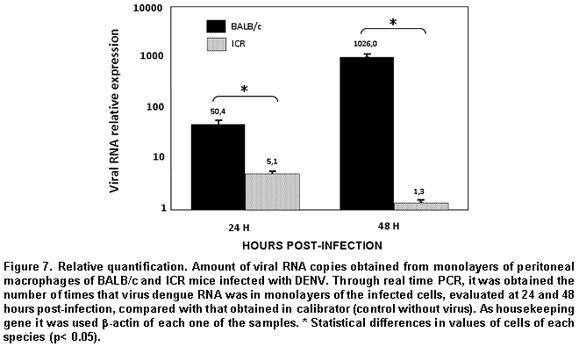
The results from the relative quantification agree with that found through absolute quantification. Again, the greatest amount of viral RNA was found in the BALB/c macrophages compared to ICR mice; the relative expression of viral RNA in BALB/c macrophages being between 50 and 1000 times greater than that found in ICR mice macrophages. The relative expression of viral RNA in one or another type of cells was done through the 2-ΔΔCT formula using the non-infected culture as system calibrator (Figure 7).
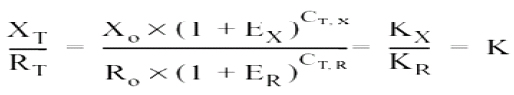
The derivation of this method includes some suppositions, experimental design, and validation tests, which were previously reported30. Hereinafter, we will describe the derivation method employed. For this case, the amount of viral RNA molecules in a sample, normalized with the β-actin gene and relative to a calibrator (non-infected culture) is given by:
The equation describing the PCR exponential amplification is given by:
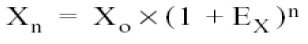
Where:
Xn = Number of amplicon molecules in an n cycle of the reaction
Xo = Initial number of molecules in the sample of interest
Ex = Efficiency of the amplification of the segment of interest, and
n = number of cycles
The threshold cycle (CT) indicates the number of cycles in which the amount of the product amplified reaches a fixed threshold, i.e.,
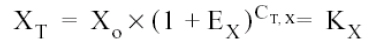
Where:
XT = Number of viral gene molecules in the threshold cycle
CT, X = Threshold cycle for viral-gene amplification, and
KX = Constant
A similar equation for amplification of the reference or normalizing (β-actin) gene in each of the samples:
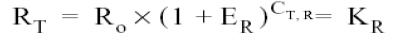
Where:
RT = Number of β-actin molecules in the threshold
Ro = Initial number of reference-gene molecules
ER = Efficiency of β-actin amplification
CT,R = The threshold cycle for β-actin amplification
KR = Constant
Dividing XT by RT, we get the expression:
Assuming that the efficiency of the amplification of the viral gene and of the β-actin gene is the same, we have:
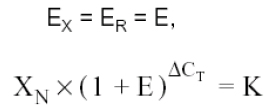
Where:
XN = amount of viral gene normalized for a sample (Xo / Ro)
DCT is equal to the difference in the viral gene threshold cycle and the threshold cycle for β-actin (CT,X - CT,R)
Modifying the expression, we would have:
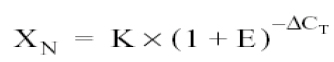
The final step is to divide the XN from some sample (q) by the XN from that obtained from the calibrator (cb, non-infected culture):
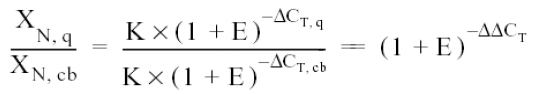
Where:

And the relative expression then calculated, replacing in the formula:
DISCUSSION
This work uses the real-time PCR technique to quantify the number of viral copies produced from monolayers and supernatants of peritoneal macrophages from two different mice strains, and thus evaluate the susceptibility of these cells to dengue virus infection, defined as the capacity of a cell to permit the replication of the virus. To conduct this quantification, we used SYBR Green I, since this real-time PCR system presents some advantages compared to the hydrization probe system (TaqMan®), like: its low cost, the possibility of performing diverse experiments with the same reagents without needing to synthesize a probe for each quantified gene, and the possibility of evaluating non-specific amplifications and primer dimers through the analysis of the dissociation curve. Additionally, it has been reported that the detection of the dengue virus is equivalent when using the SYBR Green I system compared to the TaqMan® system, making this system an appropriate chemistry for the evaluation of viral load, at least in the study of the dengue virus32. We used the peritoneal macrophage model, since it was already known that the monocyte/macrophage system is the first cellular target of the dengue virus, when inoculated by the mosquito, making this cellular model an appropriate and relatively comparable model of what occurs in vivo33.
Real-time PCR analysis in supernatants was done via absolute quantification, using a plasmid containing a gene fragment of the capsid (pGEM-DV2core) with which a standard curve was traced, which determines the number of viral copies vs. the CT obtained. This curve permits performing a linear regression to determine the number of viral copies from each of the samples, starting from the information known of the CT of each sample32,34. Upon doing the real-time PCR analysis from the RNA obtained from the supernatants, we obtained data consistent with that reported in the literature, given that as in infection by other flaviviruses like West Nile Virus and Murray Valley Virus, the macrophages of the endogamic BALB/c strain produce the greatest number of viral copies, compared to an exogamic strain like ICR, where the number of viral copies is significantly lower35.
To complement the results obtained through real-time PCR from the supernatants, we performed the same test from the monolayers. This methodological approximation permits evaluating the amount of intracellular virus that has not been freed to the medium and correlating these data to those of the free virus in the supernatant. For this analysis, relative quantification was done through the use of a normalizing or reference gene; in this case, we used β-actin and as data calibrator we used the results from the non-infected control cells29. β-actin was used as normalizing gene, because in conventional PCR as in quantitative PCR tests no changes were observed in its expression under different experimental conditions and it is, furthermore, one of the most recommended genes for this purpose36. The results yielded by real-time PCR of macrophage monolayers were consistent with the results obtained in supernatants. This suggests that ICR mice macrophages have mechanisms altering viral replication from its early phases, given that the virus does not manage intracellular accumulation, nor does it manage getting liberated onto the medium. This could discard a resistance mechanism involving viral packaging as has been previously postulated37.
In addition to the results described, previously reported38,39, an important result of this work was the generation of a recombinant plasmid containing a gene fragment of the DENV-2 capsid. This biotechnological product can be used for the generation of standard curves to quantify the viral load of the dengue virus in diverse works, and it is potentially available to be used by any research group requiring it40-42.
Conflict of interest. None of the authors has conflicts of interest related to this study.
ACKNOWLEDGEMENTS
Colciencias funded study, project entitled «Neuroimmunology of in vivo dengue virus infection» (N° 1308-0517588).
REFERENCES
1. Mullis K, Faloona F, Scharf S, Saiki R, Horn G, Erlich H. Specific enzymatic amplification of DNA in vitro: the polymerase chain reaction. Cold Spring Harb Symp Quant Biol. 1986; 51 Pt 1: 263-73. [ Links ]
2. Costa J. Reacción en cadena de la polimerasa (PCR) a tiempo real. Enferm Infecc Microbiol Clin. 2004; 22: 299-305. [ Links ]
3. Arya M, Shergill IS, Williamson M, Gommersall L, Arya N, Patel HRH. Basic principles of real-time quantitative PCR. Expert Rev Mol Diagn. 2005; 5: 209-19. [ Links ]
4. Holland PM, Abramson RD, Watson R, Gelfand DH. Detection of specific polymerase chain reaction product by utilizing the 5' '! 3' exonuclease activity of Thermus aquaticus DNA polymerase. Proc Natl Acad Sci USA. 1991; 88: 7276-80. [ Links ]
5. Higuchi R, Dollinger G, Walsh PS, Griffith R. Simultaneous amplification and detection of specific DNA sequences. Biotechnology. (NY) 1992; 10: 413-7. [ Links ]
6. Schneeberger C, Speiser P, Kury F, Zeillinger R. Quantitative detection of reverse transcriptase-PCR products by means of a novel and sensitive DNA stain. PCR Methods Appl. 1995; 4: 234-8. [ Links ]
7. Dhar AK, Roux MM, Klimpel KR. Detection and quantification of infectious hypodermal and hematopoietic necrosis virus and white spot virus in shrimp using real-time quantitative PCR and SYBR Green chemistry. J Clin Microbiol. 2001; 39: 2835-45. [ Links ]
8. Skeidsvoll J, Ueland PM. Analysis of double-stranded DNA by capillary electrophoresis with laser-induced fluorescence detection using the monomeric dye SYBR green I. Anal Biochem. 1995; 231: 359-65. [ Links ]
9. Wittwer CT, Herrmann MG, Moss AA, Rasmussen RP. Continuous fluorescence monitoring of rapid cycle DNA amplification. Biotechniques. 1997; 22: 130-1; 134-8. [ Links ]
10. Kubista M, Andrade JM, Bengtsson M, Forootan A, Jonák J, Lind K, et al. The real-time polymerase chain reaction. Mol Aspects Med. 2006; 27: 95-125. [ Links ]
11. Cardullo RA, Agrawal S, Flores C, Zamecnik PC, Wolf DE. Detection of nucleic acid hybridization by nonradiative fluorescence resonance energy transfer. Proc Natl Acad Sci USA. 1988; 85: 8790-4. [ Links ]
12. Gibson UE, Heid CA, Williams PM. A novel method for real time quantitative RT-PCR. Genome Res. 1996; 6: 995-1001. [ Links ]
13. Heid CA, Stevens J, Livak KJ, Willams PM. Real time quantitative PCR. Genome Res. 1996; 6: 986-94. [ Links ]
14. Bär M, Bär D, Lehmann B. Selection and validation of candidate housekeeping genes for studies of human keratinocytes. Review and recommendations. J Invest Dermatol. 2009; 129: 535-7. [ Links ]
15. Wang X, Seed B. High-throughput primer and probe design. En: Tevfik Dorak M. Real-time PCR. New York: Taylor & Francis Group; 2006. p. 93-106. [ Links ]
16. Ririe KM, Rasmussen RP, Wittwer CT. Product differentiation by analysis of DNA melting curves during the polymerase chain reaction. Anal Biochem. 1997; 245: 154-60. [ Links ]
17. Mackay IM, Arden, KE, Nitsche A. Real-time PCR in virology. Nucleic Acid Res. 2002; 30: 1292-305. [ Links ]
18. Pfaffl MW. A new mathematical model for relative quantification in real-time RT-PCR. Nucleic Acids Res. 2001; 29: e45. [ Links ]
19. Schefe JH, Lehmann KE, Buschmann IR, Unger T, Funke-Kaiser H. Quantitative real-time RT-PCR data analysis: current concepts and the novel «gene expression's CT difference» formula. J Mol Med. 2006; 84: 901-10. [ Links ]
20. Gibson NJ. The use of real-time PCR methods in DNA sequence variation analysis. Clin Chim Acta. 2006; 363: 32-47. [ Links ]
21. Valasek MA, Repa JJ. The power of real-time PCR. Adv Physiol Educ. 2005; 29: 151-9. [ Links ]
22.Espy MJ, Uhl JR, Sloan LM, Buckwalter SP, Jones MF, Vetter EA, et al. Real-Time PCR in clinical microbiology: applications for routine laboratory testing. Clin Microbiol Rev. 2006; 19: 165-256. [ Links ]
23. Watzinger F, Ebner K, Lion T. Detection and monitoring of virus infections by real-time PCR. Mol Aspects Med. 2006; 27: 254-98. [ Links ]
24. Yeh HY, Yates MV, Chen W, Mulchandani A. Real-time molecular methods to detect infectious viruses. Sem Cell Dev Biol. 2009; 20: 49-54. [ Links ]
25. World Health Organization. CDC protocol of realtime RTPCR for swine influenza A (H1N1). Atlanta: The WHO Collaborating Centre for influenza at CDC Atlanta; 2009. [ Links ]
26. Pantelic L, Sivakumaran H, Urosevic N. Differential induction of antiviral effects against West Nile virus in primary mouse macrophages derived from flavivirus-susceptible and congenic resistant mice by alpha/beta interferon and poly(I-C). J Virol. 2005; 9: 1753-64. [ Links ]
27. Chomczynski P, Sacchi N. Single-step method of RNA isolation by acid guanidinium thiocyanate-phenol-chloroform extraction. Anal Biochem. 1987; 162: 156-9. [ Links ]
28. Castañeda NY, Chaparro-Olaya J, Castellanos JE. Tecnología de la clonación y expresión génica en un sistema bacteriano y su aplicación en virología. Rev Facult Med. 2006; 11: 43-53. [ Links ]
29. Peirson S, Butler J, Foster R. Experimental validation of novel and conventional approaches to quantitative real-time PCR data analysis. Nucleic Acids Res. 2003; 31: e73. [ Links ]
30. Kenneth J, Schmittgen D. Analysis of relative gene expression data using real-time quantitative PCR and the 2-ÄÄCT method. Methods. 2001; 25: 402-8. [ Links ]
31. Castellanos JE, Martínez-Gutiérrez M, Hurtado H, Kassis R, Bourhy H, Acosta O, et al. Studying neurotrophin antiviral effect on rabies-infected dorsal root ganglia cultures. J Neurovirol. 2005; 11: 403-10. [ Links ]
32. Gomes-Ruiz AC, Nascimento RT, de Paula SO, Lopes da Fonseca BA. SYBR green and TaqMan Real-Time PCR assays are equivalent for the diagnosis of dengue virus type 3 infections. J Med Virol. 2006; 78: 760-3. [ Links ]
33. Halstead SB. Pathogenesis of dengue: Challenges to molecular biology. Science. 1988; 239: 476-81. [ Links ]
34. Wang WK, Sung TL, Tsai YC, Kao CL, Chang SM, King CC. Detection of dengue virus replication in peripheral blood mononuclear cells from dengue virus type 2-infected patients by a reverse transcription-real-time PCR assay. J Clin Microbiol. 2002; 40: 4472-8. [ Links ]
35. Mashimo T, Lucas M, Simon-Chazottes D, Frenkiel MP, Montagutelli X, Ceccaldi PE, et al. A nonsense mutation in the gene encoding 2'-5'-oligoadenylate synthetase/L1 isoform is associated with West Nile virus susceptibility in laboratory mice. Proc Natl Acad Sci USA. 2002; 99: 11311-16. [ Links ]
36. Stürzenbaum SR, Kille P. Control genes in quantitative molecular biological techniques: the variability of invariance. Comp Biochem Physiol Part B Biochem Mol Biol. 2001; 130: 281-9. [ Links ]
37. Urosevic N, van Maanen M, Mansfield JP, Mackenzie JS, Shellam GR. Molecular characterization of virus-specific RNA produced in the brains of Flavivirus-susceptible and -resistant mice after challenge with Murray Valley encephalitis virus. J Gen Virol. 1997; 78: 23-9. [ Links ]
38. Prada J, Castellanos JE, Rincón V. El genotipo de oligoadenilato sintetasa 1b no está relacionado con susceptibilidad a la infección por virus dengue en macrófagos de diferentes especies de roedores. Acta Biol Colomb. 2006; 11: 162-3. [ Links ]
39. Prada J, Rincón V, Castellanos JE. Relación entre el genotipo de la enzima oligoadenilato sintetasa (Oas1b) y la susceptibilidad a la infección por dengue en ratones. Infectio. 2006; 10: 139. [ Links ]
40. Houghton-Triviño N, Salgado DM, Rodríguez JA, Bosch I, Castellanos JE. Levels of soluble ST2 in serum associated with severity of dengue due to tumour necrosis factor alpha stimulation. J Gen Virol. 2010; 91: 697-706. [ Links ]
41. Houghton-Triviño N, Salgado D, Rodríguez J, Bosch I, Castellanos JE. Los niveles del inmunoregulador STST2s y citoquinas pro-inflamatorias, pero no la carga viral, se correlacionan con severidad en pacientes con infección aguda por Dengue. Infectio. 2008; 12: S51. [ Links ]
42. Martínez-Gutiérrez M, Trujillo A, Castellanos JE, Vélez ID, Mañes S, Gallego JC. La lovastatina afecta el proceso de ensamblaje del virus dengue más que la replicación en dos sistemas de cultivo celular. Biomedica. 2009; 29: 192-3. [ Links ]

