


 text in
  English (pdf)
 Article in xml format
 Article references
 Send this article by e-mail
 Cited by SciELO
  Cited by Google
  Similars in
SciELO
Similars in
SciELO  Similars in Google
 Permalink
Introduction
Socio-economic differences in cancer survival have been well documented in the last two decades 1. Disparities in stage at diagnosis have been considered as the main underlying factor of those differences. However, there is evidence that differential access to timely and adequate treatment by socio-economic groups also determines cancer survival inequities 1. Estimations of relative risk of dying comparing the most deprived groups with the best-off groups have been around 1.3 to 1.5-fold; factors underlying these differences include tumour and patient conditions, and access to and quality of care 1. In countries with universal health care insurance like Canada, socioeconomic position (SEP) remained associated with cancer survival, the differences are not being due to stage at diagnosis 2. Inequalities and inequities have been reported for all cancer sites combined 1, but also for specific sites including breast 3, cervix 4, lung 5, prostate 6 and stomach 7,8 cancers. For breast and cervical cancer, large differences were observed between developed and developing countries but also between developed countries and within countries 9. For female cancers, place of residence, income, socioeconomic and educational level, ethnicity, and migration status have been associated with inequities in survival 9.
In Colombia, health insurance financed through contributions of both workers and employers (contributory regime) is mandatory for dependent employees and partially voluntary for independent workers. A small proportion (<5%) of the population, working in certain public sectors, has exceptional or special health insurance plans (special or exceptional regime). The poor population is covered by a subsidized health system founded through taxes (subsidized regime) 10. In 2005, contributory and subsidized regimes covered 36.3% and 43.3% of the population, respectively, while about 20% of population had no health insurance 11. In theory, special and contributory regimes offer the best access to care, but in practice special/exceptional regimes have shown some problems that could make the conditions of its affiliates worse than those of the contributory regime 12,13. Recent laws (years 201114 and 2015 15) have advocated for universal health care access without differences by SEP. However, those legislative changes have not been fully implemented, and patients diagnosed prior to 2010 may have experienced different survival rates depending on their health insurance status and their SEP. Large socioeconomic disparities in gastric cancer survival were recently documented in other cities in Colombia, despite improvements in health insurance coverage 8 and therefore it is not surprising that large inequities in population-based cancer mortality exist 17,18. Hardly any population-based information by socioeconomic indicators is available for other cities and other cancers in Colombia.
Manizales is a middle-size Andean city in Colombia with a projected population in 2005 (mid-term year) of 379,794 inhabitants 18. Since 2003, the city hosts a population-based cancer registry that meets international standards proposed by IARC 19 and has reported incidence rates that are slightly higher than national estimations, mainly for breast, lung and stomach cancers 20,21 - coinciding with a higher smoker rate and position in the Andes. With incidences known, there is a need to evaluate population-based survival for this population, and evaluate the effect of health insurance and SEP on its survival rates. The aim of this paper is to analyze differences in breast, cervical, lung, prostate and stomach cancer survival as a result of health insurance and socioeconomic status in this intermediate, Andean city in Colombia.
Materials and Methods
Patients and follow up
All 1,482 patients resident in Manizales with breast, cervix uteri, lung, prostate or stomach cancer diagnosed between 2003 and 2007 and characterized at baseline by Manizales’ Cancer Registry - MCR (information regarding data quality of MCR was published previously 19,22 were included: 380 female-breast cancer cases (5 male cases were excluded), 226 cervix uteri, 230 lung, 296 prostate, and 347 stomach cancer patients. The percentages of microscopically verified cases were 95.8%, 96.9%, 78.6%, 92.5% and 89.4% for breast, cervix, lung, prostate, and stomach, respectively.
All cases were followed up until 60 months or until December 31th 2013 since diagnosis for identifying the event of study (deaths due to all causes) and time to event through matching personal identity numbers and names of incident cases with the local vital statistics provided by the local health authority; also, we performed manually searching in electoral rolls and health insurance databases. Active follow-up was performed by consultation of medical records where available. When only data for year was available, month and day were assigned to June 30th. Patients without event were censored at five years of follow-up. Subjects were considered alive if they were eligible to vote or if they were reported as “active” in health insurance databases on December 31th 2013. Survival time was calculated as the difference between incidence date and date of death, date of last contact with health system, date of loss to follow up, or date they were censored. For incidence data, MCR uses rules from European Network of Cancer Registries 23.
Sixteen subjects with a clinical cancer diagnosis were lost to follow up at day of diagnosis and were therefore treated the same as DCO cases. There were 77 cases identified only by their death certificate (DCO), representing 5.2% of all cases (breast: n= 5 (1.3%); cervix uteri: n= 5 (2.2%); lung: n= 29 (12.6%); prostate: n= 19 (6.4%) and stomach: n= 19 (5.5%). According to international registry standards, a case is flagged as DCO when death certificate is the only source of data for the case, i.e, there is no other data from pathological reports, medical images, or hospitals. Since DCO cases by definition do not have information about time to event, they were excluded from survival analyses.
Clinical and demographic characteristics
Information on histological subtype coded according to the International Classification of Diseases for Oncolgy, 3rd revision -ICDO-3- was available for 95.2% of cases; clinical stage at diagnosis according to TNM system was available in usable proportions of patients only for breast (62%) and cervix (42%) cancer. For other sites, clinical stage was available in less than 30% of cases and could therefore not be used. There were no patients with missing data for age at diagnosis. More than 85% of patients had complete date of birth, and their ages in clinical records were consistent with calculated ages. For patients without date of birth, age in clinical records was assumed as correct.
Differences in diagnostic methods were observed only for prostate and stomach cancers, which “only clinical” and “clinical procedures” methods were observed only for patients in contributory and subsidized regimes and uninsured, while 100% of the cancers diagnosed in patients affiliated to the special regime were histologically confirmed.
Socioeconomic indicators
Variables for socioeconomic position and health insurance were defined following categories previously used for a Colombian population by de Vries et al8. Socioeconomic stratum (SS) of the place of residence at diagnosis was used as indicator of SEP. In Colombia, SS is defined according to external and internal physical characteristics of dwellings and wards, ranging from the purely functional and indispensable to the aesthetic, ornamental and sumptuous characteristics. SS is reported in categories from 1 to 6, where 1 and 2 corresponds to “low” social stratum, 3 and 4 to “middle”, and 5 and 6 to “high”.
Health Insurance Regime (HIR) at the date of diagnosis was used grouping the special and exceptional regimes into one unique category, contributory regime, subsidized regime, and a group of uninsured people.
Statistical analysis
Observed survival proportions at different times were obtained using Kaplan-Meier analyses, stratifying analyses by HIR and SS, age, sex, histological subtype and, for breast and cervical cancer only, clinical stage at diagnosis. Cox multivariate proportional hazard assumption was checked by visual evaluation of log-log plots; the assumption was not violated. Three Cox multivariate regression models for each cancer were fitted for both HIR and SS: i) a univariate (null) model; ii) a multivariate model A with age, sex (lung and stomach), histological subtype, and clinical stage (breast and cervix) as covariates ; and iii) a model B containing all variables of model A plus an additional term for SS in the HIR model and vice versa 8. All calculations were performed using STATA™ SE 12.0.
Results
Patient and tumour characteristics for all 1,405 incident cases are shown in Supplementary Table 1S.
For the five cancer sites studied, 1,384 cases were finally analyzed. Lost of follow-up was 1.7% for five sites studied (0.8% for breast, 2.3% for cervix, 1.9% for lung, 1.8% for prostate, and 2.1% for stomach). In Manizales, HIR coverage among cancer patients was 88.8%, except for gastric cancer, in which 18.3% had no affiliation to HIR. Breast and prostate patients without HIR tended to be older at diagnosis than affiliated, but differences were not statistically significant.
At five-years follow-up, 700 deaths (all causes) were observed. Mean follow-up time for overall sites was 38.4 months (95% CI: 37.2; 39.7), varying from 18.5 months for lung to 50.8 months for breast cancer. Five-year observed survival (OS) was 49.1% (95% CI: 46.4-51.7) for the five sites combined. By cancer site, 5-year OS were 71.0% (95% IC: 66.1-75.3), 51.4% (95% CI: 44.6-57.9), 15.4% (95% CI: 10.7-20.8), 71.1% (95% CI: 65.3-76.1) and 23.8% (95% CI: 19.3-28.6) for breast, cervix uteri, lung, prostate, and stomach, respectively (Table 1).
Table 1 Survival estimations by cancer site and prognostic factors. Manizales, 2003-2013
| Cases (n) | Deaths (n) | Proportion surviving after (%) | WBG test* | ||||
|---|---|---|---|---|---|---|---|
| 12 m | 36 m | 60 m | |||||
| Breast | All cases | 375 | 108 | 93.8 | 81.0 | 71.0 | |
| Age at diagnosis | |||||||
| 0 a 49 | 116 | 29 | 96.5 | 85.2 | 74.8 | X2=1.63 | |
| 50+ | 258 | 79 | 92.6 | 79.1 | 69.3 | p=0.20 | |
| Histology | |||||||
| Ductal Ca. | 307 | 82 | 95.1 | 83.1 | 73.3 | X 2 =6.19 | |
| Other and NOS | 67 | 26 | 87.9 | 71.2 | 60.4 | p=0.013 | |
| Clinical stage | |||||||
| Stage I | 25 | 0 | 100.0 | 100.0 | 100.0 | X 2 =80.76 | |
| Stage II | 97 | 5 | 100.0 | 96.9 | 94.9 | p=0.000 | |
| Stage III | 82 | 19 | 100.0 | 89.0 | 76.8 | ||
| Stage IV | 29 | 11 | 93.1 | 69.0 | 55.2 | ||
| Unknown | 141 | 71 | 85.0 | 64.3 | 49.2 | ||
| Cervix | All cases | 220 | 105 | 80.7 | 62.1 | 51.4 | |
| Age at diagnosis | |||||||
| 0 a 49 | 101 | 42 | 83.0 | 68.0 | 58.0 | X2=2.40 | |
| 50+ | 119 | 63 | 78.7 | 57.1 | 45.8 | p=0.121 | |
| Histology | |||||||
| Squamos cell Ca. | 167 | 80 | 80.1 | 60.7 | 51.6 | X2= 1.99 | |
| AdenoCa. | 38 | 16 | 83.9 | 70.3 | 56.8 | p=0.369 | |
| Other and NOS | 15 | 9 | 79.4 | 57.8 | 36.1 | ||
| Clinical stage | |||||||
| Stage I | 16 | 2 | 100.0 | 93.8 | 87.5 | X 2 = 13.75 | |
| Stage II | 36 | 16 | 91.7 | 69.4 | 55.6 | p=0.008 | |
| Stage III | 30 | 19 | 80.0 | 53.3 | 36.7 | ||
| Stage IV | 13 | 10 | 69.2 | 38.5 | 23.1 | ||
| Unknown | 125 | 58 | 76.3 | 60.5 | 52.2 | ||
| Lung | All cases | 198 | 165 | 43.6 | 21.0 | 15.4 | |
| Sex | |||||||
| Women | 81 | 67 | 50.6 | 28.4 | 17.3 | X2= 3.25 | |
| Men | 117 | 98 | 38.7 | 15.8 | 14.1 | p=0.071 | |
| Age at diagnosis | |||||||
| 0 a 59 | 59 | 46 | 40.7 | 27.1 | 22.0 | X2=0.94 | |
| 60+ | 139 | 119 | 44.9 | 18.4 | 12.5 | p=0.331 | |
| Histology | |||||||
| Squamous cell Ca. | 71 | 54 | 49.3 | 22.5 | 16.9 | X2=5.96 | |
| AdenoCa. | 53 | 44 | 37.3 | 17.7 | 13.8 | p=0.113 | |
| Small cell Ca. | 16 | 13 | 56.3 | 31.2 | 18.7 | ||
| Other and NOS | 58 | 49 | 38.6 | 19.3 | 14.0 | ||
| Prostate | All cases | 270 | 78 | 92.2 | 78.9 | 71.1 | |
| Age at diagnosis | |||||||
| 0 a 59 | 43 | 8 | 95.4 | 83.7 | 81.4 | X2=2.05 | |
| 60+ | 227 | 70 | 91.6 | 77.8 | 69.2 | p=0.152 | |
| Histology | |||||||
| Adeno Ca. | 257 | 70 | 92.3 | 79.4 | 72.2 | X2=2.30 | |
| Other and NOS | 18 | 8 | 83.3 | 72.2 | 55.6 | p=0.129 | |
| Stomach | All cases | 322 | 244 | 49.4 | 33.1 | 23.8 | |
| Sex | |||||||
| Women | 114 | 83 | 57.6 | 39.0 | 26.6 | X2=1.31 | |
| Men | 208 | 161 | 44.9 | 30.0 | 22.2 | p=0.252 | |
| Age at diagnosis | |||||||
| 0 a 59 | 112 | 86 | 48.2 | 32.1 | 23.2 | X2=0.03 | |
| 60+ | 210 | 158 | 50.0 | 33.7 | 24.1 | p=0.857 | |
| Histology | |||||||
| Adeno Ca, intestinal | 146 | 111 | 54.5 | 33.8 | 23.5 | X2=2.01 | |
| Difuse Ca. | 73 | 59 | 41.7 | 26.4 | 18.1 | p=0.569 | |
| Adeno Ca., others | 48 | 35 | 47.9 | 37.5 | 27.1 | ||
| Other and NOS | 55 | 39 | 47.3 | 36.4 | 29.1 | ||
NOS: Non other specification *WBG: Wilcoxon -Breslow-Gehan test.
Statistically significant differences in survival by HIR were observed for breast, lung, prostate, and stomach - with poorer survival for the subsidized and uninsured patients. Differences by SS were observed for lung and prostate. (Figs. 1 and 2). One and five-years OS proportions were significantly lower in uninsured or subsidized patients versus patients with special or contributory HIR, with exception of cervix uteri cancer. Regarding SS, differences statistically significant were only observed in lung and prostate cancers, with poorer survival proportions in patients for low/middle versus high SS and low versus middle/high SS, respectively. However, survival proportions for cervix uteri and lung cancer of patients affiliated to the special/ exceptional HIR were lower than in the other categories, even lower than in uninsured population.
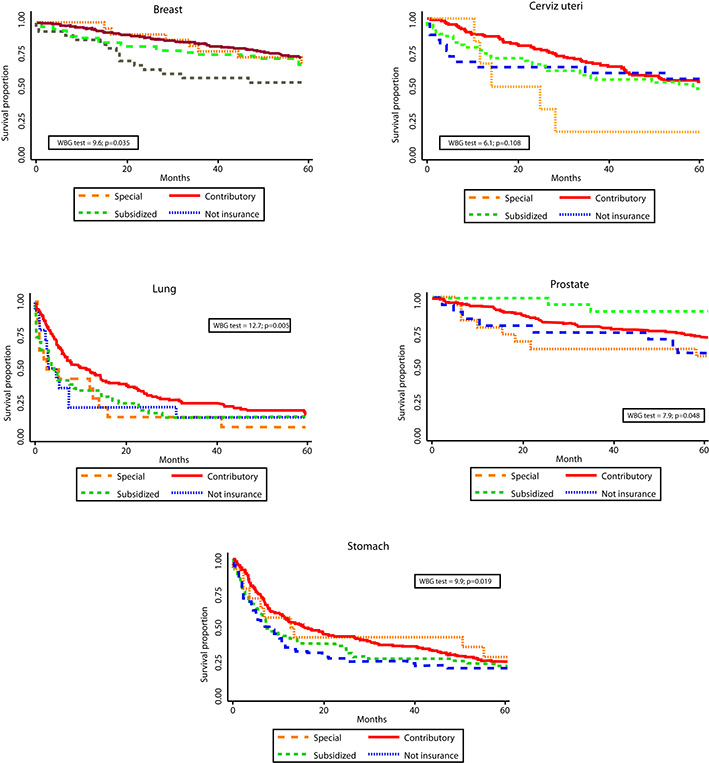
Figure 1 Observed survival by health insurance regime and cancer site. Manizales, 2003-2013. WBG: Wilcoxon-Breslow-Gehan test.
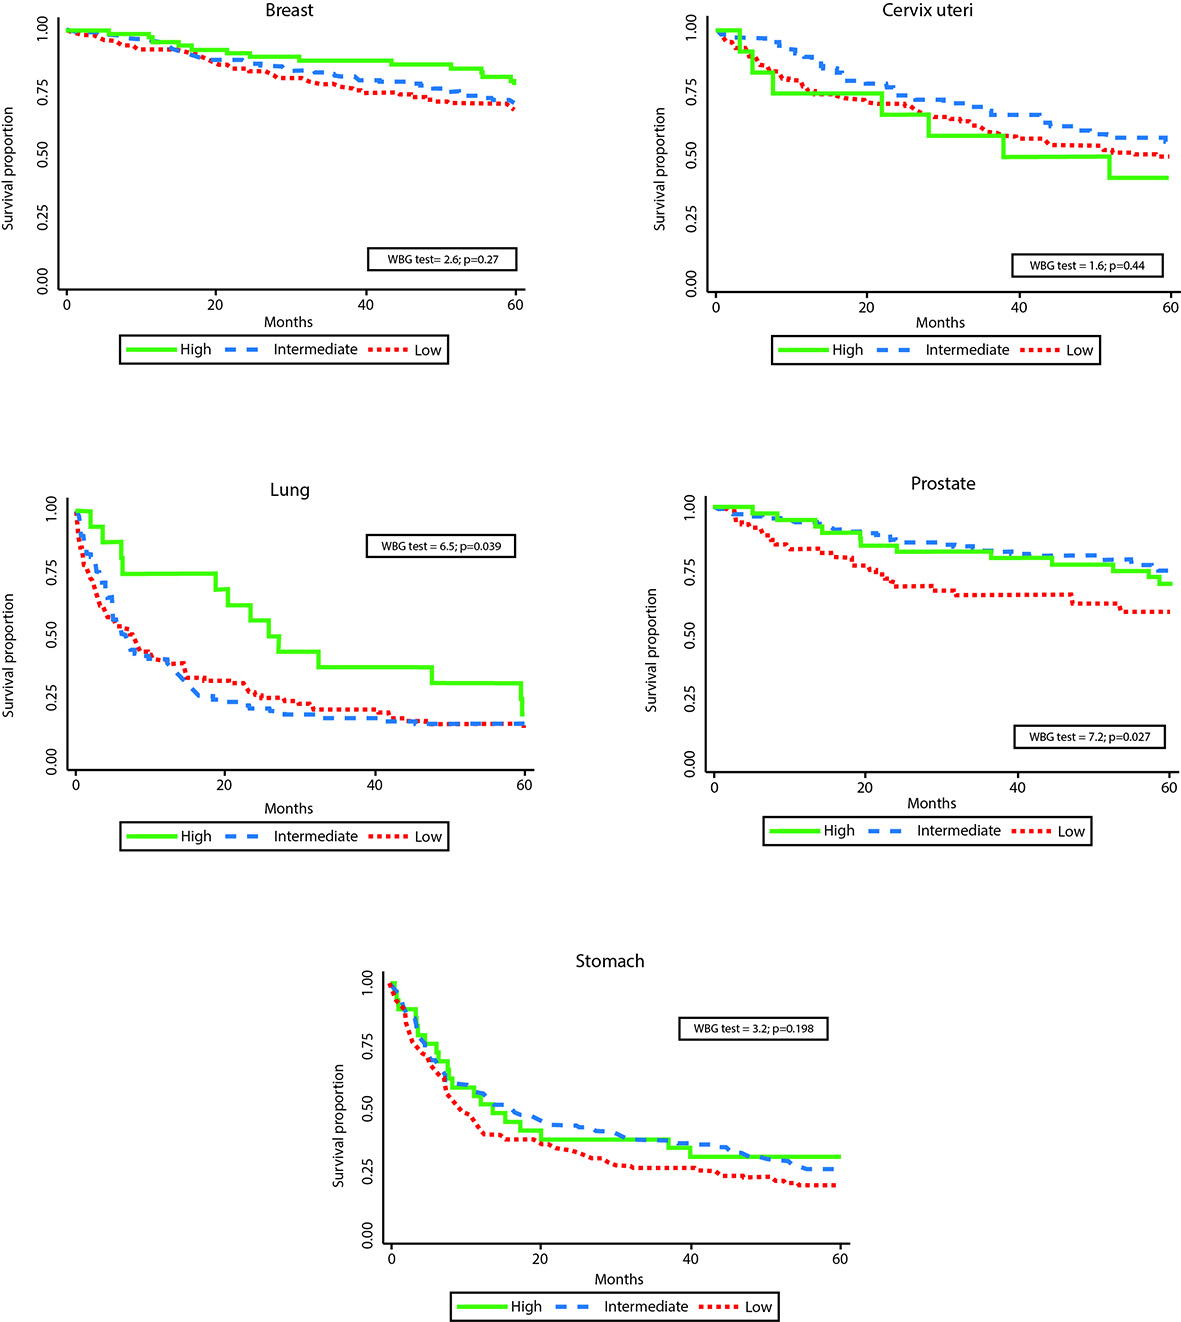
Figure 2 Observed survival by social strata and by cancer site. Manizales, 2003-2013. WBG: Wilcoxon-Breslow-Gehan test.
As expected, overall survival was higher in younger patients for all sites studied, but those differences were not statistically significant. According to literature, clinical stage at diagnosis showed a strong association with survival (Table 1 and Fig. 3). Survival was better for women diagnosed with ductal breast carcinoma vs. other histological subtypes. Non-significant differences in survival were observed by histological subtypes of cervix, lung, prostate and stomach cancers. For lung and stomach cancers no survival differences by sex were observed.
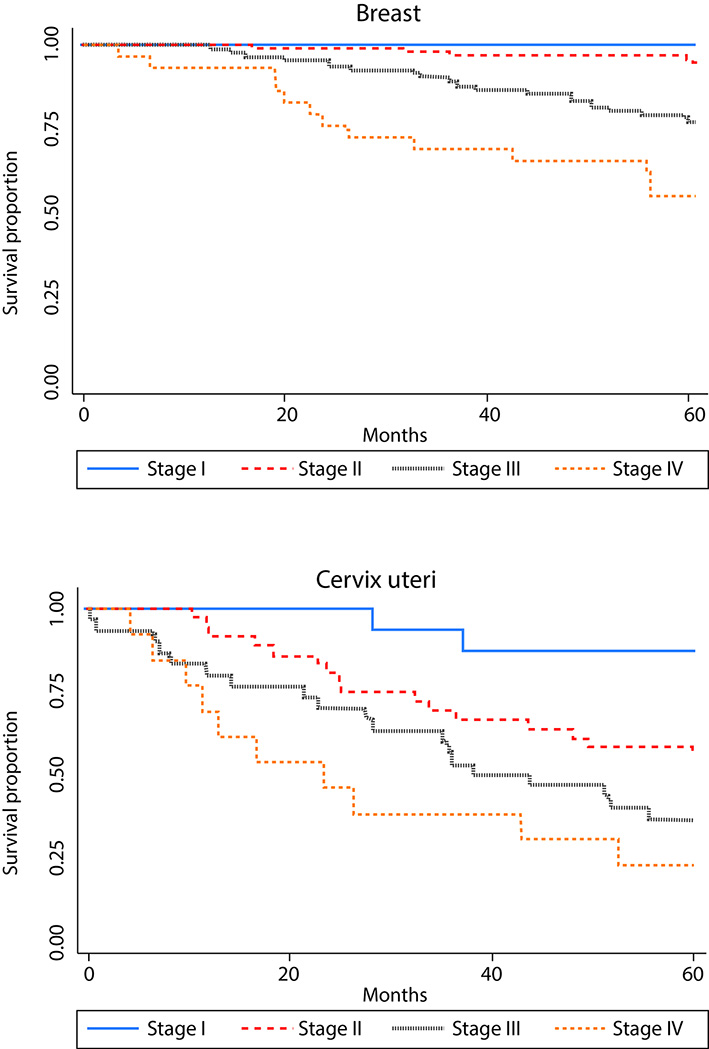
Figure 3 Survival proportion by clinical stage at diagnosis for breast cancer (based on 233 cases with known clinical stage) and cervix uteri cancer (based on 95 cases). Manizales, 2003-2013.
Table 2 shows results from Cox models by HIR and SS and by cancer site. For prostate cancer, HIR hazard ratios (HR) remained significant after adjusting for age and histological subtype, with lower hazard of dying for special HIR group in comparison with the subsidized regime (HR: 0.17 (95% IC: 0.04-0.80)). These results remained significant in multivariate analyses. For stomach cancer, patients in contributory regime had better survival in all, univariate and multivariate, models, with about 30% lower hazard of dying in comparison with patients in subsidized HIR. With respect to socioeconomic position, prostate cancer patients from middle SS showed about 47% lower hazard of dying than patients from low SS (HR 0.53, 95% CI: 0.31-0.88), independently of health insurance regime. Other sites did not reach statistical significance, possibly due to the low number of cases in each group.
Table 2 Proportional risks (Cox) survival models by cancer site.
| Univariate analysis | Multivariate analysis | ||||||
|---|---|---|---|---|---|---|---|
| HR | 95% CI | Model A | Model B | ||||
| HR | 95% CI | HR | 95% CI | ||||
| Breast cancer | Health insurance * | ||||||
| Contributory | 0.77 | 0.47-12.7 | 0.71 | 0.43-1.17 | 0.77 | 0.44-1.36 | |
| Special | 0.89 | 0.38-2.09 | 0.47 | 0.20-1.13 | 0.52 | 0.20-1.34 | |
| Not insured | 1.66 | 0.84-2.26 | 1.27 | 0.64-2.55 | 1.41 | 0.65-3.07 | |
| Cases (events) | 370 (108) | 370 (108) | 345 (99) | ||||
| Social Strata a | |||||||
| Middle | 0.88 | 0.57-1.35 | 0.75 | 0.48-1.17 | 0.93 | 0.56-1.55 | |
| High | 0.61 | 0.33-1.14 | 0.65 | 0.35-1.21 | 0.84 | 0.42-1.65 | |
| Cases (events) | 347 (99) | 347 (99) | 345 (99) | ||||
| Cervical cancer | Health insurance * | ||||||
| Contributory | 0.78 | 0.51-1.22 | 1.76 | 0.85-3.64 | 2.12 | 0.99-4.55 | |
| Special | 2.20 | 0.85-5.68 | 5.02 | 1.69-14.9 | 7.60 | 1.94-29.7 | |
| Not insured | 0.92 | 0.46-1.81 | 0.94 | 0.25-3.58 | 0.90 | 0.23-3.51 | |
| Cases (events) | 217 (104) | 92 (46) | 87 (43) | ||||
| Social Strata a | |||||||
| Middle | 0.78 | 0.50-1.22 | 0.91 | 0.47-1.76 | 0.67 | 0.32-1.41 | |
| High | 1.20 | 0.55-2.62 | 0.84 | 0.19-3-65 | 0.38 | 0.08-1.87 | |
| Cases (events) | 197 (95) | 88 (44) | 87 (43) | ||||
| Lung cancer | Health insurance * | ||||||
| Contributory | 0.69 | 0.47-1.02 | 0.75 | 0.51-1.12 | 0.89 | 0.58-1.36 | |
| Special | 1.15 | 0.61-2.19 | 1.22 | 0.64-2.32 | 1.28 | 0.66-2.49 | |
| Not insured | 1.04 | 0.54-2.01 | 1.32 | 0.66-2.62 | 1.77 | 0.83-3.77 | |
| Cases (events) | 197 (165) | 197 (165) | 186 (157) | ||||
| Social Strata a | |||||||
| Middle | 1.00 | 0.72-1.39 | 0.99 | 0.71-1.38 | 1.03 | 0.74-1.46 | |
| High | 0.58 | 0.32-1.05 | 0.60 | 0.33-1.09 | 0.67 | 0.36-1.24 | |
| Cases (events) | 186 (157) | 186 (157) | 186 (157) | ||||
| Prostate cancer | Health insurance * | ||||||
| Contributory | 0.58 | 0.28-1.21 | 0.56 | 0.27-1.18 | 0.56 | 0.26-1.21 | |
| Special | 0.17 | 0.04-0.80 | 0.20 | 0.04-0.95 | 0.12 | 0.02-0.99 | |
| Not insured | 0.89 | 0.33-2.37 | 0.74 | 0.27-2.02 | 0.81 | 0.27-2.41 | |
| Cases (events) | 266 (77) | 266 (77) | 233 (70) | ||||
| Social Strata a | |||||||
| Middle | 0.52 | 0.31-0.87 | 0.53 | 0.31-0.88 | 0.54 | 0.32-0-92 | |
| High | 0.63 | 0.32-1.26 | 0.71 | 0.36-1.44 | 0.78 | 0.38-1.60 | |
| Cases (events) | 237 (71) | 237 (71) | 233 (70) | ||||
| Stomach cancer | Health insurance * | ||||||
| Contributory | 0.72 | 0.52-0.98 | 0.71 | 0.52-0.98 | 0.70 | 0.51-0.98 | |
| Special | 0.70 | 0.36-1.38 | 0.72 | 0.36-1.41 | 0.75 | 0.38-1.50 | |
| Not insured | 0.93 | 0.62-1.39 | 0.93 | 0.62-1.39 | 1.01 | 0.65-1.56 | |
| Cases (events) | 320 (243) | 320 (243) | 289 (221) | ||||
| Social Strata a | |||||||
| Middle | 0.80 | 0.61-1.06 | 0.80 | 0.60-1.05 | 0.82 | 0.62-1.09 | |
| High | 0.75 | 0.46-1.20 | 0.76 | 0.47-1.23 | 0.89 | 0.55-1.45 | |
| Cases (events) | 291 (222) | 291 (222) | 289 (221) | ||||
* Subsidized regime as reference a Low strata as reference. Models were adjusted by age, sex (lung and stomach), histological subtype, and stage at diagnosis (breast and cervix).
Unsurprisingly, advanced clinical stages for breast and cervix had increased HRs. In line with the Kaplan-Meier results, cervical cancer patients affiliated to the special regime had a higher hazard than women affiliated to the subsidized regime after adjusting by age, histological subtype and clinical stage.
Model B showed that inclusion of both terms HIR and SS in the same model modified HR estimates in all cancers combined and by cancer site, indicating independent effects of HIR and SS on survival.
Discussion
This population-based study on population-based survival for five cancer sites in Manizales, Colombia, demonstrated significant differences in observed survival. Differences by HIR varied from 8 percent-points in stomach to 32 percent-points in prostate cancer. Hazard Ratios estimated for HIR were in line with risks reported in other studies 1. Absolute differences by SS were less noticeable, with differences between low versus high categories of about 16 percent-points for prostate, 10 for breast, 14 for cervix, 5 for lung, and 11 percent-points for stomach cancers. The magnitude of these disparities is similar with those found in U.S for the last quarter of the past century 24.
Colombian health system was radically reformed at the end of the last century, resulting in a substantial increase in coverage of health insurance which reached almost 100% around 2010. On paper, this meant a substantial improvement in access to health services. However, timely access to health care in cancer diagnosis and treatment is still problematic, particularly because of the high out-of-pocket cost and long waiting times to obtain permission to use these services. In Colombia, access to health care is differential according to the health insurance regime, and inequities persist between types of affiliation. Local researchers have pointed out that universality in National Health System has not been achieved and there has been a stagnation in matters regarding access to services and equality 25. Additionally, enormous regional disparities have been described in Colombia, and the country has one of the worst distributions of per capita income in the world 26.
In general, 5-year OS by site was below that observed for most countries in the CONCORD 27 and EUROCARE 28 studies. Disparities by HIR and SS for breast, prostate and stomach cancers were similar to reported by literature 29-33).
The survival proportion for women with a cancer of the cervix uteri was 3-fold lower among women affiliated to the special regime compared to the other HIR groups. This surprising results - special regimes have, in theory, the most generous health care plan - are in line with the observation of the worst stage at diagnosis in this group, which suggest that screening and early detection programs are not properly working in special regime entities. Regarding socioeconomic stratification, survival rates or cervical cancer were 7 and 14 percent-points higher in low and middle social strata, respectively, in comparison with the richest group. Incidence rates were lower in the richest group, and the relative low frequency of disease among the wealthiest part of the population may result in a lower awareness or lower participation rates in screening and early treatment programs for cervical cancer. However, differences in clinical stage at diagnosis did not reach statistical significance - perhaps because number of cases in the high strata was very low (see supplementary table). In this regard, Brookfield et al. (34, found that, in women living in the state of Florida (USA), the independent predictors of poorer outcomes were insurance status, tumor stage, tumor grade, and treatment. Neither race, nor ethnicity, nor SES was an independent predictor of poorer outcome. Similarly, Niu et al. (35, found no significant differences in cervical cancer survival by insurance status in New Jersey.
For lung cancer, 2.3 and 2-fold better survival rates were observed in patients from contributory, subsidized and non-insured categories in comparison with special regimes. These results are contradictory with those reported in US 36 where uninsured and Medicaid patients had poorer survival than patients with private insurance. This pattern may be reflecting barriers to early diagnosis and treatment in this subgroup, which in Manizales is mostly composed by teachers, and army and police members. However, this should be confirmed by studies with a larger number of patients. Survival proportions were around five percent-points lower in the lowest socioeconomic stratum in comparison with the most affluent group, which is consistent with figures reported by Ou et al37.
Disparities in cancer survival related to the health system can be attributed to barriers and delays in obtaining diagnostic care, associated with more advanced stages at diagnosis. In Colombia, practically all medical procedures require authorization from the insurer, which in many cases lead to substantial diagnostic and treatment delays and - consequently - to more advanced stages in diagnosis and poorer outcomes 38,39. Therefore, many people turn to the out-of-pocket payment of some services to avoid delays, but people with low financial resources have no other avenues for access to timely diagnosis and treatment and are subject to the administrative procedures of their insurers.
Strengths and weaknesses
The population-based nature of this work minimizes selection biases in the estimates and serves as a tool for policy-makers to evaluate access and quality of care. Although numbers of patients are relatively small due to the small population size of Manizales, estimates are sufficiently robust to discern general patterns. A major limitation of this study is the lack of relative or net survival estimations by HIR and SS due to lack of available data on population numbers and life-tables by those variables. The registry had no access to the cause of death, making it impossible to calculate cause-specific survival. For cancers with a very poor prognosis, this is not so problematic as most patients will die due to their cancer. However, for cancers with a relatively good prognosis (e.g. breast and prostate), a substantial proportion of deaths may have been due to other causes of death. Considerable proportions of cases had unknown data about SS, specially for cervix, prostate and stomach cancers (12.2%, 13.1% and 11.0%, respectively). In addition, the percentage of cases with missing data for clinical staging at diagnosis was high for all cancers, except breast and cervical cancer: more than 70% of lung, prostate and stomach cancer cases had no stage information, impeding including this variable in the multivariate analyses. The number of cases was very low in some cancer sites and affected multivariate analysis. Around 5% of patients were excluded from analyses because they had no follow-up time (DCO cases and lost-to-follow-up at date of diagnosis), which theoretically could influence findings, as more DCO cases are expected among the lower socioeconomic groups. However, a recent paper showed that, even though DCO diagnosis is associated with low SS, exclusion or inclusion of DCO cases had no significant impact of hazard ratios for survival by socioeconomic variables 40.
Conclusions
Important inequities in cancer survival exist in Manizales related to health insurance and socioeconomic position. Differences may be attributed to inequities in comorbidities, stage at diagnosis, or barriers to timely access to effective treatment suggested by differences observed between health insurance regimes.

