


 English (pdf)
 Article in xml format
 Article references
 Send this article by e-mail
 Cited by SciELO
  Cited by Google
  Similars in
SciELO
Similars in
SciELO  Similars in Google
 Permalink
Remark
| 1) Why was this study conducted? |
| The study was conducted due to the few evidence on the characteristics of some electrocardiographic markers of the ventricular repolarization in children and the association with clinical variables. |
| 2) What were the most relevant results of the study? |
| The most relevant results of the study was to demonstrate that in children, there was a significant linear correlation between the Tpeak-Tend/QT V5 with the body mass index and the systolic blood pressure values and that the growing age of patients and systolic blood pressure values are factors that increase the probability of having values of Tpeak-Tend/QT V5 ≥ 75th percentile. |
| 3) What do these results contribute? |
| The results of this study contribute to increase our knowledge about the characteristics of ventricular repolarization in children and give new insights for future research projects with new ventricular repolarization markers and the possible association with clinical outcomes. |
Introduction
Currently, there are electrocardiographic markers for the study of ventricular repolarization that have been explored in several clinical settings. One of these markers is the Tpeak-Tend (Tp-e). Tp-e is a reflection of the transmural dispersion of repolarization of the myocardial cells 1. The action potential of the M cells of the cardiac muscle is prolonged more than that of the epicardial or endocardial cells, due to a decrease in the heart rate or in response to drugs that prolong the duration of the action potential. The temporal differences of the repolarization of these three cell types of the ventricular myocardium determine the inscription of the T wave in the ECG (2.
The prolongation of Tp-e is associated with an increased risk of general cardiovascular mortality (3 and in specific conditions in which there is an increased vulnerability for the development of cardiac arrhythmias such as long QT syndrome (4, Brugada syndrome (5, myocardial ischemia (6, and cardiomyopathies (7.
Recently have been proposed two new parameters for the study of ventricular repolarization based on the Tp-e. The first of these is the dispersion of the Tp-e (Tp-e d), which is obtained by finding the difference between the maximum and the minimum Tp-e in the six precordial leads of the ECG. This marker has proven to be useful in predicting malignant ventricular arrhythmias in patients with Brugada syndrome (5. The second is the Tp-e/QT ratio, which integrates the values of the transmural dispersion of repolarization measured by Tp-e and the spatial dispersion through the QT interval. This parameter does not need to be corrected by heart rate like others and has demonstrated to be useful in predicting ventricular arrhythmias in several clinical settings (8.
Nowadays, the number of studies that explore these parameters of ventricular repolarization in pediatric patients is limited, so the possibility to study these markers in the pediatric population could show us new evidence of this complex topic.
Material and Methods
This study was conducted, as part of the PROCDEC III Study, which was developed at the Camilo Cienfuegos School from Santa Clara, Cuba from November 2015 to December 2016. It is a cross-sectional study of 126 healthy children between nine and 12 years. All children of these ages were given a form where clinical and sociodemographic variables were collected and completed by the parents.
Anthropometric measurements such as height and weight were taken with correctly calibrated height meters and scales. The body mass index was determined by the formula: weight (kg)/height (m)2.
Each child received three blood pressure measurements at different times. Qualified personnel took the blood pressure measurements, with digital blood pressure equipment correctly calibrated and with the appropriate bracelets to the circumference of the arm. The recommendations for taking blood pressure for patients of these ages were respected, with adequate lighting, ventilation and the previous rest of at least 10 minutes. All children included in the study had blood pressure values <95 percentile for their age, sex and height. An average of the three measurements was obtained to define the values of systolic and diastolic blood pressure. The mean arterial pressure was calculated by the formula: PAS- 2(PAD)/3 and pulse pressure: PAS-PAD. The blood pressure variables are expressed in millimeters of mercury (mmHg).
A 12-lead surface ECG was performed on all the patients, which were digitized for further analysis and interpretation. An expert who guaranteed the proper performance of the same obtained the ECGs in the supine position. The electrocardiograph used was a CARDIOCID BB made in Cuba. All ECGs were obtained with a speed of 25 mm/sec and a voltage of 1 mV= 10 mm. The measurements were performed using a digital caliper, provided by the authors of the research. We excluded ECGs with artifacts or in which it was impossible to measure the parameters of ventricular repolarization in at least 10 leads. The Tp-e was obtained in lead V5 of the ECG from the peak or nadir of the T wave to the end of the same. It was calculated the difference between the maximum and minimum Tp-e in the six precordial leads for Tp-e d. While Tp-e/QT was obtained calculating the ratio between the Tp-e and the QT interval in the V5 lead, without performing the correction for the heart rate. All the electrocardiographic parameters were expressed in milliseconds (ms).
The laboratory variables were obtained by conducting a single extraction of fasting blood. The samples were analyzed by conventional methods and expressed by the International System of Units.
Subjects with a history of congenital heart disease or other chronic non-communicable diseases, incomplete data in clinical histories, the impossibility to perform any of the planned tests and ECGs with artifacts or other conditions that made it impossible to perform planned measurements were excluded.
Processing and analysis of data
The absolute and relative frequencies of the qualitative variables were determined. The t-Student test to compare means was used. The normal distribution of the quantitative variables by the Kolmogorov-Smirnov test was proved. The values were expressed as the mean (x) and standard deviation (SD).
The values corresponding to the percentiles 5, 25, 75 and 95 were calculated for the Tp-e V5, its dispersion and the Tp-e/QT V5. A model of binary logistic regression was performed and the OR was calculated from several clinical variables to determine the probability for having Tp-e/QT V5 values higher than the fourth quartile. To determine the relationship between the Tp-e/QT and some clinical variables Pearson´s linear correlation test was used. A p-value <0.05 was considered statistically significant.
All the data were analyzed and processed in the statistical package SPSS version 21.0 for Windows.
Research ethics
Each parent or guardian of the participating children was explained through a written document the purposes of the research and the studies to be carried out on each child. Each parent or guardian approved the incorporation of the children into the study by signing the informed consent document attached to the survey of the investigation. The study was approved by the Ethics Committee of the participating institutions.
Results
Table 1 shows that the average age of the patients is 10.02 ± 1.38 years. The mean systolic blood pressure and body mass index are 104.83 ± 9.83 mmHg and 19.11 ± 3.58 kg/m2 respectively.
Table 1 Clinical, anthropometric and laboratory variables in the population
| Variables | |
|---|---|
| Age (years) x; SD | 10.02 ± 1.38 |
| Male sex n; % | 65 (51.6) |
| Whites n; % | 86 (68.3) |
| Weight of birth (g) x; SD | 3542.82 ± 589.60 |
| Weight (kg) x; SD | 39.53 ± 9.63 |
| Height (m) x; SD | 143.19 ± 8.88 |
| BMI (kg/m2) x; SD | 19.11 ± 3.58 |
| SBP (mmHg) x; SD | 104.83 ± 9.83 |
| DBP (mmHg) x; SD | 60.91 ± 7.48 |
| MAP (mmHg) x; SD | 76.28 ± 9.19 |
| PP (mmHg) x; DS | 43.92 ± 7.00 |
| HR (lat/min) (mmHg) x; SD | 81.56 ± 16.07 |
| Glycaemia (mmol/L) x; SD | 4.66 ± 0.73 |
| Creatinine (mmol/L) x; SD | 45.79 ± 10.37 |
| Uric acid (mmol/L) x; SD | 278.05 ± 80.47 |
| Cholesterol (mmol/L) x; SD | 4.17 ± 0.93 |
| Tryglicerides (mmol/L) x; SD | 1.25 ± 0.58 |
BMI: body mass index, SBP: systolic blood pressure, DBP: diastolic blood pressure, MAP: mean arterial pressure, PP: pulse pressure, HR: heart rate
Table 2 shows that there are not significant differences after comparing the electrocardiographic parameters in males and females, Tp-e V5 (79.95 ± 9.98 ms vs. 78.94 ± 13.06 ms; p= 0.627), Tp-e d (34.63 ± 15.20 ms vs. 32.34 ± 14.76 ms; p= 0.393) and Tp-e/QT V5 (0.23 ± 0.02 vs. 0.23 ± 0.03; p= 0.616) respectively.
Table 2 Tp-e, Tp-e d, and Tp-e/QT according to sex
| Variables | Female | Male | p |
|---|---|---|---|
| Tp-e V5 (ms) | 78.94 ± 13.06 | 79.95 ± 9.98 | 0.627 |
| Tp-e d (ms) | 32.34 ± 14.76 | 34.63 ± 15.20 | 0.393 |
| Tp-e/QT V5 | 0.23 ± 0.03 | 0.23 ± 0.02 | 0.616 |
Table 3 reflects that the values of 95 percentile for Tp-e and Tp-e/QT V5 are higher in female subjects (101.52 ms and 94.92 ms and 0.29 and 0.28) respectively. The 95 percentile values for Tp-e d are higher in males (68.13 ms vs. 56.17 ms).
Table 3 Percentiles of Tp-e, Tp-e d, and Tp-e/QT according to sex
| Variables | 5P | 25P | 75P | 95P |
|---|---|---|---|---|
| Tp-e V5 (ms) | 58.34 | 70.60 | 88.14 | 98.31 |
| F | 56.72 | 68.75 | 88.14 | 101.52 |
| M | 64.56 | 73.33 | 88.14 | 94.92 |
| Tp-e d (ms) | 13.33 | 23.73 | 40.67 | 59.49 |
| F | 13.33 | 23.56 | 40.53 | 56.17 |
| M | 11.47 | 25.20 | 40.72 | 68.13 |
| Tp-Te/QT V5 | 0.19 | 0.22 | 0.26 | 0.29 |
| F | 0.18 | 0.21 | 0.26 | 0.29 |
| M | 0.19 | 0.22 | 0.25 | 0.28 |
F: Female; M: Male
Table 4 shows that age and systolic blood pressure values are associated with an increased probability of having values of Tp-e/QT V5 greater than 75 percentile (0.26) in both sexes (OR: 1.72, CI: 1.02 -2.91; p= 0.043) and (OR: 1.08, CI: 1.01-1.16; p= 0.017) respectively.
Table 4 Logistic regression for Tp-e/QT V5 > 75p
| Variables | OR | CI | p |
|---|---|---|---|
| Male | 1.42 | 0.38-5.33 | 0.603 |
| Age (years) | 1.72 | 1.02-2.91 | 0.043 |
| BMI (kg/m2) | 1.04 | 0.87-1.23 | 0.681 |
| SBP (mmHg) | 1.08 | 1.01-1.16 | 0.017 |
| Uric acid (mmol/L) | 1.01 | 1.00-1.02 | 0.103 |
BMI: body mass index, SBP: systolic blood pressure
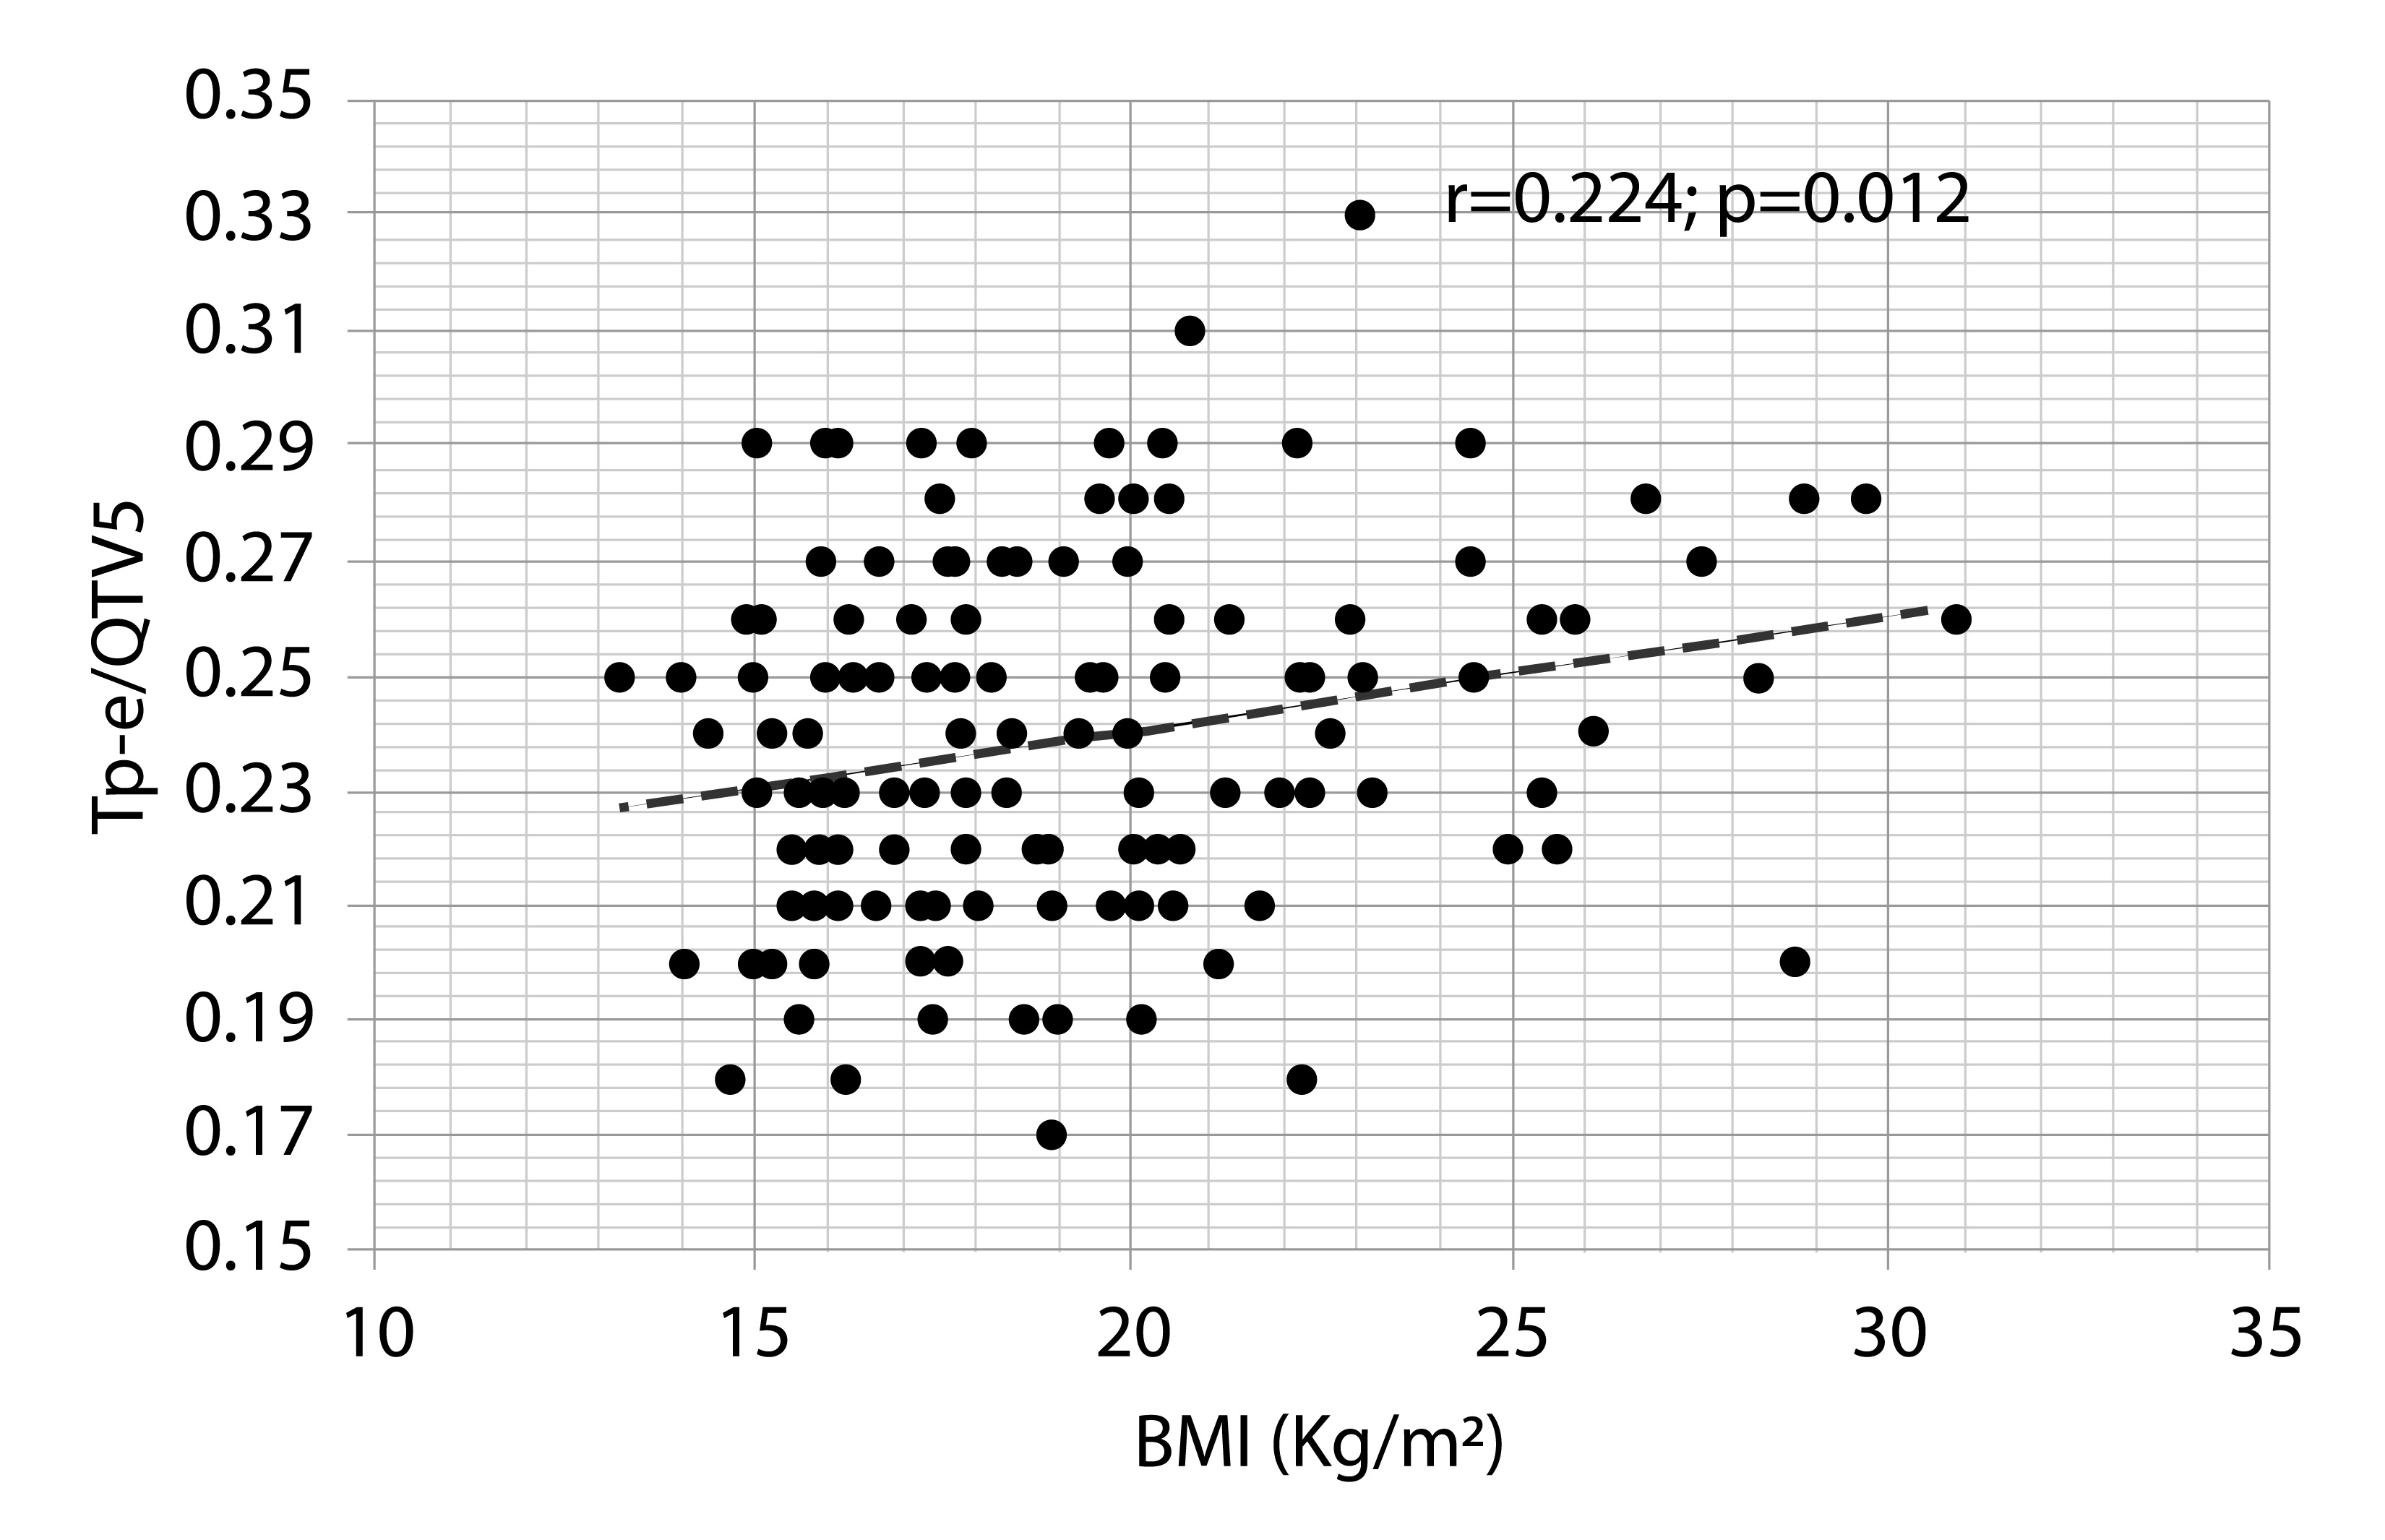
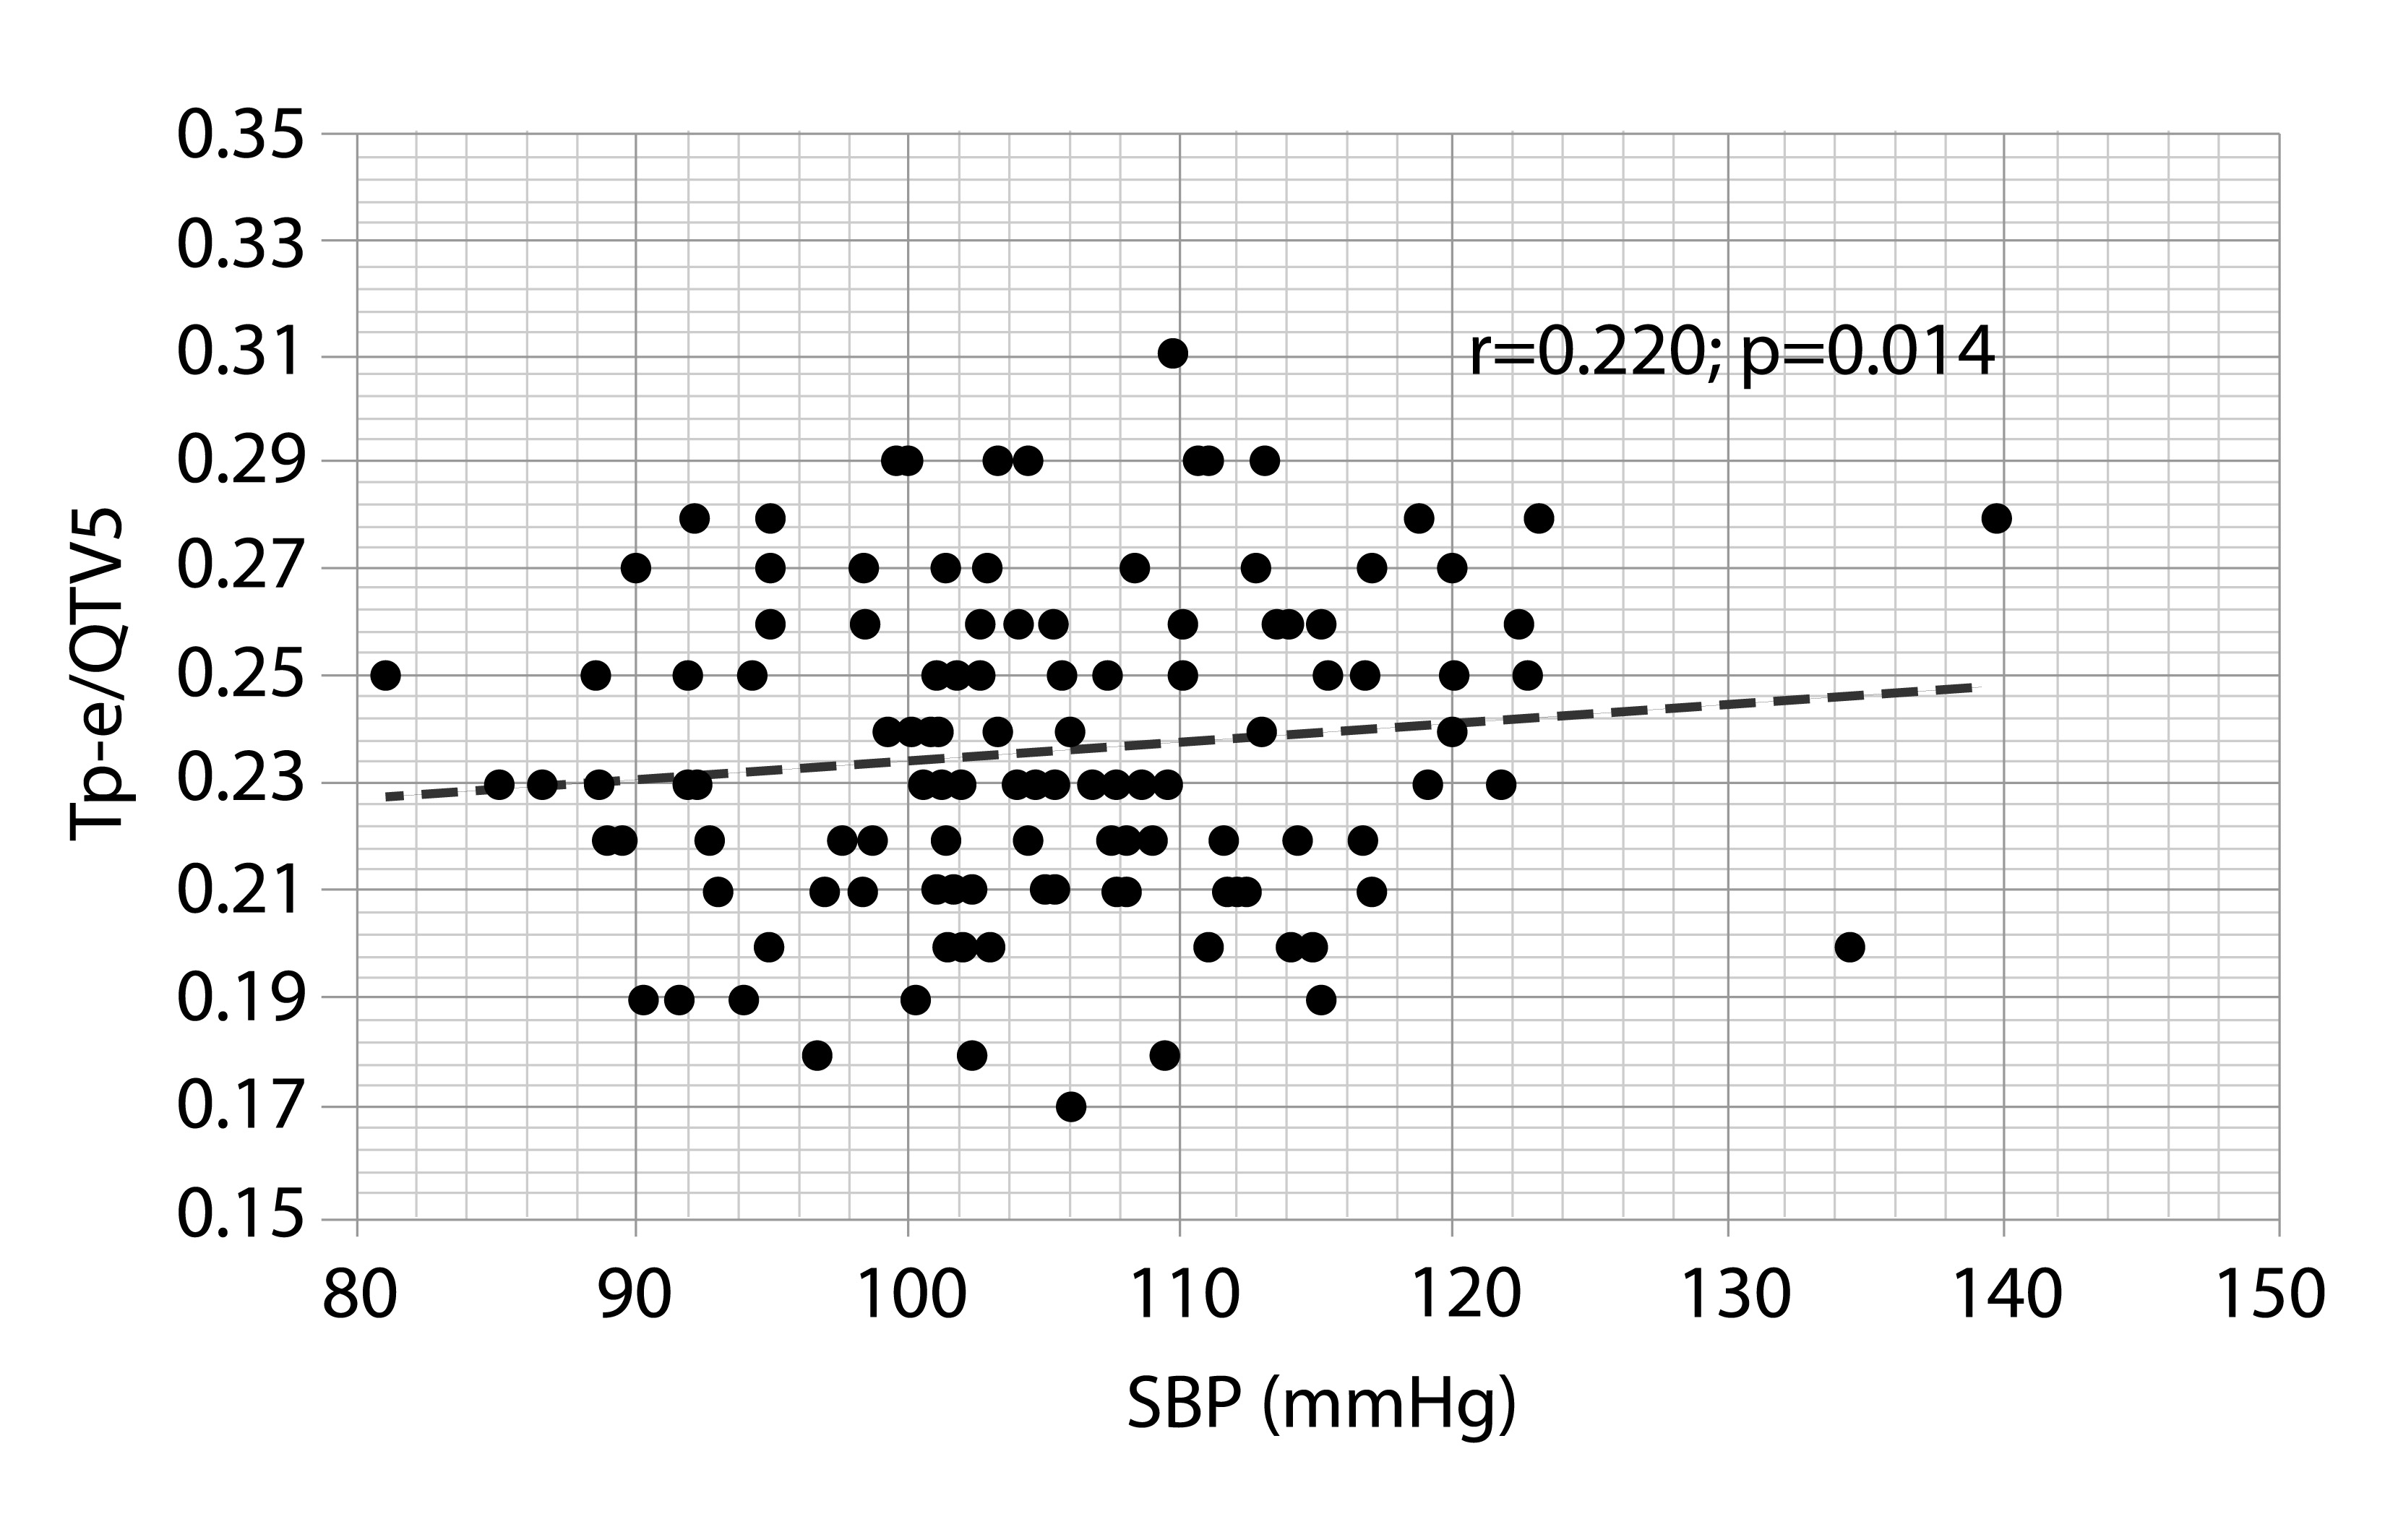
Both Figures 1 and 2 show that there is a linear and significant correlation between the body mass index and systolic blood pressure and Tp-e/QT V5 (r= 0.224; p= 0.012) and (r= 0.220; p= 0.014) respectively.
Discussion
The present investigation carried out a characterization of some parameters of Tp-e in healthy children. Tp-e, Tp-e d, and Tp-e/QT are ventricular repolarization markers that have proven to be useful for the prediction of malignant ventricular arrhythmias in several clinical settings. However, in pediatric patients, there are few studies on these parameters and their relationship with clinical variables.
A study published by Braschi et al. in 606 patients demonstrate that the mean for the Tp-e in V5, Tp-e d and Tp-e/QT V5 in female and male patients between the ages of 9 and 11 are (83.6 ± 7.3 ms vs. 84.1 ± 9.1 ms), (22.3 ms ± 10.2 ms vs. 27.7 ± 8.1 ms) and (0.22 ± 0.02 vs. 0.22 ± 0.02) respectively. In this study, the values of the 25 and 75 percentiles for the Tp-e in V5, Tp-e d, and Tp-e/QT V5 are (80 ms, 90 ms); (20 ms, 30 ms); (0.21, 0.23) respectively (9. In our investigation, the mean, the 25 and 75 percentiles of the Tp-e in V5 are lower than those observed in the previous study, while for the rest of the parameters the values are higher. The differences observed in these studies may be related to differences in patient age, sex, sociodemographic characteristics and even hereditary factors that have been demonstrated to be associated with Tp-e values (10. The variety of factors or circumstances that can modify the values for these parameters generates difficulties in determining reference values that can be used universally. Moreover, the sample size of the studies published on this subject is insufficient to reach definitive conclusions.
Figures 1 and 2 show that there is a significant linear correlation between the body mass index and systolic blood pressure with the Tp-e V5, and the logistic regression analysis shows that the systolic blood pressure values increase the probability of presenting Tp-e/QT values above the 75 percentile of normality. Overweight, obesity and high blood pressure are risk factors that favor the development of cardiovascular morbidity and mortality. The parameters of Tp-e are prolonged in overweight or obese patients compared with normal-weight patients in both adults and children. A study in 120 adult patients shows that Tp-e, Tp-e d, and Tp-e/QT V5 have values significantly higher in obese compared to normal weight or overweight patients (11. Another study shows that Tp-e is significantly higher in obese compared to normal-weight children (100.7 ± 16.3 ms vs. 83.2 ± 13.5 ms; p <0.05) (12. Even in the absence of other heart diseases, obesity favors the development of changes in the electrophysiological properties of cardiac cells that influence the development of ventricular arrhythmias (13. Other processes such as hyperinsulinemia, glucose intolerance and autonomic dysfunction may accentuate these changes and modify some ventricular repolarization parameters (14.
Hypertension is a major cardiovascular risk factor and high blood pressure values show a direct relationship with cardiovascular complications, including cardiac arrhythmias (15. Demir et al. found that hypertensive patients classified as non-dipper by ambulatory monitoring of blood pressure had higher values of Tp-e and Tp-e/QT compared with dipper patients (97.5 ± 11.2 ms vs. 84.2 ± 8.3 ms and 0.23 ± 0.02 vs. 0.17 ± 0.02; p <0.001) respectively (16. Another study reflects that Tp-e correlates with the values of systolic blood pressure and left ventricular hypertrophy (17.
Left ventricle hypertrophy is the main factor related to an arrhythmic vulnerability in hypertensive patients. The hypertrophy of the left ventricle creates zones in the cardiac muscle with different electrophysiological properties that favor the development of ventricular arrhythmias, favored by infiltration of interstitial collagen, fibrosis, and subendocardial ischemia (18.
In our study, there are no hypertensive patients, but subjects with blood pressure values between 90 and 95 percentile were included for their age, sex and height, which are classified as pre-hypertensive or with high blood pressure. It has been shown that in these stages there are already morphological changes in the heart and even signs of left ventricular hypertrophy (19. Although in our study we did not evaluate the existence of left ventricular hypertrophy, the relationship between the systolic blood pressure and the Tp-e/QT V5 may be related to the existence of pre-hypertensive patients with morphofunctional alterations that favor the prolongation of these parameters of ventricular repolarization.
Our investigation has some limitations such as 1) the relatively small sample size that makes it difficult to draw definitive conclusions about the reference values of the parameters assessed, 2) The cross-sectional design of the study, which makes it impossible to determine the clinical significance of our observations, 3) no studied echocardiographic parameters or other imaging studies that will help us to identify possible morphological changes in certain patients with prolonged values of these parameters and, 4) the correlations obtained were significant but weak.
Despite these limitations, this research is the first to perform a characterization of ventricular repolarization through Tp-e in children and its relationship with clinical variables. This will allow a better understanding of the variations observed in these parameters in medical practice and will help to carry out further studies that evaluate the true role that may or may not have in the risk stratification of patients with increased risk of ventricular arrhythmias.
Conclusions
There are no differences between the Tp-e values and parameters derived in both sexes. There was a significant linear correlation between the Tp-e/QT V5 with the body mass index and the systolic blood pressure values. The growing age of patients and systolic blood pressure values are factors that increase the probability of having values of Tp-e/QT V5 ≥ 75th percentile.

