


 text in
  English (pdf)
 Article in xml format
 Article references
 Send this article by e-mail
 Cited by SciELO
  Cited by Google
  Similars in
SciELO
Similars in
SciELO  Similars in Google
 Permalink
Remark
| 1)Why was this study conducted? |
| This study was conducted to determine if the DANE Infant Mortality projections for 2009 were in accordance with the reality of the country, since different secondary sources showed lower results for the same year. |
| 2) What were the most relevant results of the study? |
| We found that the DANE Vital Statistics system implemented in 1998 was consistent from 2001, and that coverage of delivery in Colombia had increased, with 98% coverage reported by the Ministry of Health for that year. With these considerations and the under-registered, we did a matrix of infant mortality rates and calculated the individual records of vital statistics for each under-registered. The projection of the infant mortality rate was close to seventeen deaths per thousand live births, similar to the reported by the national demographic and health survey (ENDS 2010. |
| 3) What do these results contribute? |
| These results allowed the revision of the estimation of the infant mortality rates by DANE and also, to analyze the databases that were going to be used as a source of information for the doctoral thesis: Situation of infant mortality in Colombia, considering that the years with better information were from 2001 to 2009 (now also subsequent ones). |
Introduction
The infant mortality rate, is the number of deaths of infants under one year old per 1,000 live births, it is a key indicator of human welfare and development 1-4, and is the fourth indicator of the Millennium Development Goals (MDG) 5-8
It has been subject to inconsistent measurement and estimation in Colombia. On the other side, the Departamento Administrativo Nacional de Estadística in Colombia (DANE) reports a registered Infant mortality rate of 13.69 per for 2009 9,10 and estimates the actual rate to be 20.13 for the 1,000 same year 11. The Association for Family Welfare in Colombia, Profamilia, reports an Infant mortality rate of 16.00 for the period 2005-2010 12.
These disparities are associated with high levels of underreporting of live births and infant deaths. The Colombian Ministry for Health and Social Protection suggests that the infant mortality rate measurements and estimates before and after 1998 are not compatible because the sources of information about births are different and inconsistent 13,14.
This study aims to reconcile the different measurements and estimates, using all available data. The investigation comprises four analyses: (a) a new examination of the registered infant mortality rate, (b) a re-estimation of DANE’s estimated rate; (c) an establishment of the inconsistency between the two; and finally (d) a reconciliation of all data sources including other data and studies, as well as relevant Latin American experience.
The objective was to evaluate the infant mortality rate in Colombia, 1980-2009.
Materials and Methods
Data and setting
Cross sectional study on infant mortality rates in Colombia during the period 1979 and 2009. The study used data and indicators from different sources. All children born alive, but died before the first year of age, were selected for each of the years between 1979 and 2009.
The complete vital statistics data on live births and infant deaths were supplied by DANE as well. These include Colombia’s complete 443,338 records of infant deaths for 1979-2009, all 8,636,510 records of live births for 1998-2009 and data on women 15-49 years old by age groups based on the 1993 and 2005 population censuses. DANE’s estimated infant mortality rate comprises 18 data points for the period 1985-2009, including the estimated 20.13 per 1,000 LB for 2009. These are based on the 1985, 1993, and 2005 censuses.
Vital statistics data show differences between three major periods (Fig. 1): The 1979-1987 period when underreporting of infant mortality was estimated at 52.3 percent (1985) 15; the 1988-1997 period, for which sub-registration of infant mortality was estimated at 60.4 percent for 1990 and 62.2 percent for 1994 15; and the period since 1998 that is distinguished due to the new vital statistics information system, Sistema de Estadísticas Vitales 16,17, suggesting a transition to an improved registration system 18,19.
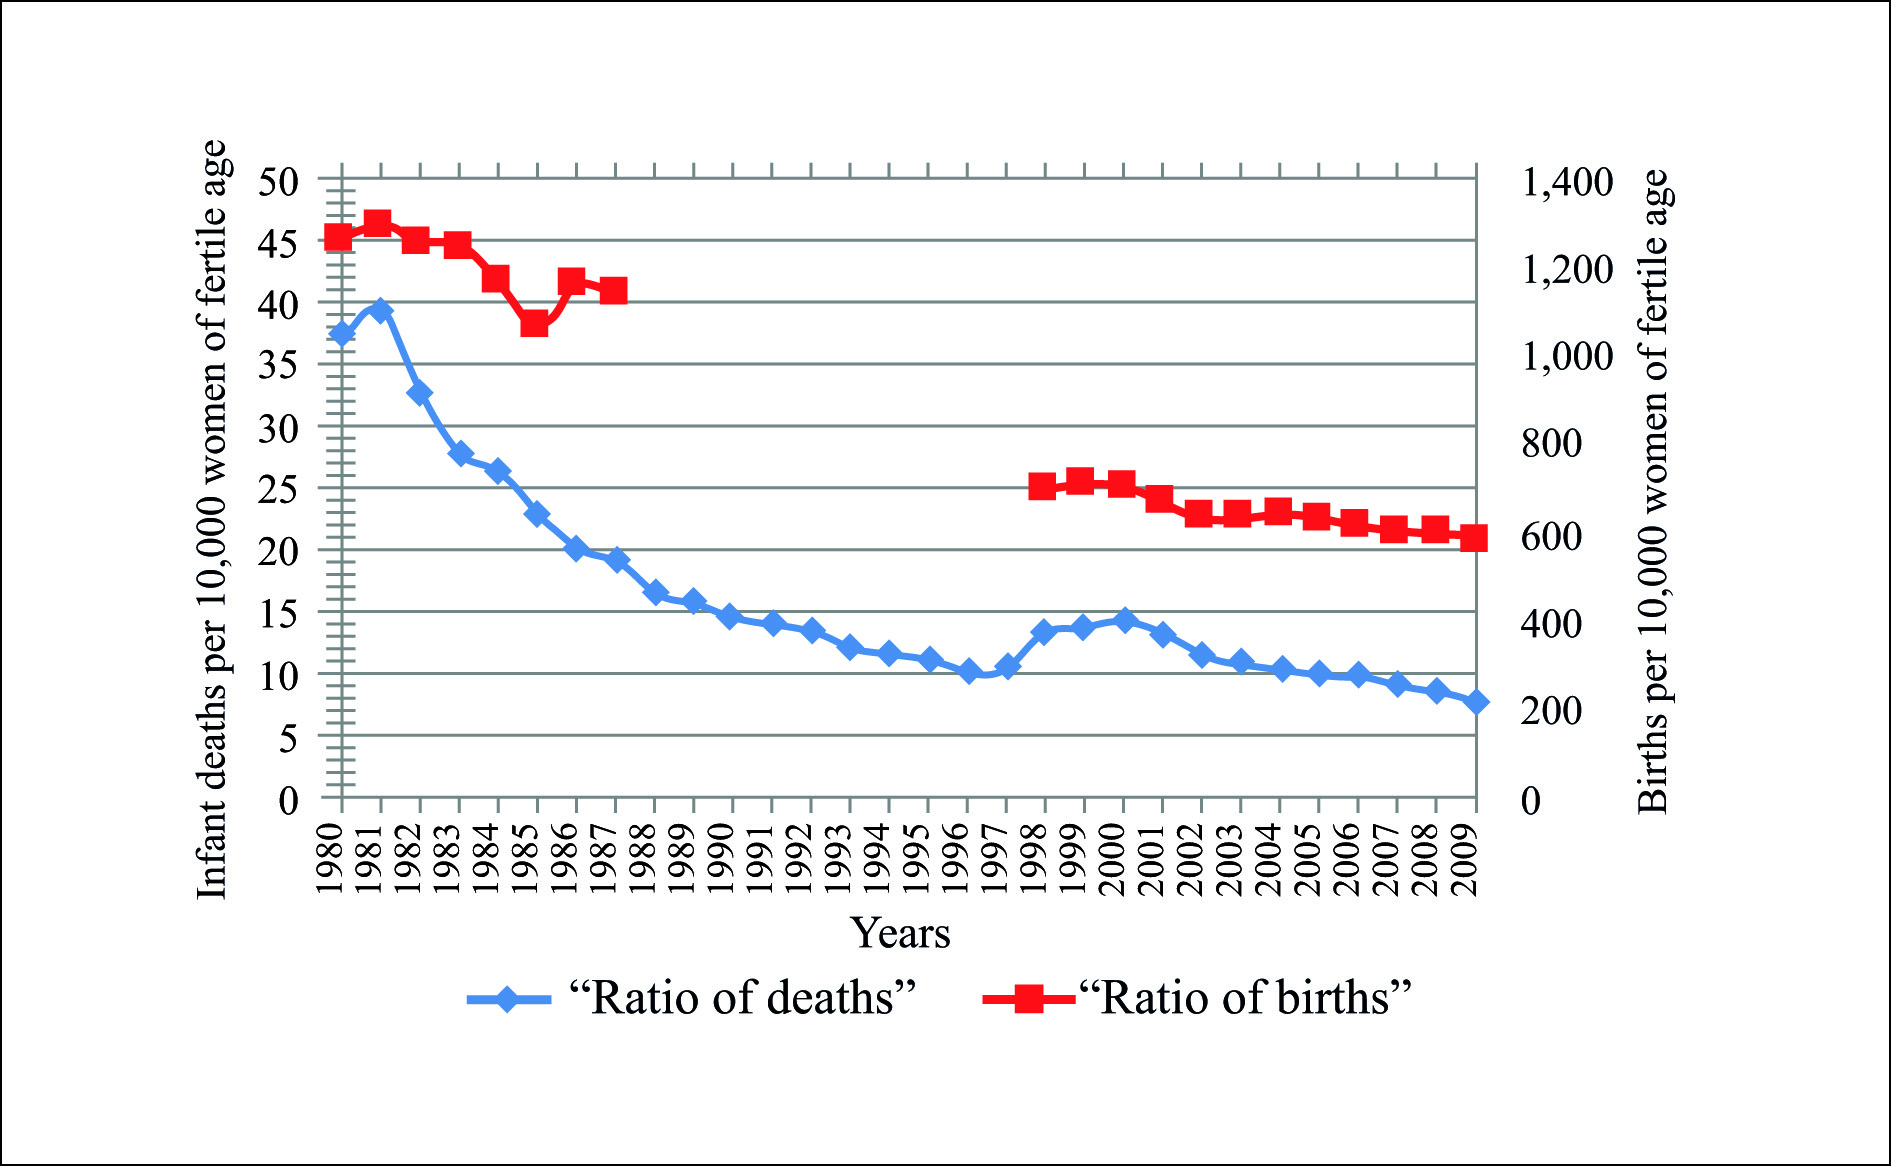
Source: Individual certificates of death (1979-2009) and individual certificates of birth (1998-2008) from DANE. births (1979-1987) retrieved COLOMBIESTAD (www.colombiestad.gov.co). Number of women of fertility age (1979-2009), from population estimated by DANE (www.dane.gov.co).
Figure 1 Ratio of births and infant deaths per 10,000 women 15 to 49 years-of-age. Colombia, 1979-2009.
Figure 2 illustrates the nature of the data as well as the challenge they present in measuring the infant mortality rate for the study period. Information on live births is not available between 1988 and 1997. Information on infant mortality is by one series through 1997, and another since then. The effort to calculate infant mortality rates based on these data yields rather inconsistent trajectories as illustrate in the Figure 2. These inconsistencies lead to recorded infant mortality rate of 13.69 for 2009, which is not consistent with the estimated rate of 20.13 per thousand live births.
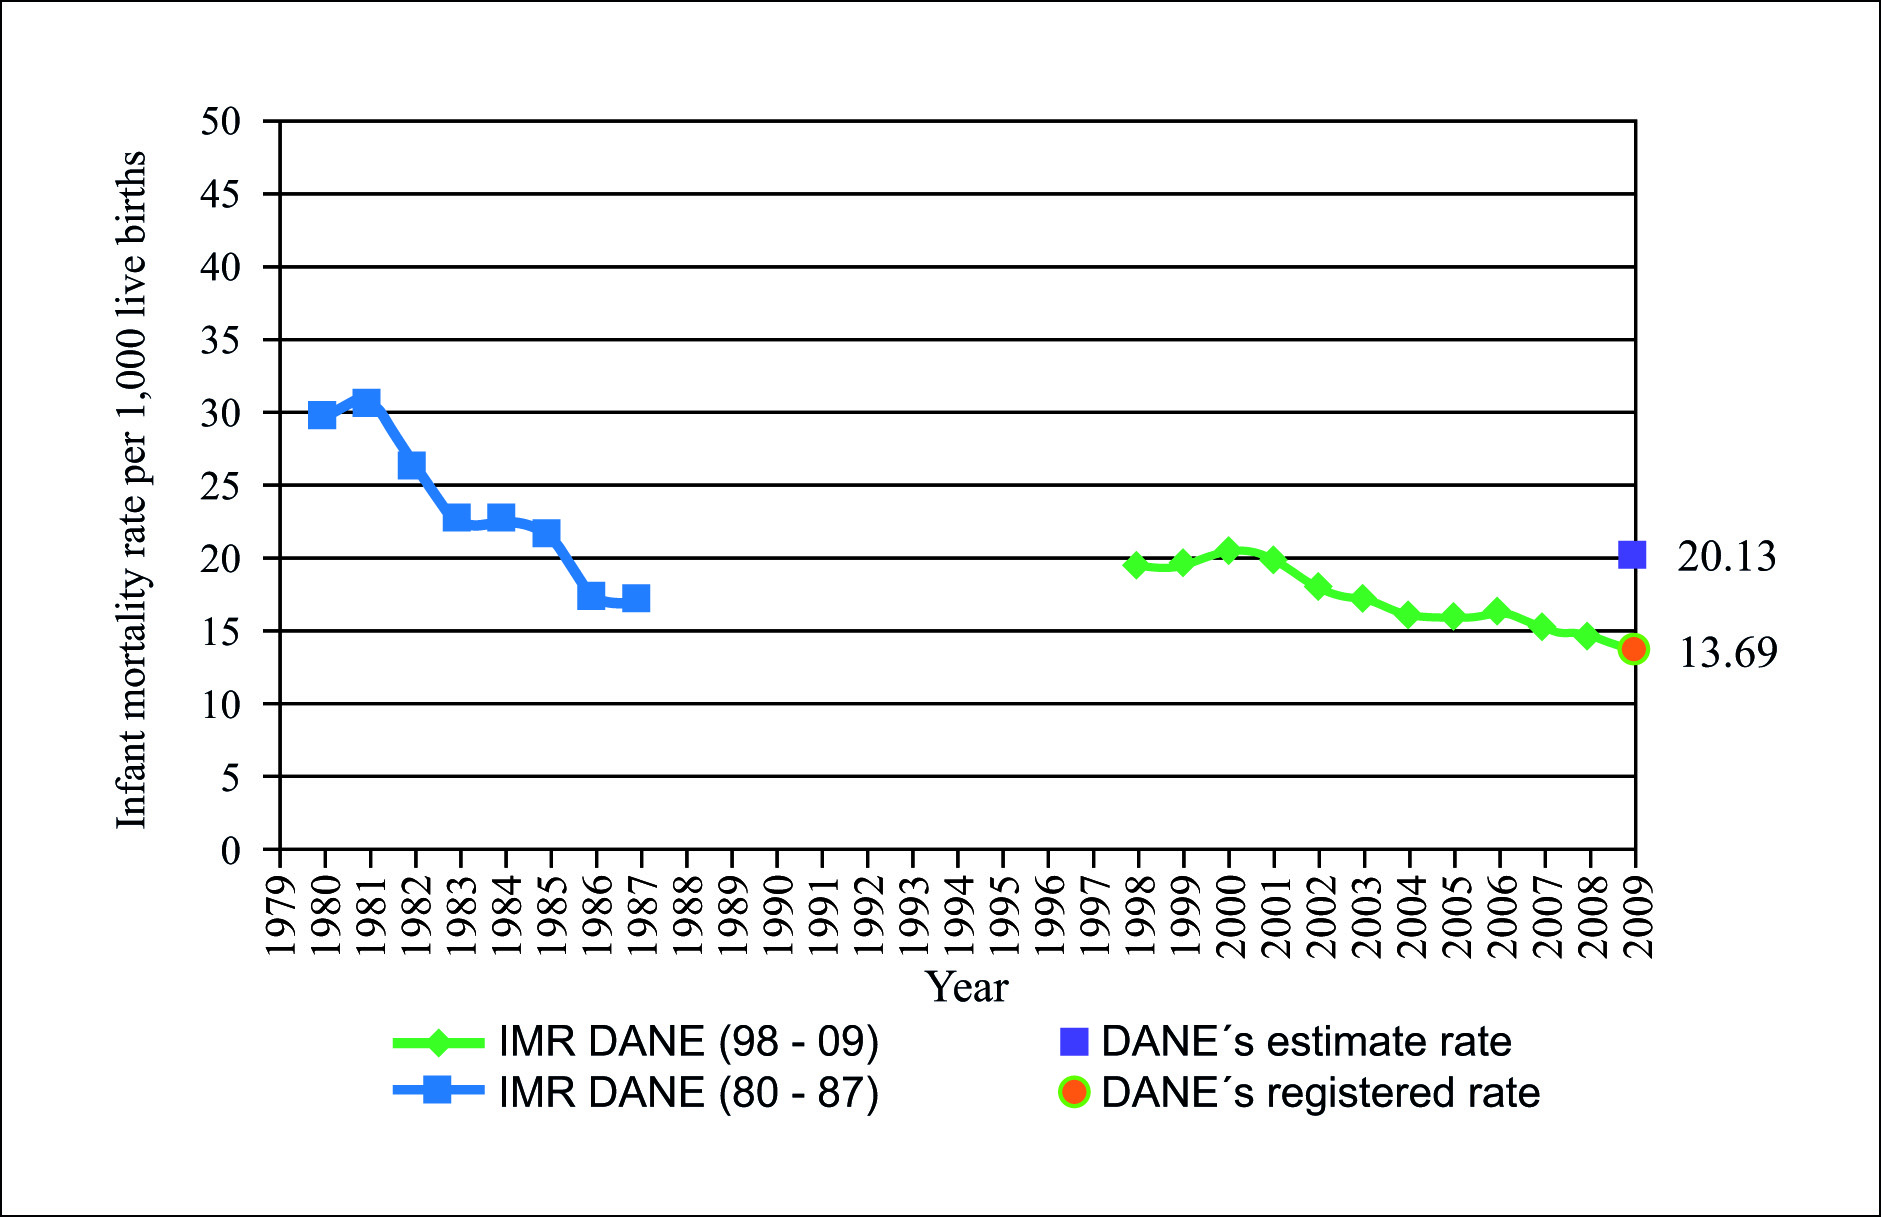
Source: Individual certificates of death (1979-2008) and individual certificates of Birth (1998-2008) from DANE. Births (1979-1987) retrieved from COLOMBIESTAD www.colombiestad.gov.co
Figure 2 Infant mortality rate in Colombia, calculated, registered and estimated (1980 - 2009)
Statistical analyses
Data Access
The database for the calculation of the registered child mortality rate was obtained through the individual birth and mortality registers in Colombia in an anonymous database. For the population of the study (children deaths), we used the children that had not reached their first year of age (364 days) from the variable age of the deceased and calculated the child mortality rate for each year. The child mortality rates estimated by the DANE and the Nacional Demographic and Health Survey were already calculated for the same year.
A data cleansing was not performed given that the DANE had already done the automatic quality control process before giving users access to the databases 18.
The statistical methodology comprises two major analyses. The first, a descriptive analysis, aims to measure live births per 10,000 women aged 15-49 (birth rates) and infant death rate (death rates) for the same population over time. On this basis, the study reestablishes the registered infant mortality rate, as well as the estimated infant mortality rate. The second, a simulation analysis, examines how the underreporting of both live births and infant deaths affects the consistency of estimates.
For the descriptive analysis we apply an exponential function based on the desire to have a model that maintains a constant average rate of decline and a decreasing absolute number of both live births and deaths in the population. This follows testing of three models: linear, exponential, and polynomial, using data from Costa Rica, a reliable source, for the period 1980-2009. The exponential model offers better results and a higher F statistic.
Consequently, we explore birth rates (BR) and death rates (DR), first, as follows:
Where, 𝑒𝛽0𝑖 and 𝑒δ0𝑖 are, correspondingly, departmental (𝑖≤33) birth rates and death rates per 10,000 women aged 15-49 in the initial year of the period, and 𝛽𝑖 and δ𝑖 are average rates of change in the two variables, respectively.
Hence, the infant mortality rate can be estimated as the ratio between these two equations:
Where
For the second analysis, we simulate possible underreporting ratios of live births and infant deaths on the 2009 registered Infant mortality rate. This simulation procedure is as follows:
Where, I𝑀𝑅𝐸 is the estimated infant mortality rate when the registered rate is I𝑀𝑅𝑅, and the percentage of underreporting for live births and infant deaths is ζ and ξ, respectively.
Results
The estimates of the birth rates trend lines per equation (1) above (Table 1, Panel 1) show a high level of numerical and statistical consistency of live births trends for the two periods: 1980-1987 and 2001-2009 (left and right columns). Both the estimated intercepts (47.6 and 46.4) and average rates of decline (0.02 and 0.02), are practically identical for the two distinct periods.
Table 1 Regression coefficients (Panel Data): births and deaths per 10,000 women ages 14-49. 1980-1987, 1980-1996 and 2001-2009.
| Panel 1: Regression coefficients, infant births per 10,000 women 14-49 as dependent variable. 1980-1987 and 2001-2009 | ||
|---|---|---|
| (t-Statistic in parentheses) | ||
| Period | 1980-1987 | 2001-2009 |
| Constant (B0) | 47.6399 | 46.3660 |
| (-4.06) | (-14.61) | |
| Slope - Trend (β) | -0.0205 | -0.0199 |
| (-3.46) | (-12.58) | |
| Panel 2. Regression coefficients, infant deaths per 10,000 women 15-49 as dependent variable. 1980-1996 and 2001-2009 | ||
| (t-Statistic in parentheses) | ||
| Period | 1980-1996 | 2001-2009 |
| Constant (D o ) | 194.1609 | 118.9051 |
| -14.99 | -14.8 | |
| Slope - Trend (δ) | -0.096298 | -0.0581784 |
| (-14.74) | -14.52 | |
Source: Study Data Base
On the basis of these estimates we posit a long-term average annual decline in the birth rate of 2.00 percent with an initial 1980 birth rates of close to 200 per 10,000 women of fertile age.
The estimates of the infant deaths rate trend line per equation (2) above are for the period 1980-1997, when the first recording system was in place, and for the period 2001-2009 that follows the period 1998-2000, when the second recording system was in use. The estimates (Table 1, Panel 2) for the two periods differ numerically and statistically. The first period average rate of decline in deaths rate is 9.62% while the second period decline is 5.82%. The two rates of decline clearly project different intercepts, 194.16 and 118.90, respectively for 1980.
Consequently, contrary to the birth rate decline estimate, which is uniform, we have two separate infant death rates of decline in need of reconciliation in order to establish, along with the birth rate estimate, a consistent decline in, and estimate of, the infant mortality rate.
That is, based on equation (3), the estimated long-term annual rates of decline in the infant mortality rate are close to 7.57 and 3.83 percent for the periods 1980-1987 and 2001-2009, respectively. Accordingly, for the first period estimates, the predicted infant mortality rate should be 26.83 for 1980, and 2.98 for 2009. While, for the second period estimates, the predictions suggest an Infant mortality rate of 40.13 for 1980 and 13.23 for 2009. Hence, the second period estimates are fully consistent with the DANE registered infant mortality rate.
A single estimate to describe the data for the entire period with the available data, t = 1980-2009, per equation 3 above yields:
Ln I𝑀𝑅= 57.54 + 0.027t, n= 18
This estimate suggests a long-term 2.71 percent rate of decline in Infant mortality rate between 1985 and 2009, and a projected rate of 20.40 for 2009. This rate that is almost identical to DANE’s public estimate for the same year. That is, we assume that was DANE’s approach.
Table 2 presents the simulated infant mortality rate, based on the 2009 13.69 registered rate for underreporting levels between 5 and 25 percent in live births, and between 15 and 95 percent in infant deaths. For example, if actual live births were 5 percent higher than registered and actual infant deaths were 15 percent higher than registered, the actual estimated infant mortality rate would be 14.99.
Table 2 Estimated actual infant mortality rate for alternative live births and infant deaths underreporting levels.
| Ratio of actual to registered deaths | Ratio of actual to registered births | ||||
|---|---|---|---|---|---|
| 1.05 | 1.10 | 1.15 | 1.20 | 1.25 | |
| 1.15 | 14.99 | 14.31 | 13.69 | 13.12 | 12.59 |
| 1.20 | 15.65 | 14.93 | 14.29 | 13.69 | 13.14 |
| 1.25 | 16.30 | 15.56 | 14.88 | 14.26 | 13.69 |
| 1.30 | 16.95 | 16.18 | 15.48 | 14.83 | 14.24 |
| 1.35 | 17.60 | 16.80 | 16.07 | 15.40 | 14.79 |
| 1.40 | 18.25 | 17.42 | 16.67 | 15.97 | 15.33 |
| 1.45 | 18.91 | 18.05 | 17.26 | 16.54 | 15.88 |
| 1.50 | 19.56 | 18.67 | 17.86 | 17.11 | 16.43 |
| 1.55 | 20.21 | 19.29 | 18.45 | 17.68 | 16.98 |
| 1.60 | 20.86 | 19.91 | 19.05 | 18.25 | 17.52 |
| 1.65 | 21.51 | 20.54 | 19.64 | 18.82 | 18.07 |
| 1.70 | 22.16 | 21.16 | 20.24 | 19.39 | 18.62 |
| 1.75 | 22.82 | 21.78 | 20.83 | 19.96 | 19.17 |
| 1.80 | 23.47 | 22.40 | 21.43 | 20.54 | 19.71 |
| 1.85 | 24.12 | 23.02 | 22.02 | 21.11 | 20.26 |
| 1.90 | 24.77 | 23.65 | 22.62 | 21.68 | 20.81 |
| 1.95 | 25.42 | 24.27 | 23.21 | 22.25 | 21.36 |
Source: Study Data Base and authors’ calculations
The bold entries at the bottom of Table 2 indicate the ranges of underreporting that would be consistent with the estimated Infant mortality rate of 20.13 for 2009 and the registered Infant mortality rate of 13.69. That is, at minimum, DANE’s estimate of 20.13 suggests a 55 percent underreporting of infant deaths, with 5 percent underreporting of live births. At maximum, it suggests about 90 percent underreporting of deaths and 25 percent underreporting of births.
To assess the magnitude of underreporting of live births and infant deaths in Colombia, we use different reports for the two variables. These are summarized in Table 3. From these, we can assume an average 25 percent underreporting of births and 50-55 percent of infant deaths.
Table 3 Reported, estimated, and underreporting of live births and infant deaths, by years of available data
| Year | Births | Deaths | ||||
|---|---|---|---|---|---|---|
| Reported † | Estimated ‡ | Under-reported Births | Reported | Estimated | Under-reported Deaths | |
| 2005 | 719 968 | 11 456 | 17 582 § | 1.53 | ||
| 2007 | 709 253 | 874 464 | 1.23 | 10 867 | ||
| 2008 | 715 453 | 884 776 | 1.24 | 10 560 | ||
| 2009 | 699 775 | 894 435 | 1.28 b | 9 580 | ||
† DANE Databases (2005-2009) available in www.dane.gov.co.
‡ Ministerio de la Protección Social. (10,12,20)
§ DANE (11)
From these data and Table 2, we can infer that the infant mortality rate for 2009 should be about 16.43-16.98. That is, DANE’s official registered infant mortality rate, 13.69, is based on an estimated trend line for the period 2001-2009, while the estimated infant mortality rate, 20.13, is based on an estimated trend line for the period 1980-2009, combining two different data registration schemes.
Census and Profamilia based estimates yield rates of decline of 4.55 percent and 3.29 percent, respectively, and project infant mortality rate at 17.58 and 15.81 for 2009, respectively 12,18. The register of vital statistics for the period 1985-1997 yields an average rate of decline of 2.87 percent, and a 3.35 percent rate of decline for the period 1998-2008, with improved data. The corresponding 2009 infant mortality rates are 12.2 and 16.94 (Table 4) 17.
Table 4 Alternative Estimates of Average Infant mortality rate Change for Selected Periods, and Projected Infant mortality rate for 1980 and 2009
| Data & Study | Period | Constant | Rate of Change | R-squared | Projected IMR for 1980 | Projected IMR for 2009 | |
|---|---|---|---|---|---|---|---|
| DANE | 1985-2009 | 57.545 | -0.0271 | 0.638 | 44.83 | 20.40 | |
| Census | 1981-2004 | 94.337 | -0.0455 | 0.827 | 69.90 | 18.68 | |
| Profamilia | 1982-2010 | 68.871 | -0.0329 | 0.898 | 41.06 | 16.04 | |
| Vital Statistics (reported) | 1985-1997 | 60.161 | -0.0287 | 0.213 | 23.26 | 12.22 | |
| 1998-2008 | 70.131 | -0.0335 | 0.879 | 44.75 | 16.94 | ||
IMR: infant mortality rate
Sources: The results shown in this table are based on the sources in Jaramillo-Mejía (15,19)
DANE estimates the infant mortality rate for 1985 between 42.71 and 48.78 15. The midpoint of this range, 45.75, is consistent with the midpoint in the range between the census projection for 1985 (39.15) and DANE’s (52.43) 17,18. Or, put another way, the 45.75 midpoints is consistent with an estimated infant mortality rate of 17.21 for 2009, and an annual rate of decline of 4.16 percent.
The non-DANE sources strongly suggest an estimated infant mortality rate for 2009 in the range of 16.0-18.7, lower than DANE’s estimation, and a correspondingly higher average rate of decline in the range of 3.50-4.50 percent (Figure 3).
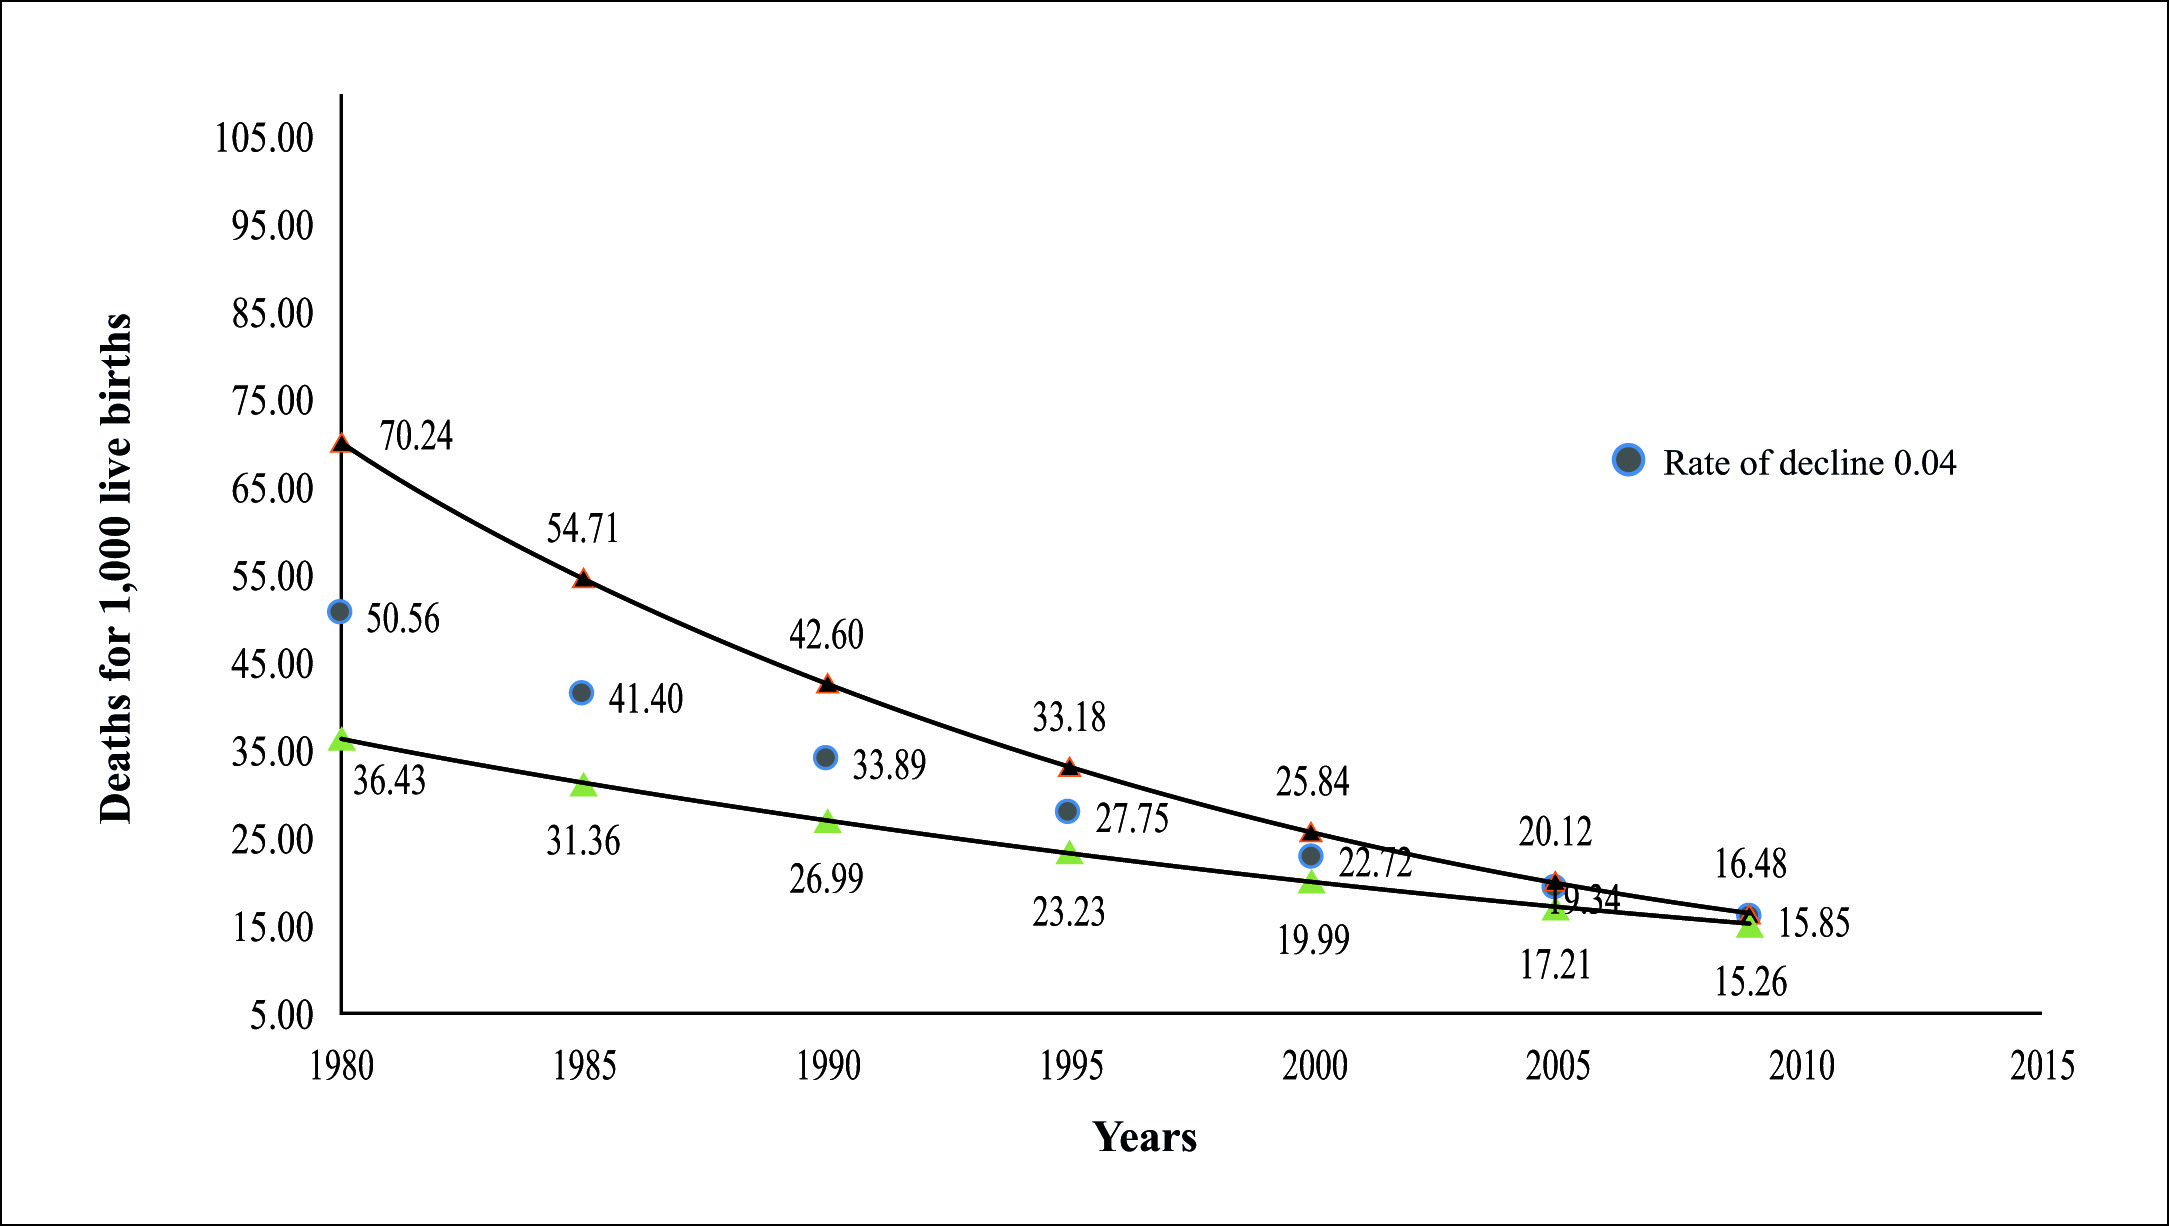
Source: Individual certificates of death (1980-2008) and individual certificates of Birth (1998-2008) from DANE. Births (1979-1987) retrieved from Colombiaestad (www.colombiaestad.gov.co)
Figure 3 Band for infant mortality rate in Colombia, 1980-2009
Discussion
At the outset, our estimates dispel the common argument that the missing data on live births between 1988 and 1997 create a fundamental problem with regard to the estimation of infant mortality rates for Colombia over the study period 13. The gap in information for live births is theoretically and statistically more easily reconciled than the mortality series, which is technically complete, but rather inconsistent in long-term suggested rates of decline in infant mortality.
The second period projections during the years 2001-2009 replicate and validate the official information. However, the 3.83 percent rate of decline suggested by this estimate again underestimates the real rate of decline.
The real rate of decline of 2.71 percent annually that follows DANE’s infant mortality rate estimated data is inconsistent with the 3.83 percent rate of decline in the registered infant mortality rate. The former rate must be higher than the latter. The rate of decline of the actual infant mortality rate, at least after the year 2000, should be greater than 3.83 percent. The high but acceptable rate of decline estimated for the first period of 7.58 percent supports this argument.
Furthermore, according to the simulation procedure and the pessimistic 2005 assessments of the new vital statistics system, it follows that while the actual Infant mortality rate for 2009 in Colombia is above 13.69, it is certainly below DANE’s estimated actual Infant mortality rate of 20.13 21.
To reconcile the data further, it is important to examine other non-DANE studies and estimates as well as the probable impact of improvements in vital registration based on recent developments in Colombia.
We have to recognize several developments in Colombia. First, the new vital statistics registration system operating since 1998 covers the entire country. This has led to an improvement in the reporting of live births and infant deaths since 1998-2000 that is also evident in our analysis 11,13,16. Second, the Ministry of Health reports that in 2008 more than 98.1 percent of the institutional-clinical birth deliveries were reported, and that medical personnel, responsible for issuing birth certificates, attended about 97.9 percent of childbirths 9,11,22.
Mathers et al. 20 studied the quality of vital statistics information in 115 countries. They found that Colombia, like Costa Rica, Chile, Brazil, and Uruguay, ranked at an intermediate level on their quality scale. Countries such as Argentina, Paraguay, Bolivia, and Peru ranked low, while Venezuela ranked high. Alarcón and Robles 23 found that in countries with low levels of underreported births, such as Chile, Costa Rica, Argentina, and Uruguay, Infant mortality rate calculations are reliable 24,25.
Colombia’s infant mortality rate has consequently evolved to be about the average in Latin America. In the period 1950-1955, the country had an estimated infant mortality rate of 123.1, which was comparable to the rates of Chile, Mexico, Brazil, Venezuela, and Ecuador. However, for the period 2005-2010, Chile achieved a reduction of its infant mortality rate to below the average in Latin American countries with a reported Infant mortality rate of 7.2 17, and an annual rate of decline of 5 percent 26,27, while Colombia and the other countries have an Infant mortality rate between 16.3 (Mexico) and 23.6 (Brazil) in the same period 26. Thereby, if Colombia was to maintain its relative position, the 2006/7 infant mortality rate would need to be about 20, with smaller long-term rates of decline than that of the Chilean 5 percent. This is because the two countries had similar infant mortality rates in the early 1950s 23. In fact, the 123.1 infant mortality rate for 1955 and 20.0 for 2007 would suggest that Colombia has a 3.5 percent annual decline in infant mortality rate and a lower than 20.0 infant mortality rate in 2009, again fully in line with the non-DANE estimates reported in Table 1.
Alarcón and Robles 23 suggest an infant mortality rate of 30 in Colombia for 1990, 17 in Chile, and the other countries between 24 (Venezuela) and 50 (Brazil). For 2004 they calculated an infant mortality rate of 18 in Colombia, 8 in Chile, and the other countries between 16 (Venezuela) and 31 (Brazil). The implied annual rates of decline between these two years are 2.9 percent in Colombia, 3.8 percent in Chile, and in other countries it varies from 2.4 percent (Venezuela) to 3.3 percent (Ecuador) 23. These data suggest an Infant mortality rate below 20, closer to 17, for Colombia in 2009. Urdinola 18 suggests that the Profamilia data (Table 1) underestimates the rate of decline in Infant mortality rate, and she puts it at about five percent.
Thus, taking the comparable international perspective, Colombia’s Infant mortality rate in 2009 must be lower than 20. However, its Infant mortality rate had a rate of decline most likely in the range of 3-5 percent and below Chile’s five percent 20.
All other studies and estimates summarized above put the 2009 Infant mortality rate well below 20, in the range of 15.81-17.58, and suggest long-term rates of change between 3 and 5 percent.
Some limitations are related to the initial underreporting of births and infant deaths and the absence of birth data in the period 1987-1997, because the Registraduría del Estado Civil did not enter the information of the civil register during that period, which does not allow to calculate the rate of births. infant mortality during that same period. However, the implementation of the new Vital Statistics System corrected the trend of the child mortality rate from the year 2000, correcting confusion over the non-existence of information in the 10-year period 18.
Conclusion
As in many other transitional economies, the actual infant mortality rates for Colombia, even in most recent history, will probably never be known precisely. Using all available information on Colombia today, we conclude that on average the infant mortality rate in Colombia fell from about 54 to about 17 over the period 1980-2009. This follows a long-term annual rate of decline for the period of about 4.0 percent.

