text in
  English (pdf)
 Article in xml format
 Article references
 Send this article by e-mail
 Cited by SciELO
  Cited by Google
  Similars in
SciELO
Similars in
SciELO  Similars in Google
 Permalink
Remark
| 1)Why was this study conducted? |
| This study was conducted to provide Valle del Cauca with high-quality evidence that would allow for timely decision-making and efficient resource allocation of scarce hospital resources during the COVID-19 pandemic. |
| 2) What were the most relevant results of the study? |
| The adaptation of the Ontario model to the Colombian context allowed predicting the effects of moderate and more severe pandemic scenarios. The implementation of physical distancing measures and the expansion of the hospital capacity were vital to ensure availability of ICU beds and ventilators for COVID patients. |
| 3) What do these results contribute? |
| Iterative economic and statistical modelling can be used to inform resource allocation during a health crisis such as the COVID-19 pandemic. |
Introduction
Valle del Cauca, with a population of 4.4 million, is the province with the fourth-highest number of COVID-19 cases in Colombia, after Bogotá 1. As of September 7th, 2020, there were 50,179 confirmed cases in Valle del Cauca and 1,891 confirmed deaths, compared with 667,000 cases and 21,000 deaths, nationwide 1. COVID-19 incidence and mortality are reported daily by the National Surveillance System (SIVIGILA). Cases are confirmed by reverse transcriptase-polymerase chain reaction (RT-PCR). Testing was initially centralized at the Instituto Nacional de Salud (INS) and has been progressively decentralized throughout the country. Testing for the Valle del Cauca region is currently performed by eight accredited laboratories 2. The first COVID-19 case was reported on March 6 3 and social distancing measures were put in place on March 26, 2020, at the national level. A national quarantine was initially implemented for the general population until April 27 and then extended until May 11. Since then, regional governments have implemented a partial quarantine for specific population groups (e.g., children, seniors) 4, and have allowed selected sectors of the economy to resume work (mainly construction and textile manufacturers). For the past months, the COVID-19 pandemic in Valle del Cauca has exerted considerable pressure on the hospital capacity. Although the ICU and hospital beds have not been fully occupied, continuing to lift the restrictions is expected to result in an increased number of COVID-19 cases, and reduced hospital capacity. Given a considerable increase in cases, the intensive care unit (ICU) beds and ventilators may not be sufficient.
We used a statistical model to predict the number of new COVID-19 cases in Valle del Cauca from March 2020, for different scenarios and time intervals. Although the original CORE model was developed and calibrated to Ontario, Canada 5, we have populated it with the most up-to-date data from Valle del Cauca as it became available to adequately simulate local pandemic trajectories and resource availability. Researchers from the University of Toronto partnered with researchers from Pontificia Universidad Javeriana (Bogota, Colombia), and government and academic representatives from Valle del Cauca to inform decision-making regarding social distancing measures. Two main sets of results are presented: the estimation of cases and resource availability between June 20th and August 31st, when Colombian authorities planned on relaxing social distancing restrictions, and between September 1st and October 31st when all mandatory restrictions were lifted throughout the country. Therefore, the objectives of this study were to predict the impact of COVID-19 on the capacity of the health care system through time and to estimate the expected number of tests required to identify new cases.
Materials and Methods
Model description
We adapted the CORE (COVID-19 Resource Estimator) model, an individual-level simulation model developed for Ontario, Canada 5,6, to predict the number of cases and hospital resources required in Valle del Cauca given specific scenarios. The model followed individual patients throughout daily cycles (time steps) up to 45 days in Valle del Cauca. We simulated individuals who are 15 years and older and who may have comorbidities. Symptomatic patients who arrive at the hospital and test positive for SARS-CoV-2 by RT-PCR, become confirmed cases of COVID-19. The patients are admitted to the hospital or sent home based on their disease severity. Of the patients who are admitted to the hospital, a proportion requires admission to the ICU, and the most severe cases are treated with invasive mechanical ventilation.
Patients transition through different health states as described in Figure 1. Patients with severe disease require either a hospital ward or an ICU bed. ICU admission is dependent on the availability of an ICU bed. If one is not available, the patient will remain in the hospital ward waiting for one to become available. Considering that some ICU beds are not equipped with mechanical ventilators, a patient who requires a ventilator will die within 24 hours if none is available. Ward and ICU beds, and ventilators are freed upon recovery or death of patients. Mortality rates are dependent on the disease severity and the health state in which patients are currently at. For example, patients with severe disease requiring ICU care have a higher probability of dying if they remain in the hospital ward due to lack of ICU beds 7, compared with similar cases who were able to transition into the ICU.
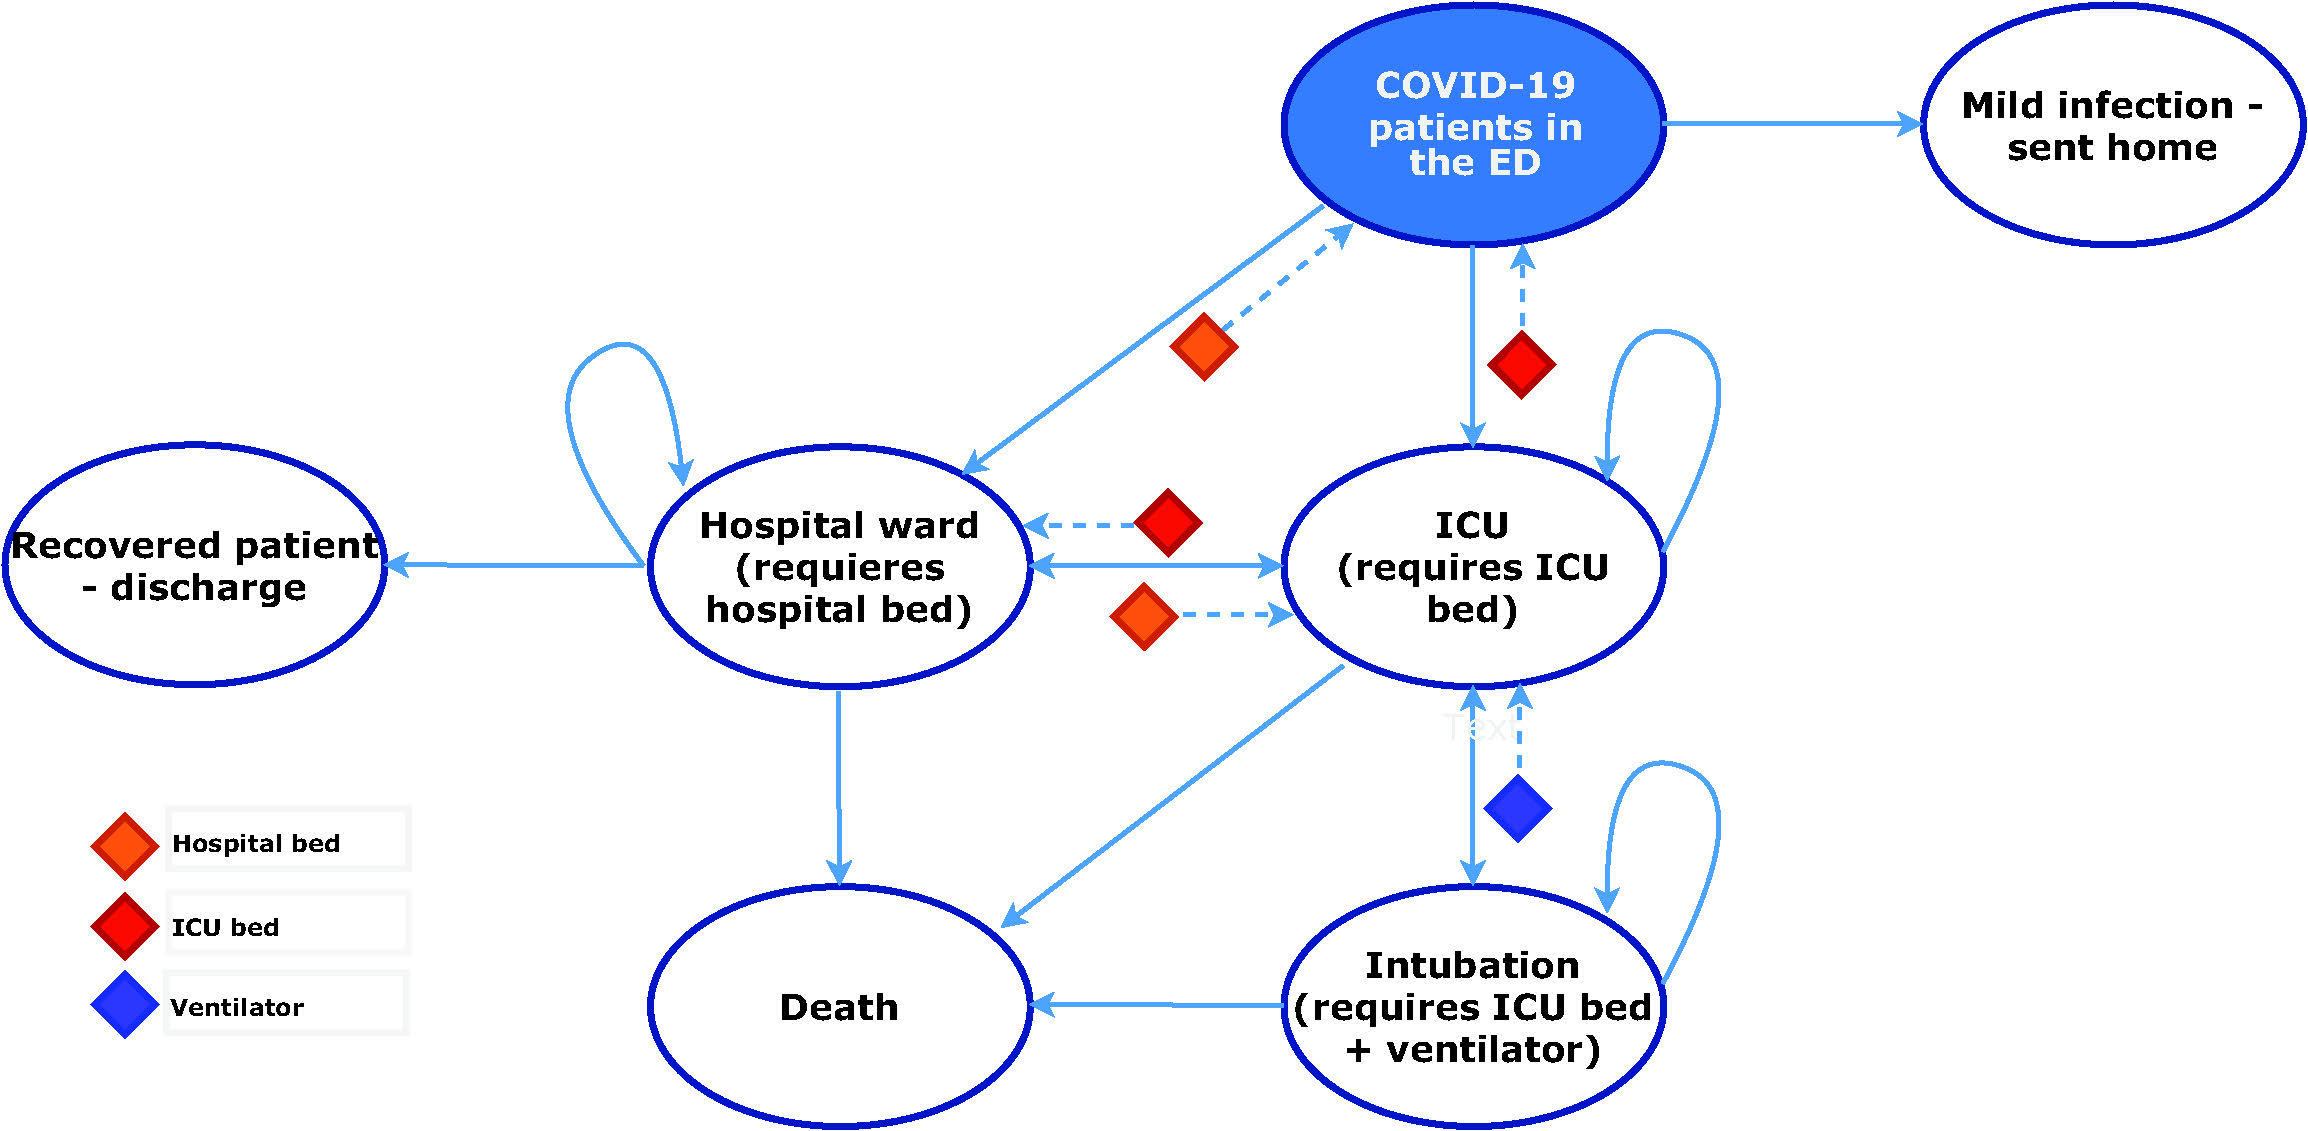
Note: The resource constraints limit the transition of patients across health states. If a patient is in the hospital ward and requires ICU care, the transition will not be possible if an ICU bed is not available. Instead, the patient remains in the hospital ward until an ICU bed becomes available. The same applies to the ventilator and hospital ward bed constraints.
Figure 1 Model structure. *ED = Emergency department; ICU = intensive care unit.
Model parameters and assumptions
The CORE model was populated with regional data and data from international literature. Data on resource capacity was obtained from the Colombian Ministry of Health and Social Protection (MSP) (8 and Registro Especial de Prestadores de Servicios de Salud (REPS) 9. Some assumptions were made based on expert elicitation. All model inputs and assumptions are presented in Table 1. We made some key assumptions: Patients in the community setting and the hospital ward are assumed to have a short-term COVID-19-related probability of death equal to zero 7, and only patients in the ICU with severe disease have a risk of death due to COVID-19. Mortality rates were modelled according to the different health states as per international data. Further technical details are presented elsewhere 6. We included ICU beds with and without ventilation and assumed that the number of ventilated beds represented the number of currently available ventilators. We assumed an average ICU length of stay of 8 days, and a hospital length of stay of 11 days, as reported in the international literature 10 and is consistent with data reported by the INS 1,11. These parameters continued to be modified as local evidence became available. We assumed that no additional beds or ventilators would be made available for new COVID-19 patients.
Table 1 Model parameters
| Variables | Base-case value (June 20th to August 1st) | Base-case value (September 1st to October 15th) | Sources |
|---|---|---|---|
| Number of infected subjects* | See Figure 2 | See Figure 2 | INS 11 |
| Probability of needing hospital admission | 0.18 | 0.18 | PHAC 12 |
| Probability of needing ICU-level care given admission to hospital | 0.48 | 0.48 | PHAC 12 |
| Probability of ICU patients needing ventilation | 0.78 | 0.78 | CCSO 13 |
| Probability that patients on the ward deteriorate and need ICU-level care | 0 | 0 | Assumption |
| Length of stay, ward (no ICU admission/prior to ICU admission) | 17 days | 11 days | Bellani et al., (10, REPS 9 |
| Length of stay, ICU (with/without ventilation) | 11 days | 8 days | Bellani et al. (10, REPS 9 |
| Length of stay, ward post-ICU | 6 days | 5 days | Bellani et al. 10, REPS (9 |
| Probability of death ward patients | 0 | 0 | Wu et al. 7 |
| Probability of death, ICU-patients | 0.35 | 0.35 | Bellani et al. 10 |
| Probability of death, ventilated patients | 0.35 | 0.35 | Bellani et al. 10 |
| Probability of death of patients waiting for ventilator | 1 | 1 | Assumption |
| Number of ward beds available for COVID-19 patients | 1,659 | 1,701 | MSP 8; REPS (9 |
| Number of ICU beds with ventilators available for COVID-19 patients | 475 | 352 | MSP (8; REPS (9 |
| Number of ICU beds without ventilators available for COVID-19 patients | 280 | 735 | MSP (8; REPS (9 |
* The reported cases correspond to the date in which the tests were performed, instead of the date of diagnosis.
** COVID-19 = Coronavirus disease; ICU = intensive care unit, REPS = Registro Especial de Prestadores de Servicios de Salud; MSP = Ministerio de Salud Publica
Analysis
We ran eight scenarios that assumed different social distancing measures to estimate the number of cases and the number of the available hospital ward and ICU beds between June 20th and August 1st (first-time interval) and between September 1st and October 15th (second-time interval). The same four scenarios were built for each time interval - the first assumed that quarantine was decreed on July 1st and September 1st (for each time interval, respectively). We assumed a constant daily infection rate of 2% (i.e., the percent of increase that will happen every new day on the daily number of cases) under quarantine, as observed in the previous data from March, April and May 1. The second scenario modelled partial restrictions, where specific work sectors were allowed to resume activities, but the general population was advised to stay home. We assumed a daily infection rate of 4% as observed in the last weeks of June. The third scenario assumed less effective partial restrictions, modelled with a daily infection growth rate of 8%. Finally, the last scenario assumed that restrictions were completely lifted, assuming a higher infection growth rate of 10%. The analysis set up is presented in Appendix A. Additionally, we estimated the number of avoidable deaths. We ran the model for each scenario with and without a resource constraint and compared the number of expected deaths. The number of avoidable deaths was defined as the difference of the expected deaths between the scenarios with resource constraints and the same scenarios assuming unlimited resource availability. Finally, we estimated the number of tests required to identify the predicted incident cases across the four scenarios. To do so, we assumed a positivity rate of 10%, according to national and regional data 1,13. Therefore, 10 RT-PCR tests were required, on average, to identify one additional case.
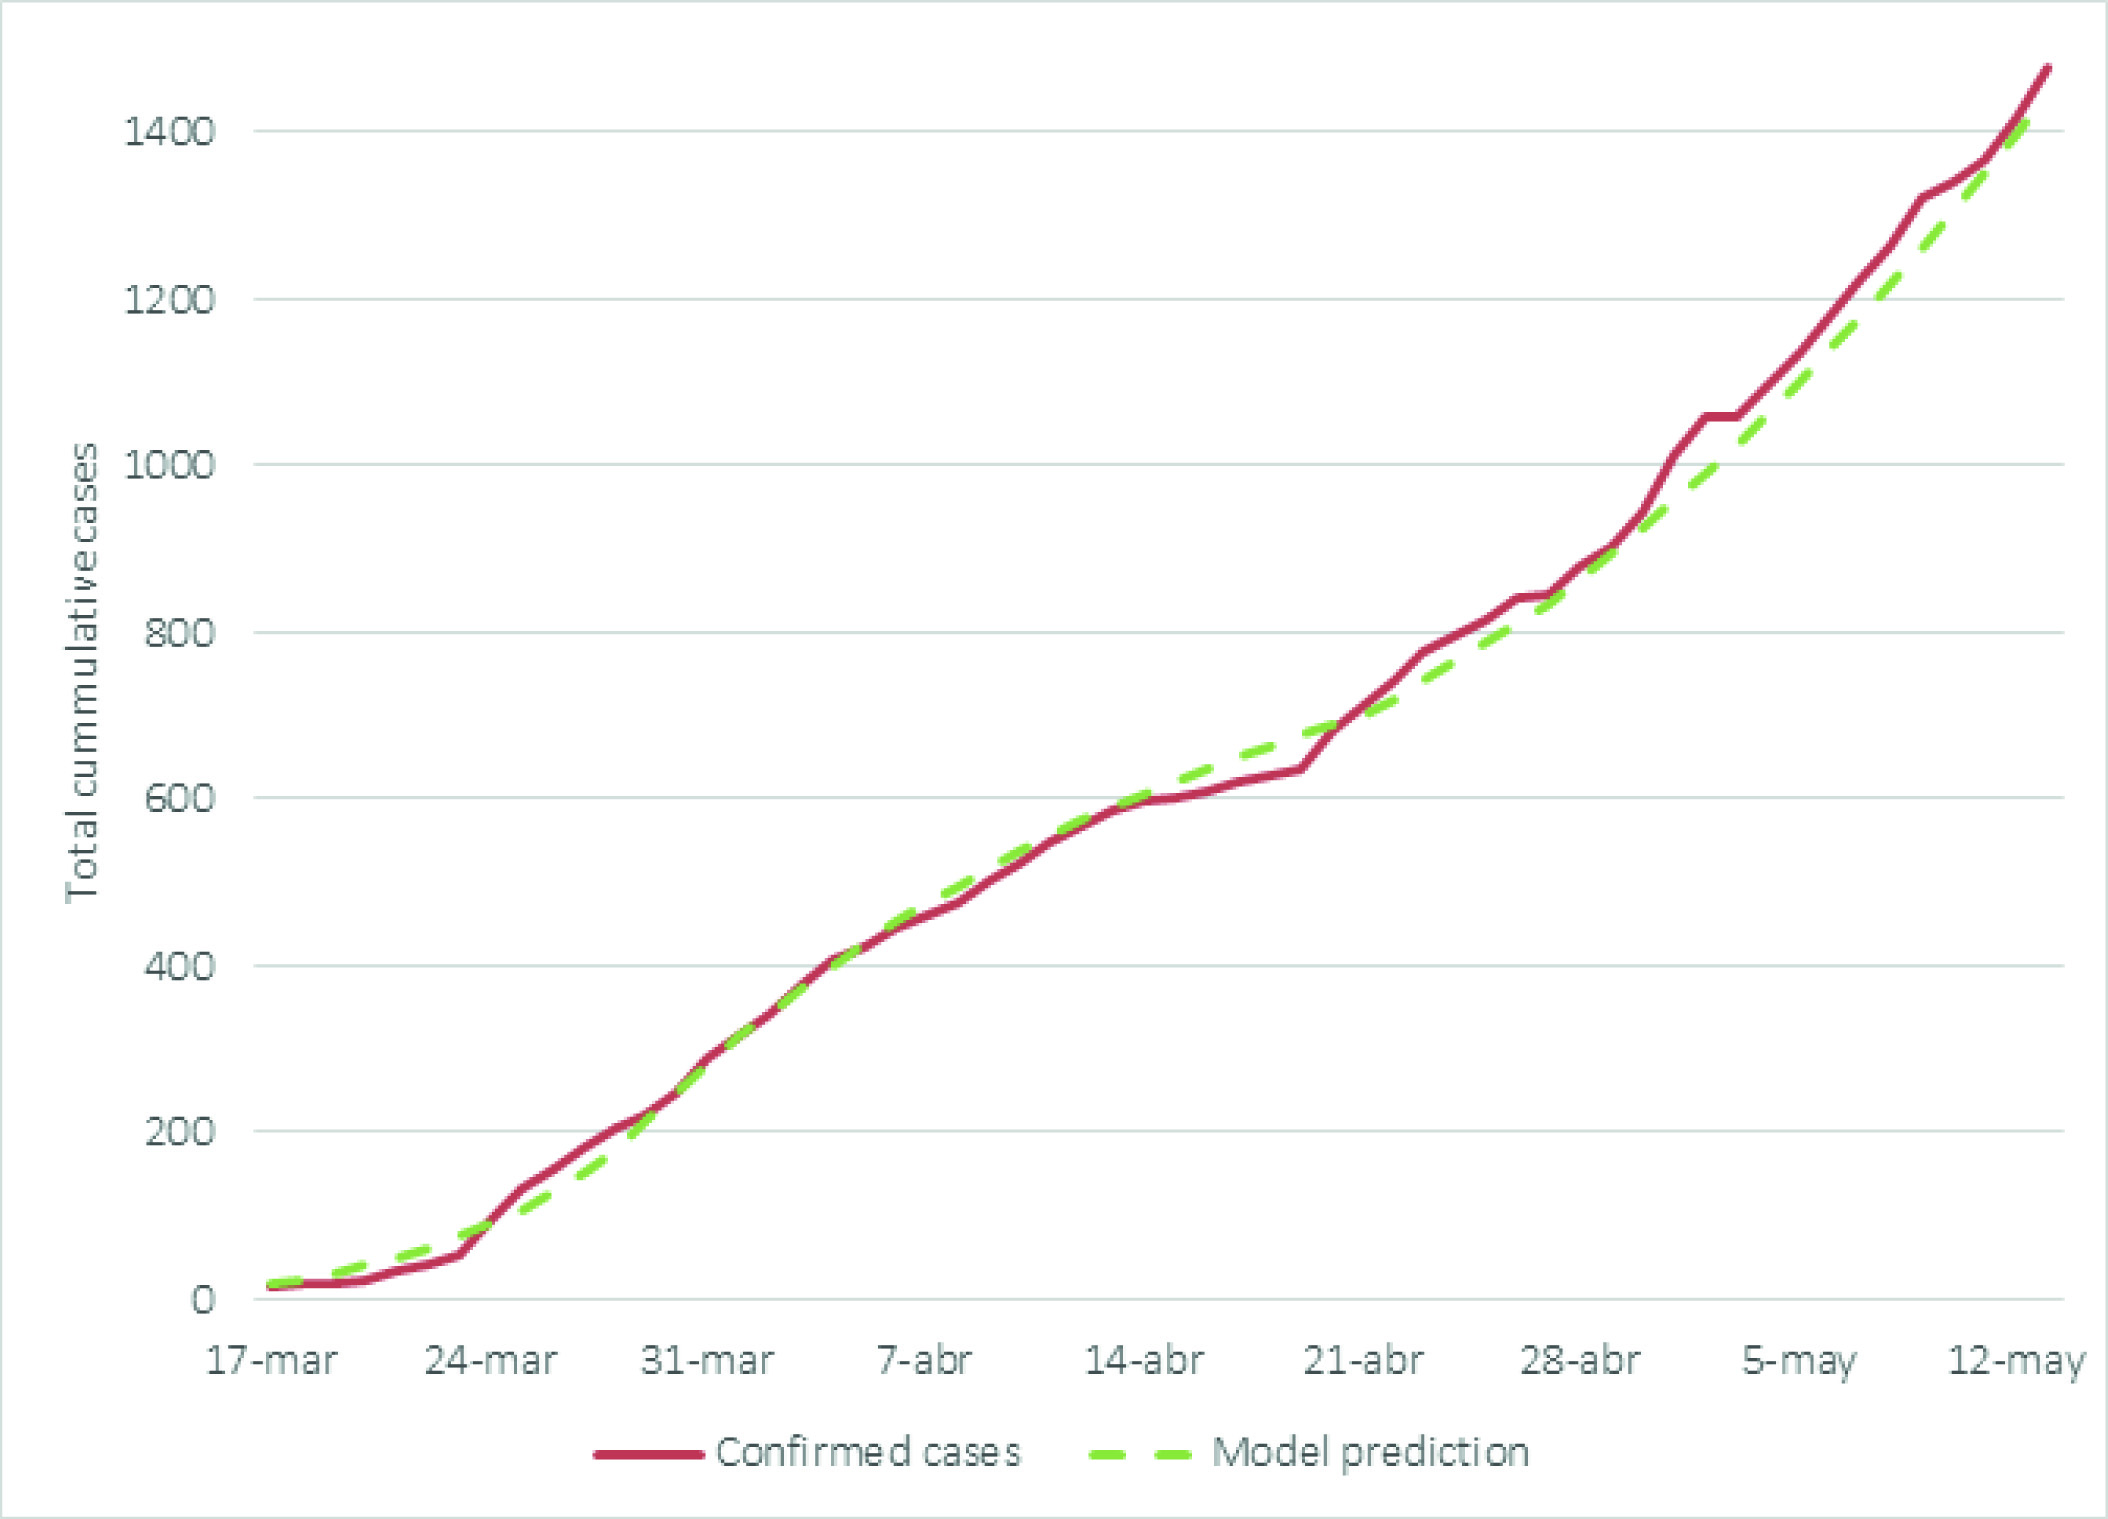
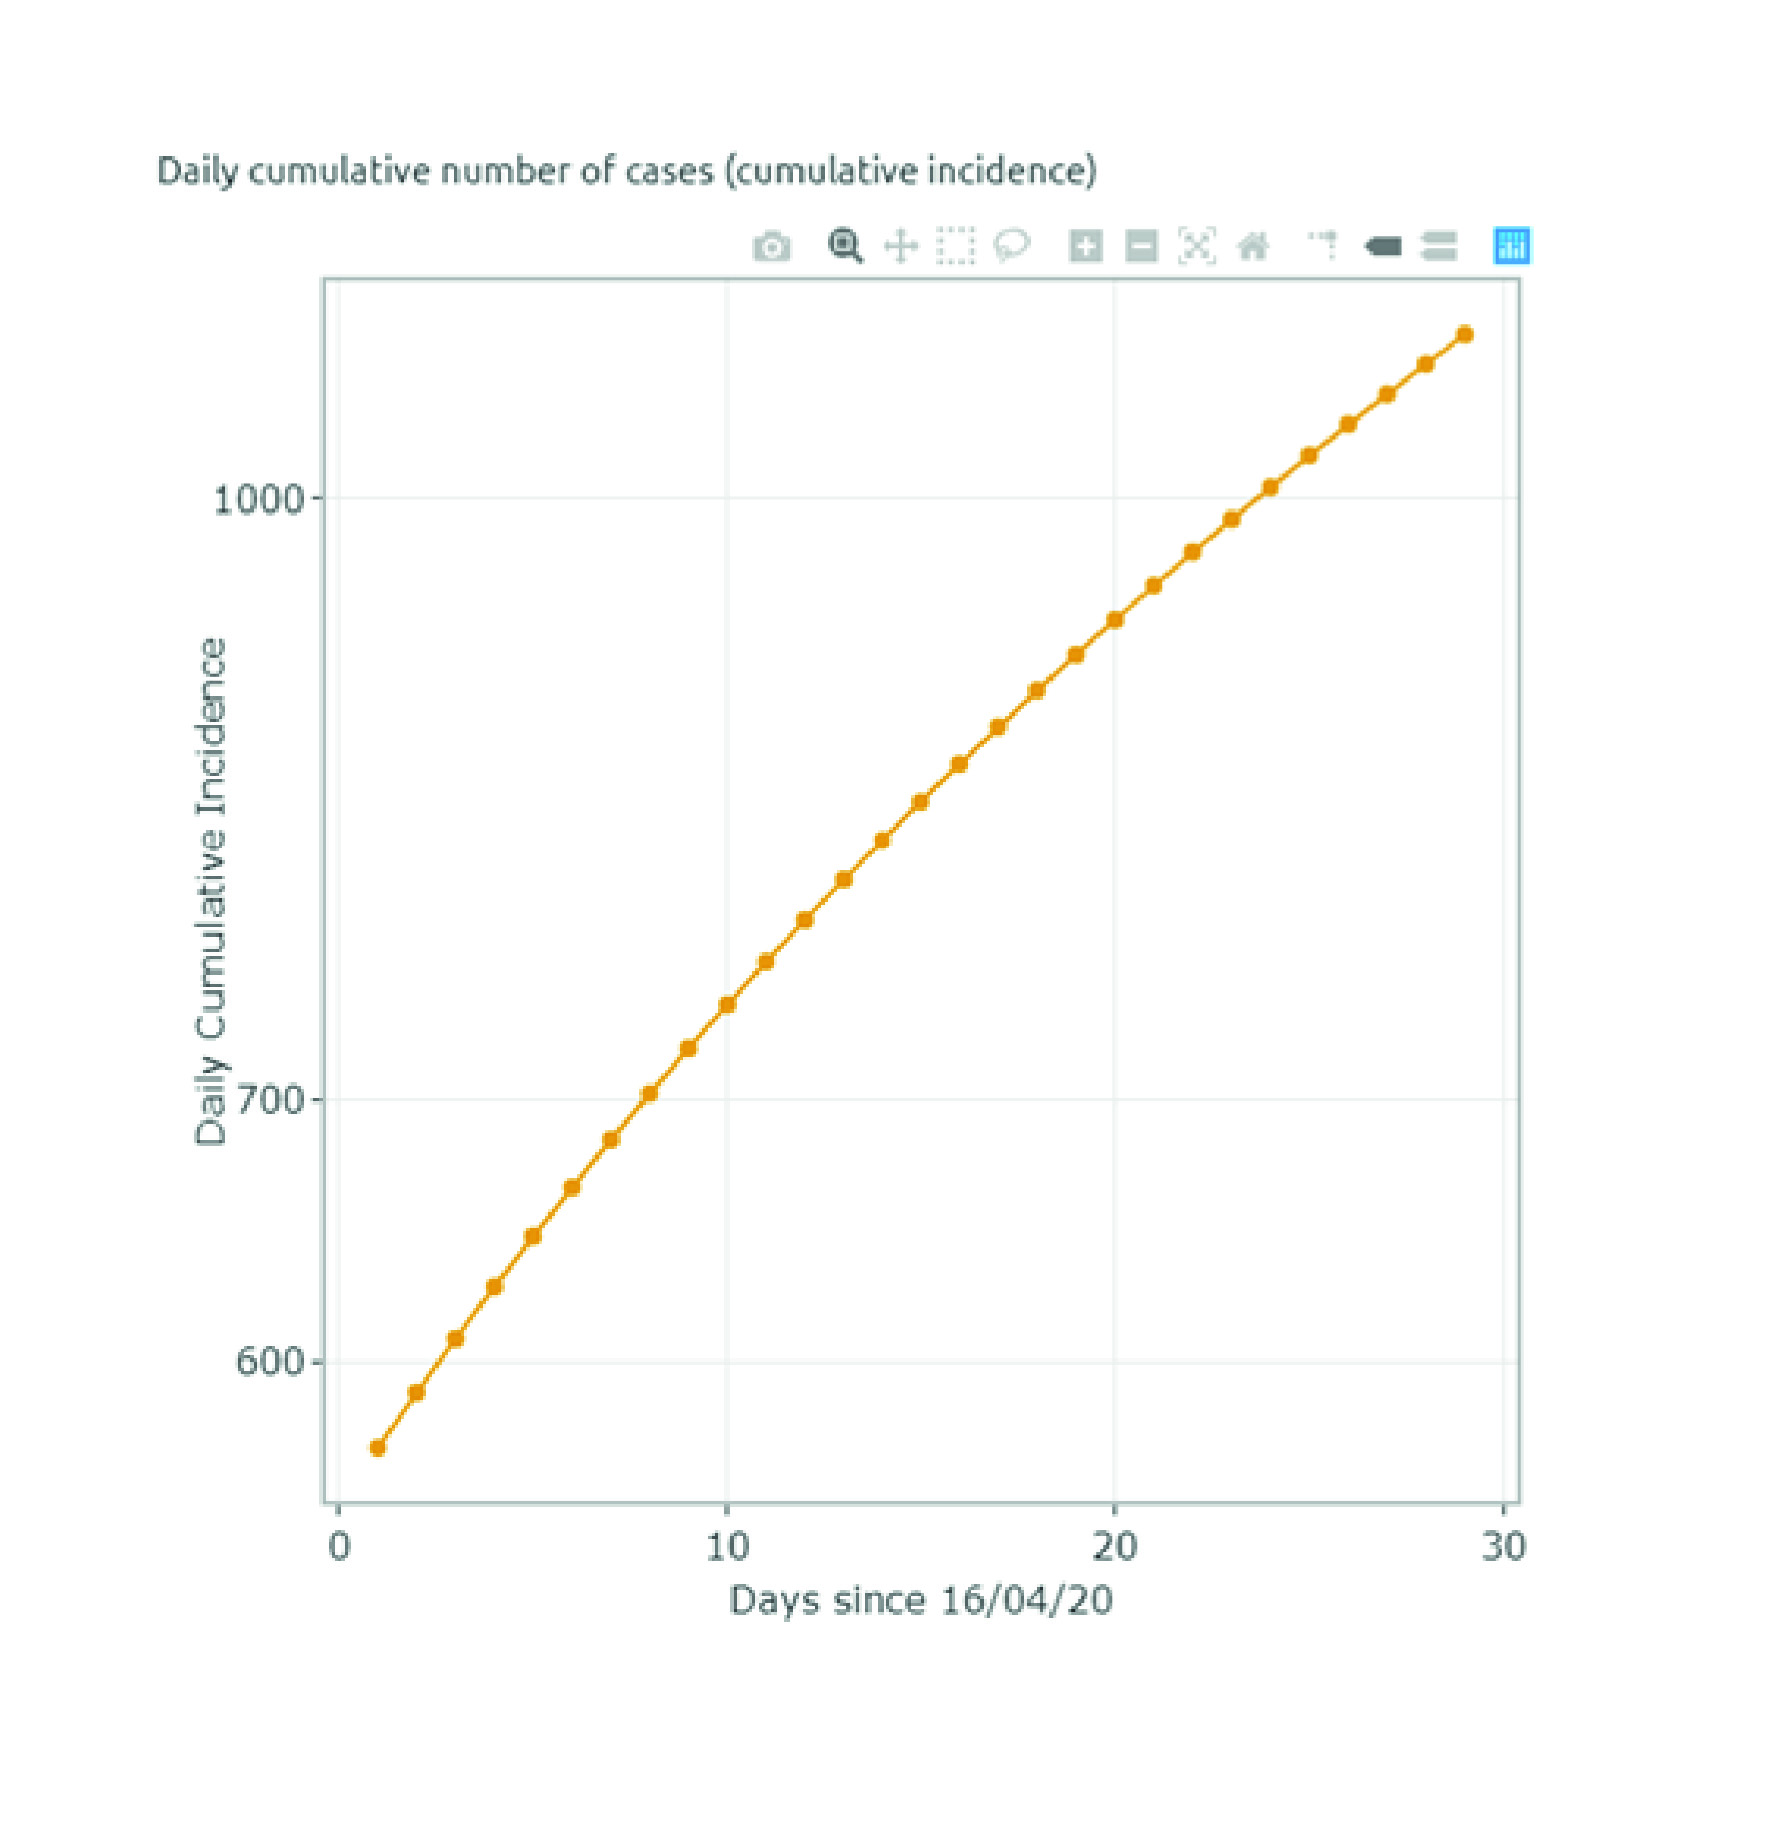
Validation of case prediction
We used the CORE model to predict the observed cumulative cases from March 16 to May 17 to ensure that the model could adequately predict future cases for Valle del Cauca. We modelled four different trends: between March 16 and March 26, the daily average increase of cases was estimated at around 44%, whereas from March 26 (when quarantine was implemented) to April 4, the daily increase was reduced to 11%. Further, the number of cases increased at an average daily rate of 2.6% between April 4 and April 27. After a few economic sectors were allowed back to work (after April 27) the number of new cases increased to 3.1% per day. We modelled different social distancing interventions implemented by the regional government between these dates to determine whether the model case predictions matched the observed data.
Additional results
We added the results of the prediction exercises that were conducted during the first phases (during March and May) of the partnership between the University of Toronto, Pontificia Universidad Javeriana, and the government representatives of Valle del Cauca. This allows comparing the predictions during the early days of the pandemic in Colombia with the observed data.
Results
The case predictions across strategies between June 20 and August 1 are summarized in Figure 2(i). For the first scenario (scenario A - implementing a quarantine on July 1st), the number of cumulative cases was estimated at 15,920 by August 1st. For scenarios B and C (partial restrictions at 4% and 8% growth rates), the model estimated 24,050 and 37,372 cumulative cases by August 1st, respectively. Finally, the number of cases was estimated at 116,018 by August 1st when assuming no social distancing measures and an infection rate of 10% beyond July 1st (scenario D). Compared with the observed data, scenario B more closely resembled the actual number of COVID-19 cases diagnosed by August 1st (24,050 estimated compared with 25,628 observed 9). On the other hand, the case predictions between September 1 and October 15 are summarized in Figure 2(ii). The model estimated 67,694 cases by October 1st assuming a strict quarantine was put in place during September (scenario E). On the other hand, the case predictions for the scenarios assuming partial restrictions with 4% and 8% growth rates (scenarios F and G) were around 80,398 and 101,489 by October 15, respectively. Finally, the last analysis (scenario H) that assumed a complete lift of social distancing restrictions estimated 208,502 cases by October 15.
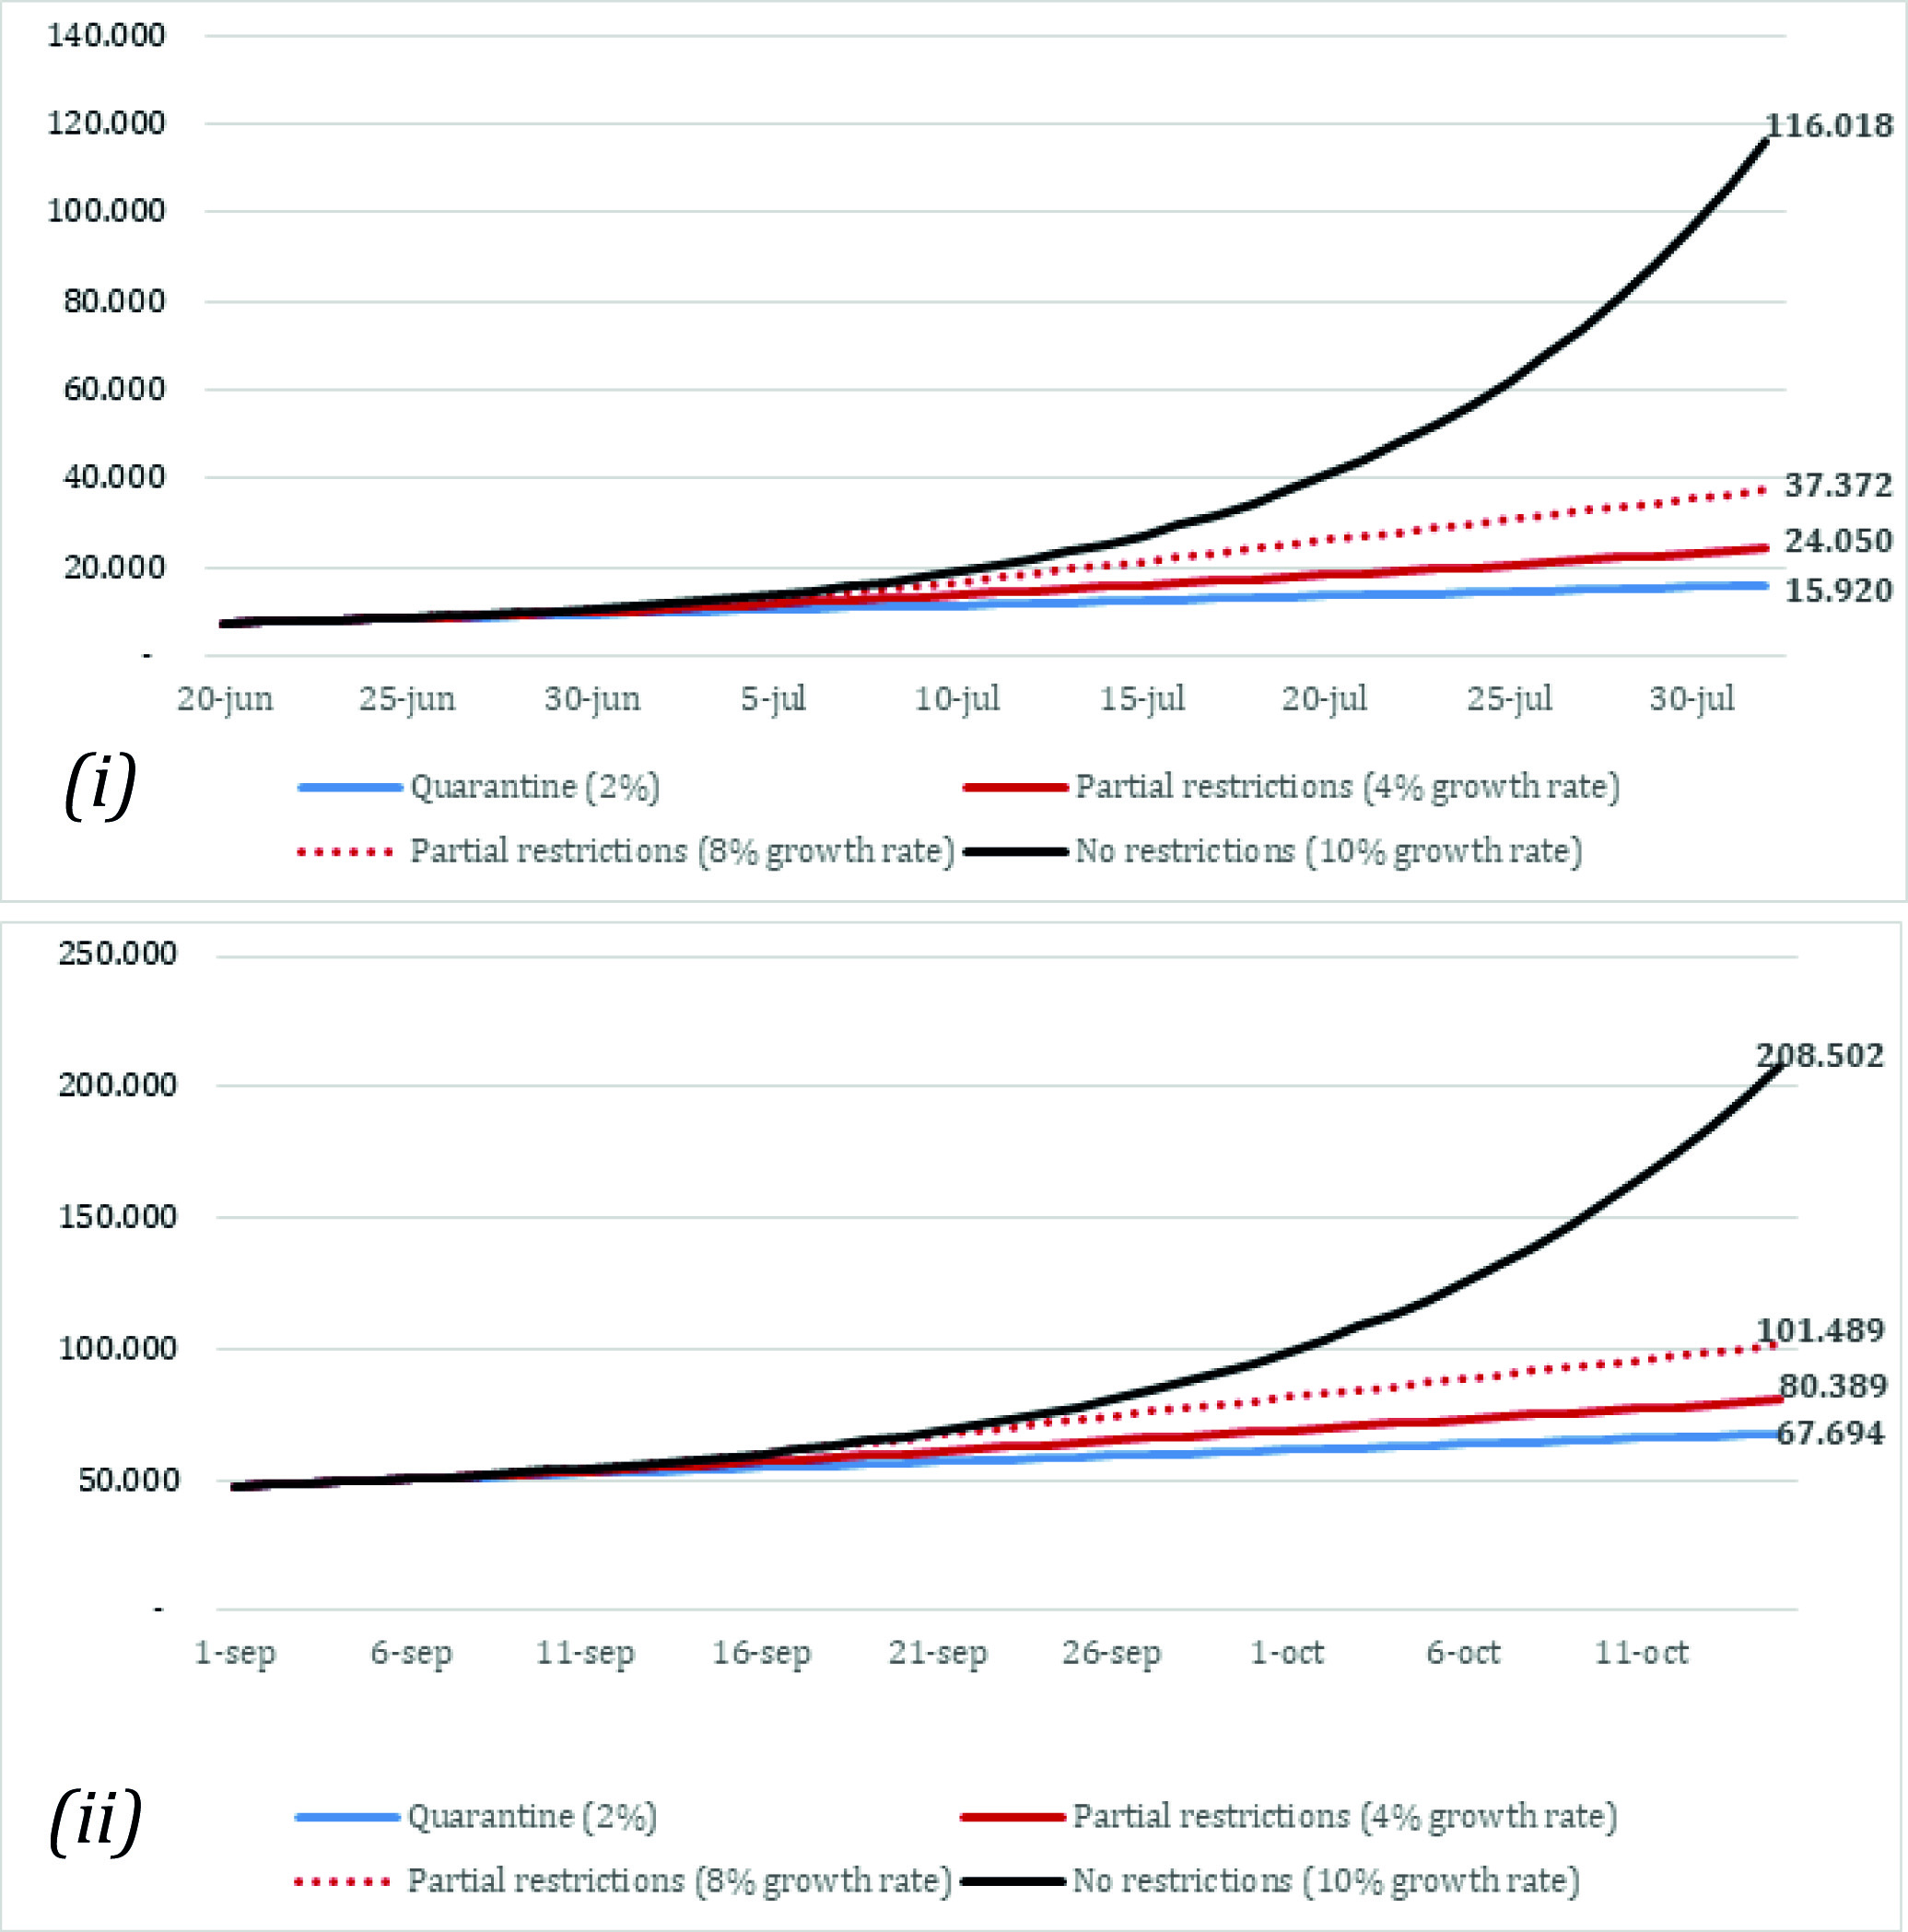
Figure 2 Model prediction of the number of cases. (i): Model predictions between June 20th 1st and August 1st (scenarios A, B, C, D). (ii): Model predictions between September 1st and October 15th (scenarios E, F, G, H). Scenarios A and E: Quarantine (daily growth of 2%). Scenarios B and F: Partial restriction (daily growth of 4%). Scenarios C and G: Partial restriction (daily growth of 8%). Scenarios D and H: No restrictions (daily growth of 10%).
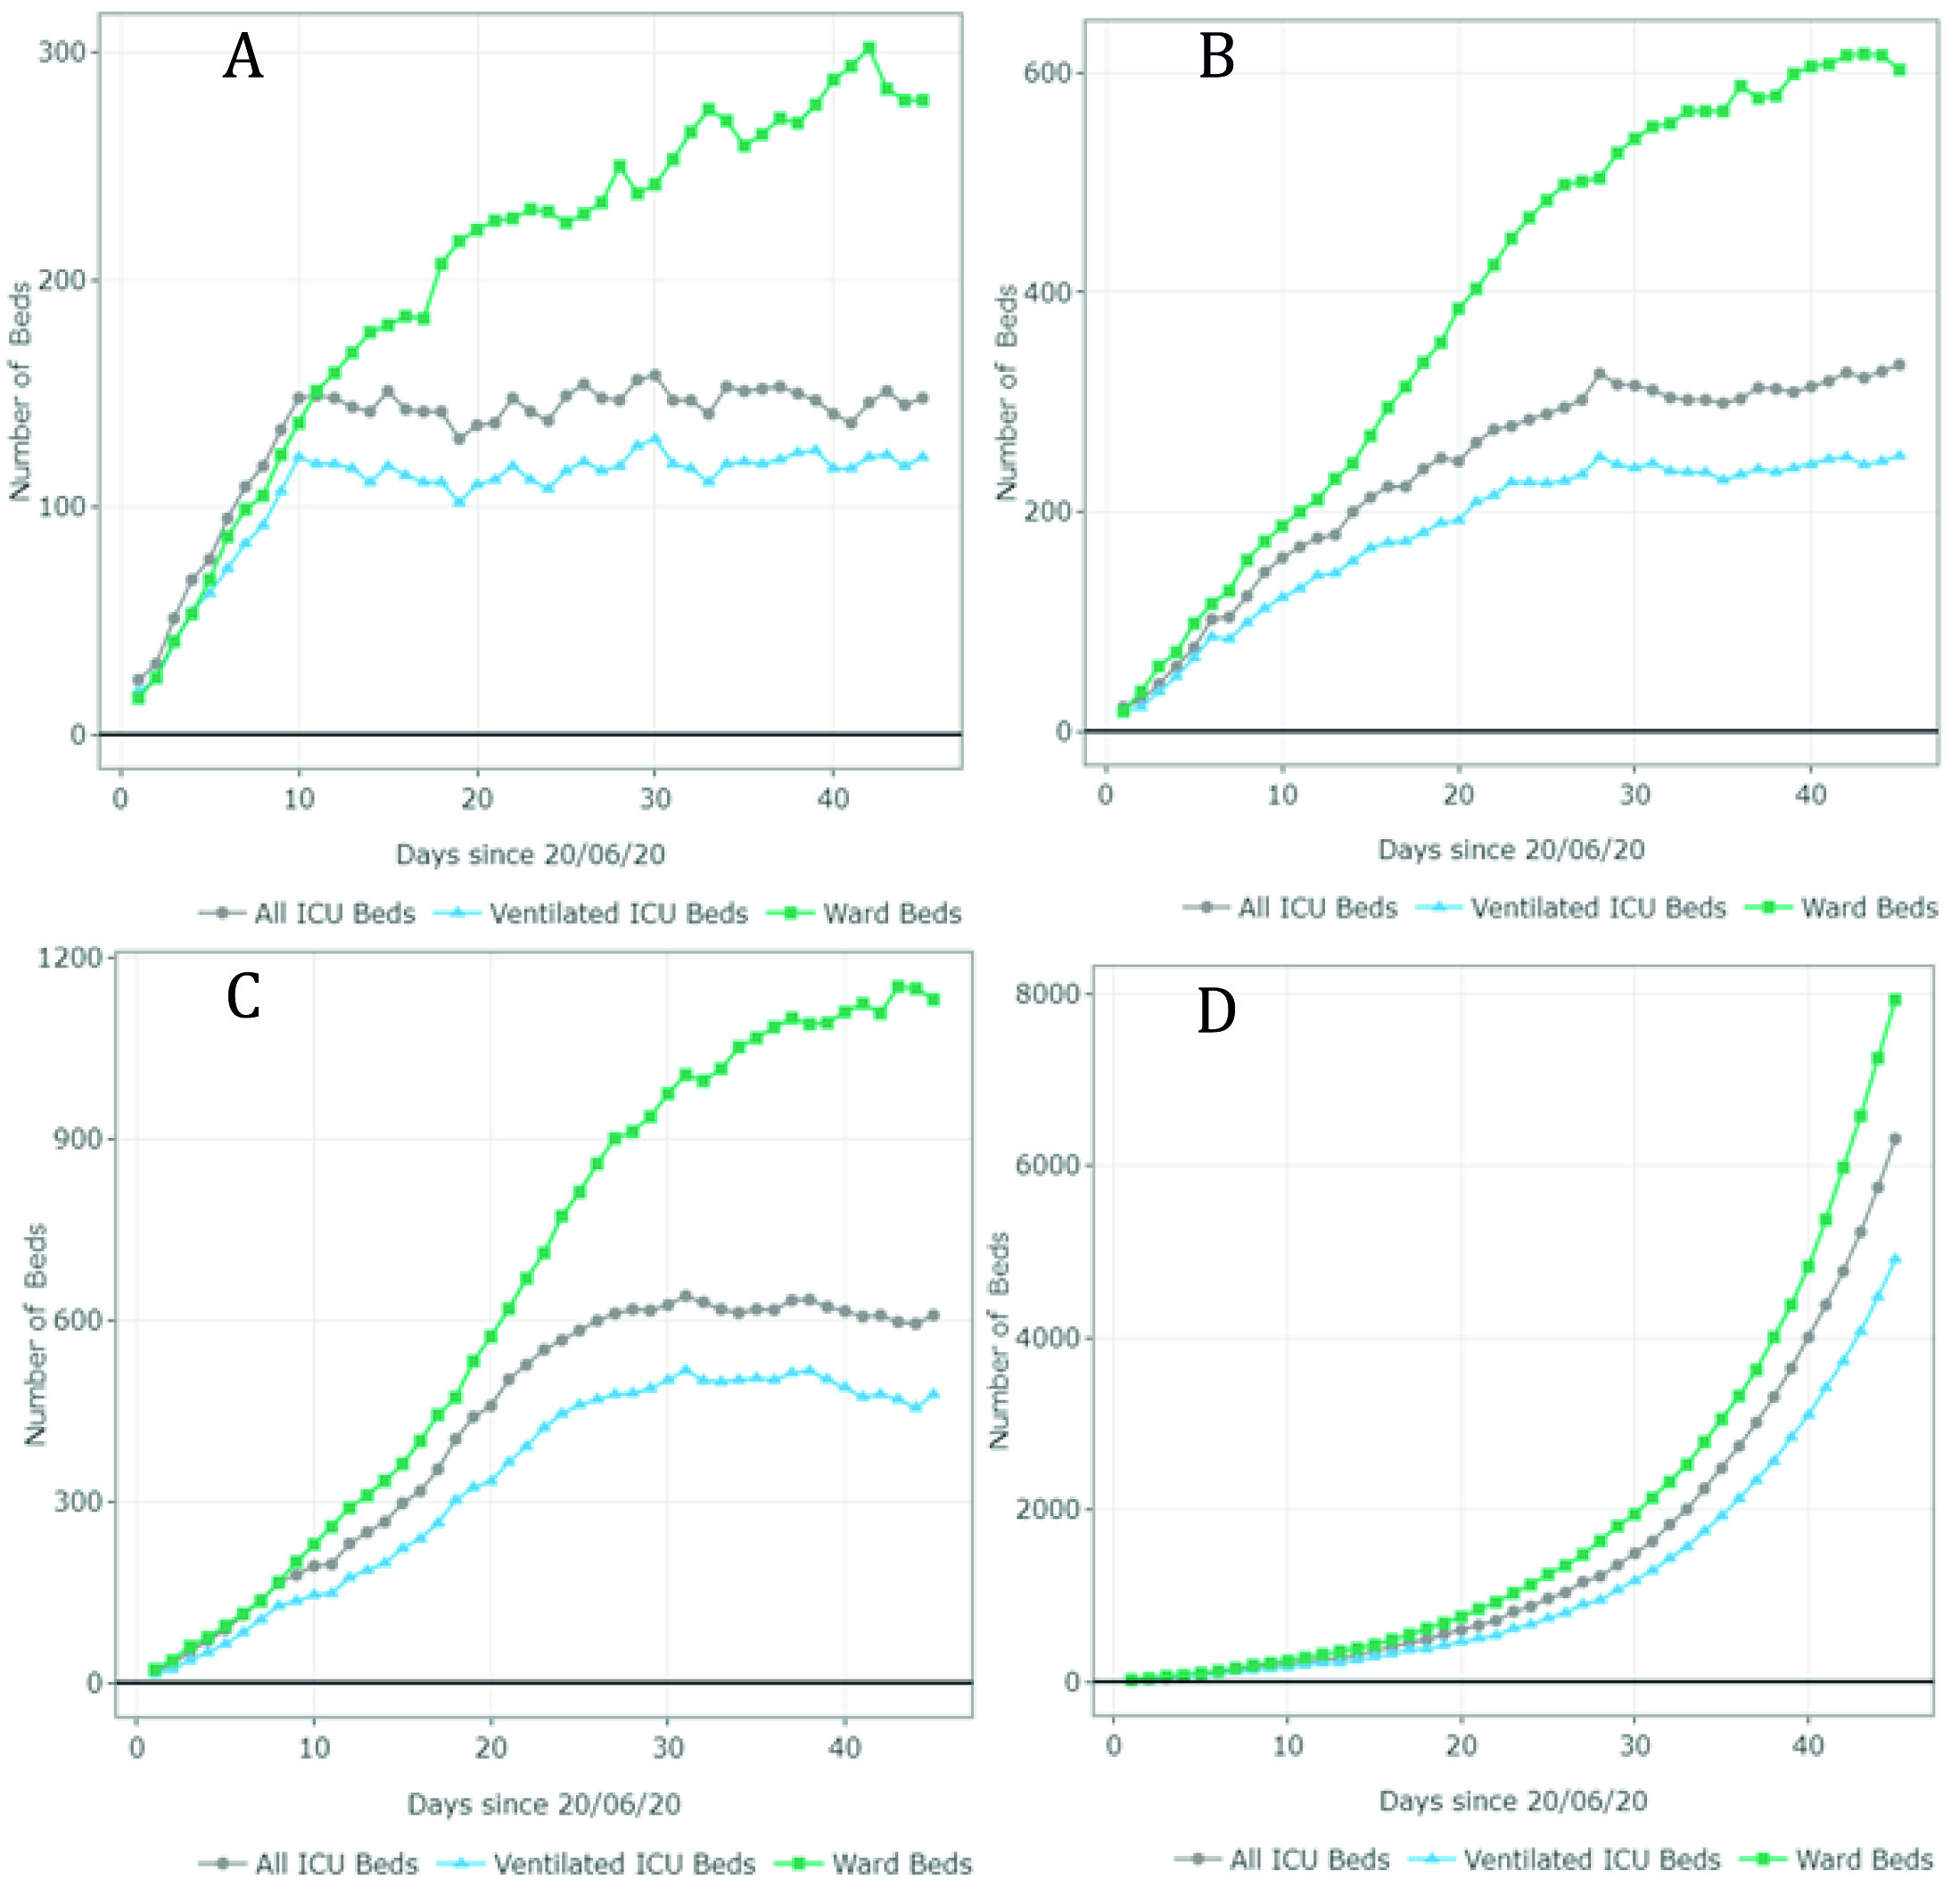
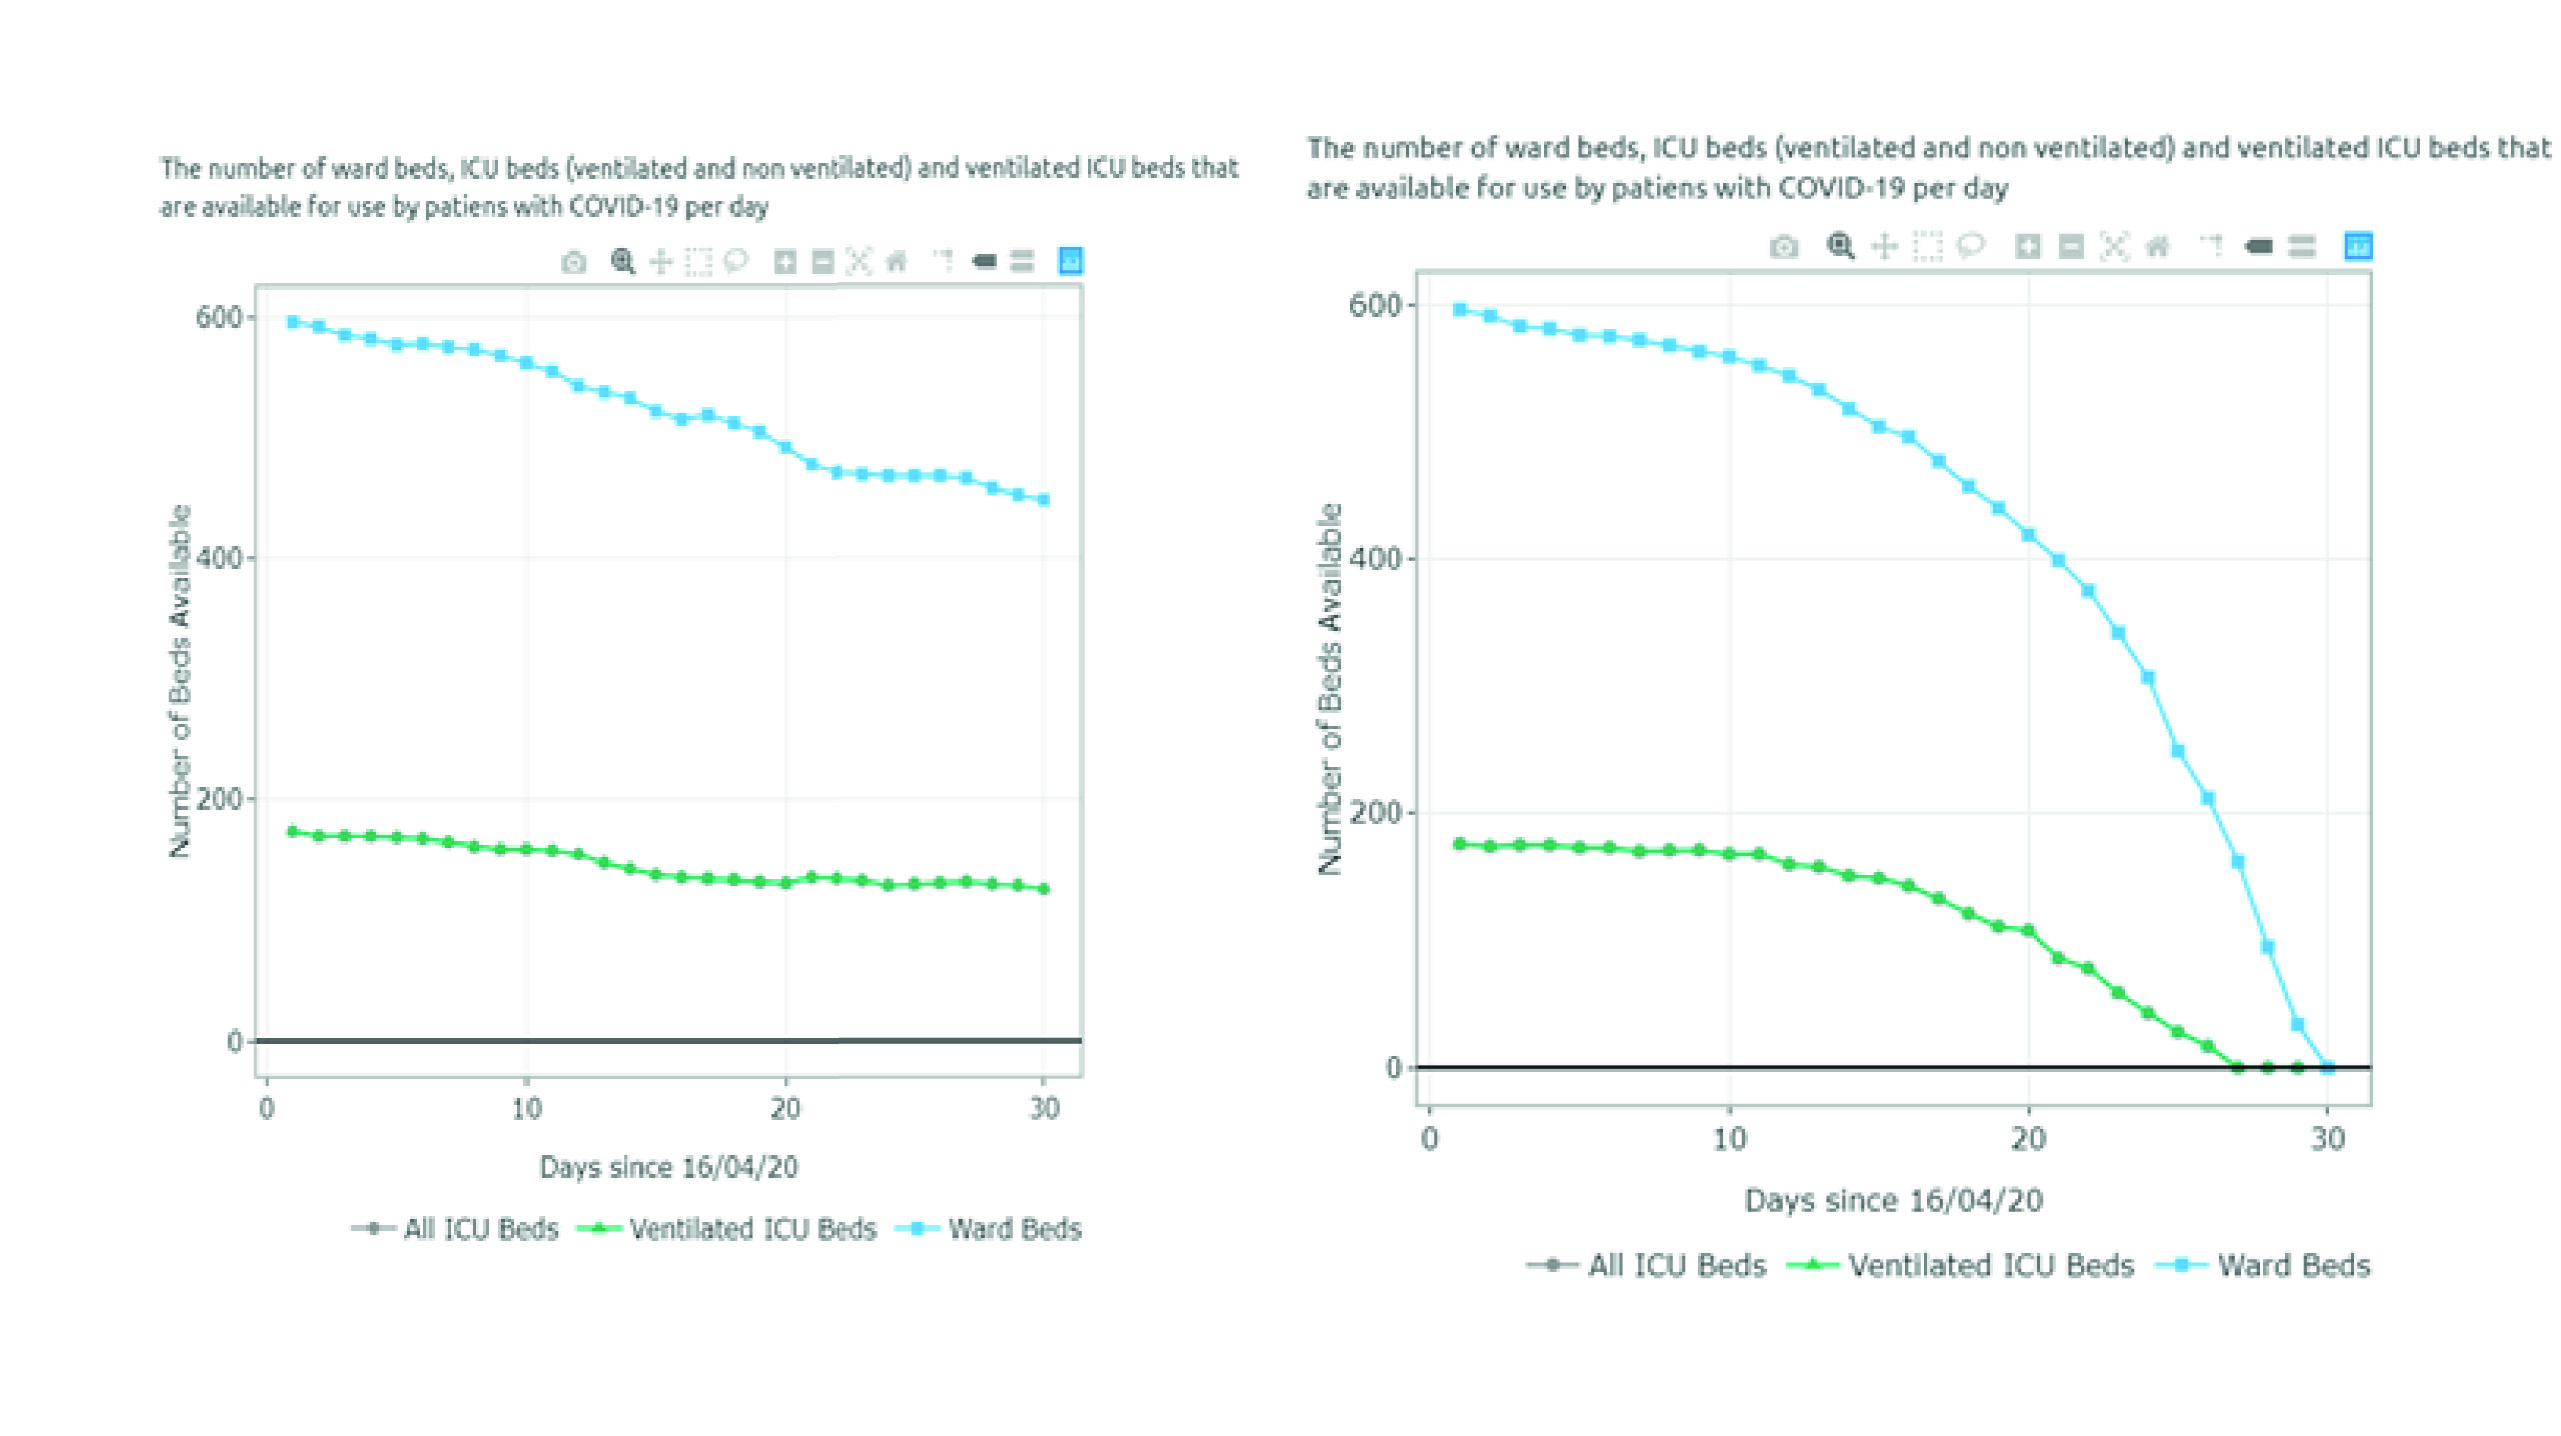
The estimates of the available and required ward and ICU (ventilated and non-ventilated) beds per day for each scenario are presented in Figures 3 and 4 and Appendix B. Figure 3 summarizes the results for scenarios A-D (June 20 - August 1). For scenario A, the model predicted 1,407 available ward beds and 349 available ventilated ICU beds by August 1st exclusively for COVID-19 patients. This represents an occupancy rate of 17% and 26% of the current ward and ICU bed capacity, respectively, considering the availability on June 20. Under partial restrictions and a 4% growth rate, 1,098 ward beds and 224 ventilated ICU beds would be available for COVID-19 patients on August 1st (35% and 52% occupancy rate of the ward and ICU bed capacity, respectively). Under scenario C (partial restrictions and 8% growth rate), the number of available ward beds was estimated at 585 (occupancy rate of 65%). However, the model predicted that the ventilated ICU beds would be completely occupied by July 16 (occupancy rate of 100%) under this scenario. Finally, the results suggest that the ICU and ward beds would be completely occupied between July 11 and July 20 (occupancy of 100%) if all social distancing restrictions were lifted as of July 1st. Observed data shows that Valle del Cauca did not run out of beds in August due to a relatively low and constant daily infection growth rate of 3-4% on July 9.
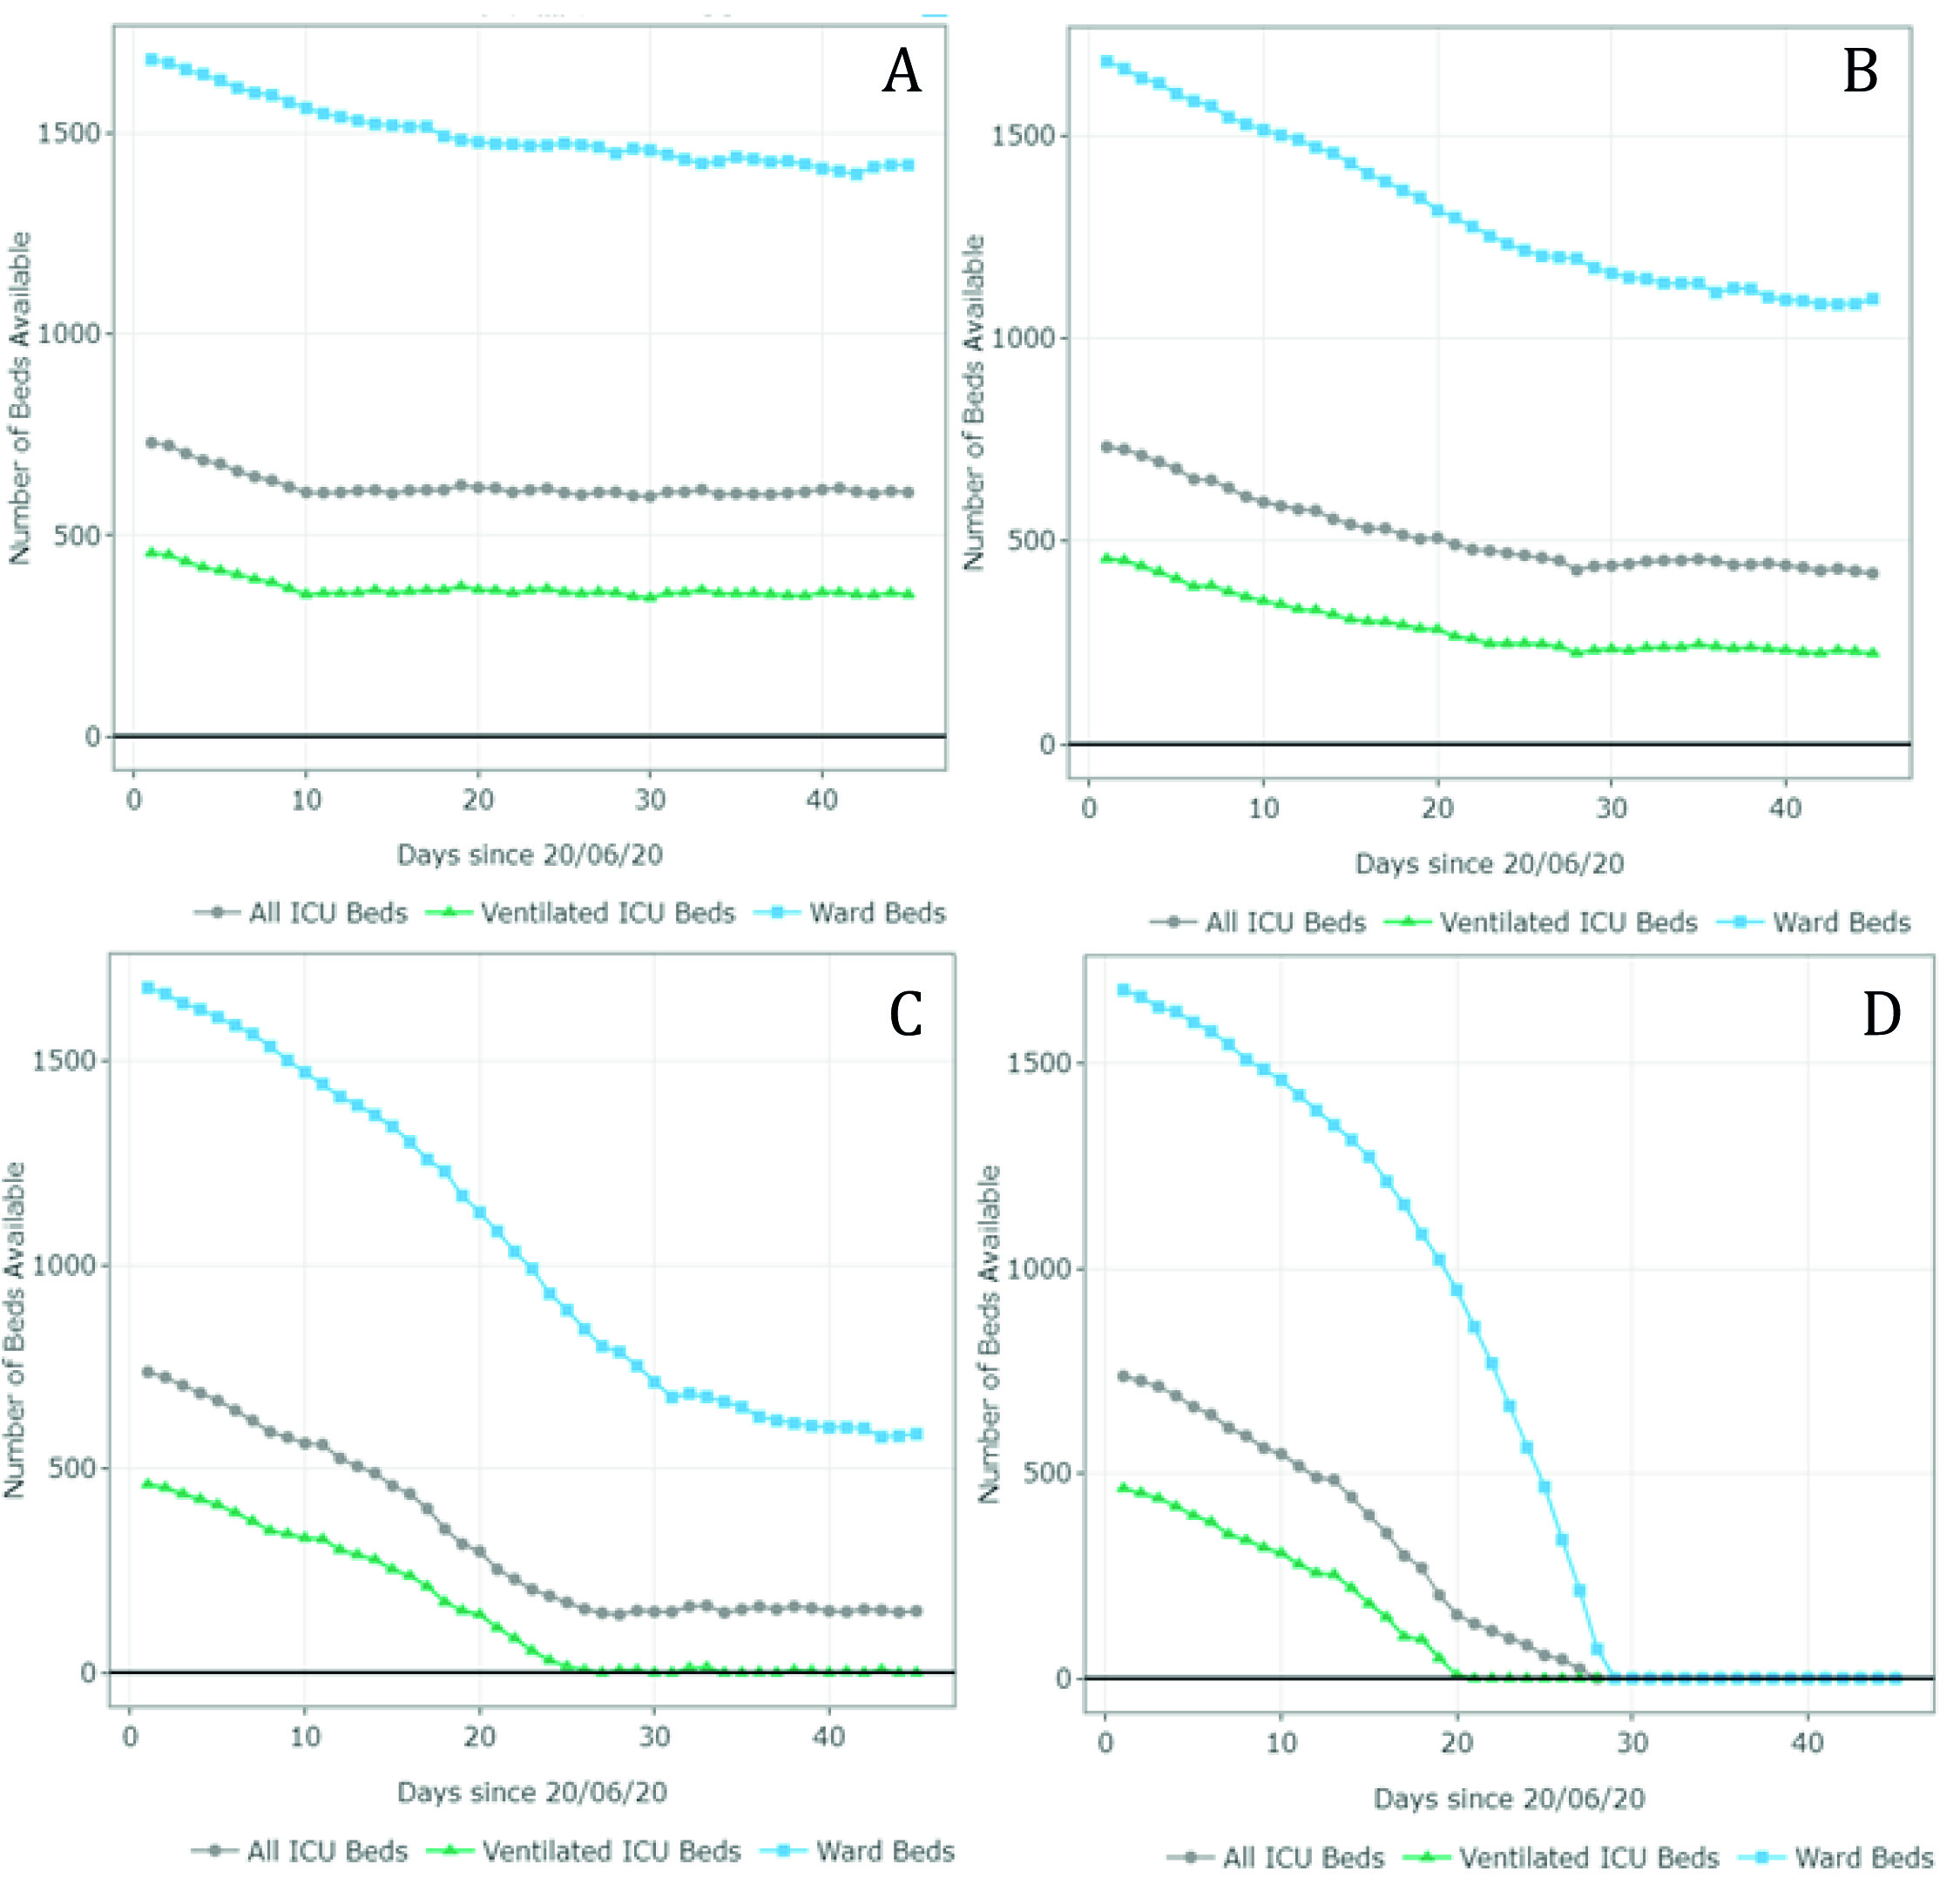
Figure 3 Number of ward and ICU beds (ventilated and non ventilated) that are available for use by patients with COVID-19 per day, between June 20th and August 1st . Scenario A - quarantine decreed in July (daily growth of 2%) - 15,920 cases by August 1st; Scenario B - partial restriction maintained in July (daily growth of 4%) - 24,050 cases by August 1st; Scenario C - partial restriction maintained in July (daily growth of 8%) - 37,372 cases by August 1st; Scenario D - No restrictions after July 1st (daily growth of 10%) - 116,018 cases by August 1st. Patients must wait for beds to become available when full occupancy is reached. Patients waiting for beds and ventilators results in higher mortality rates.
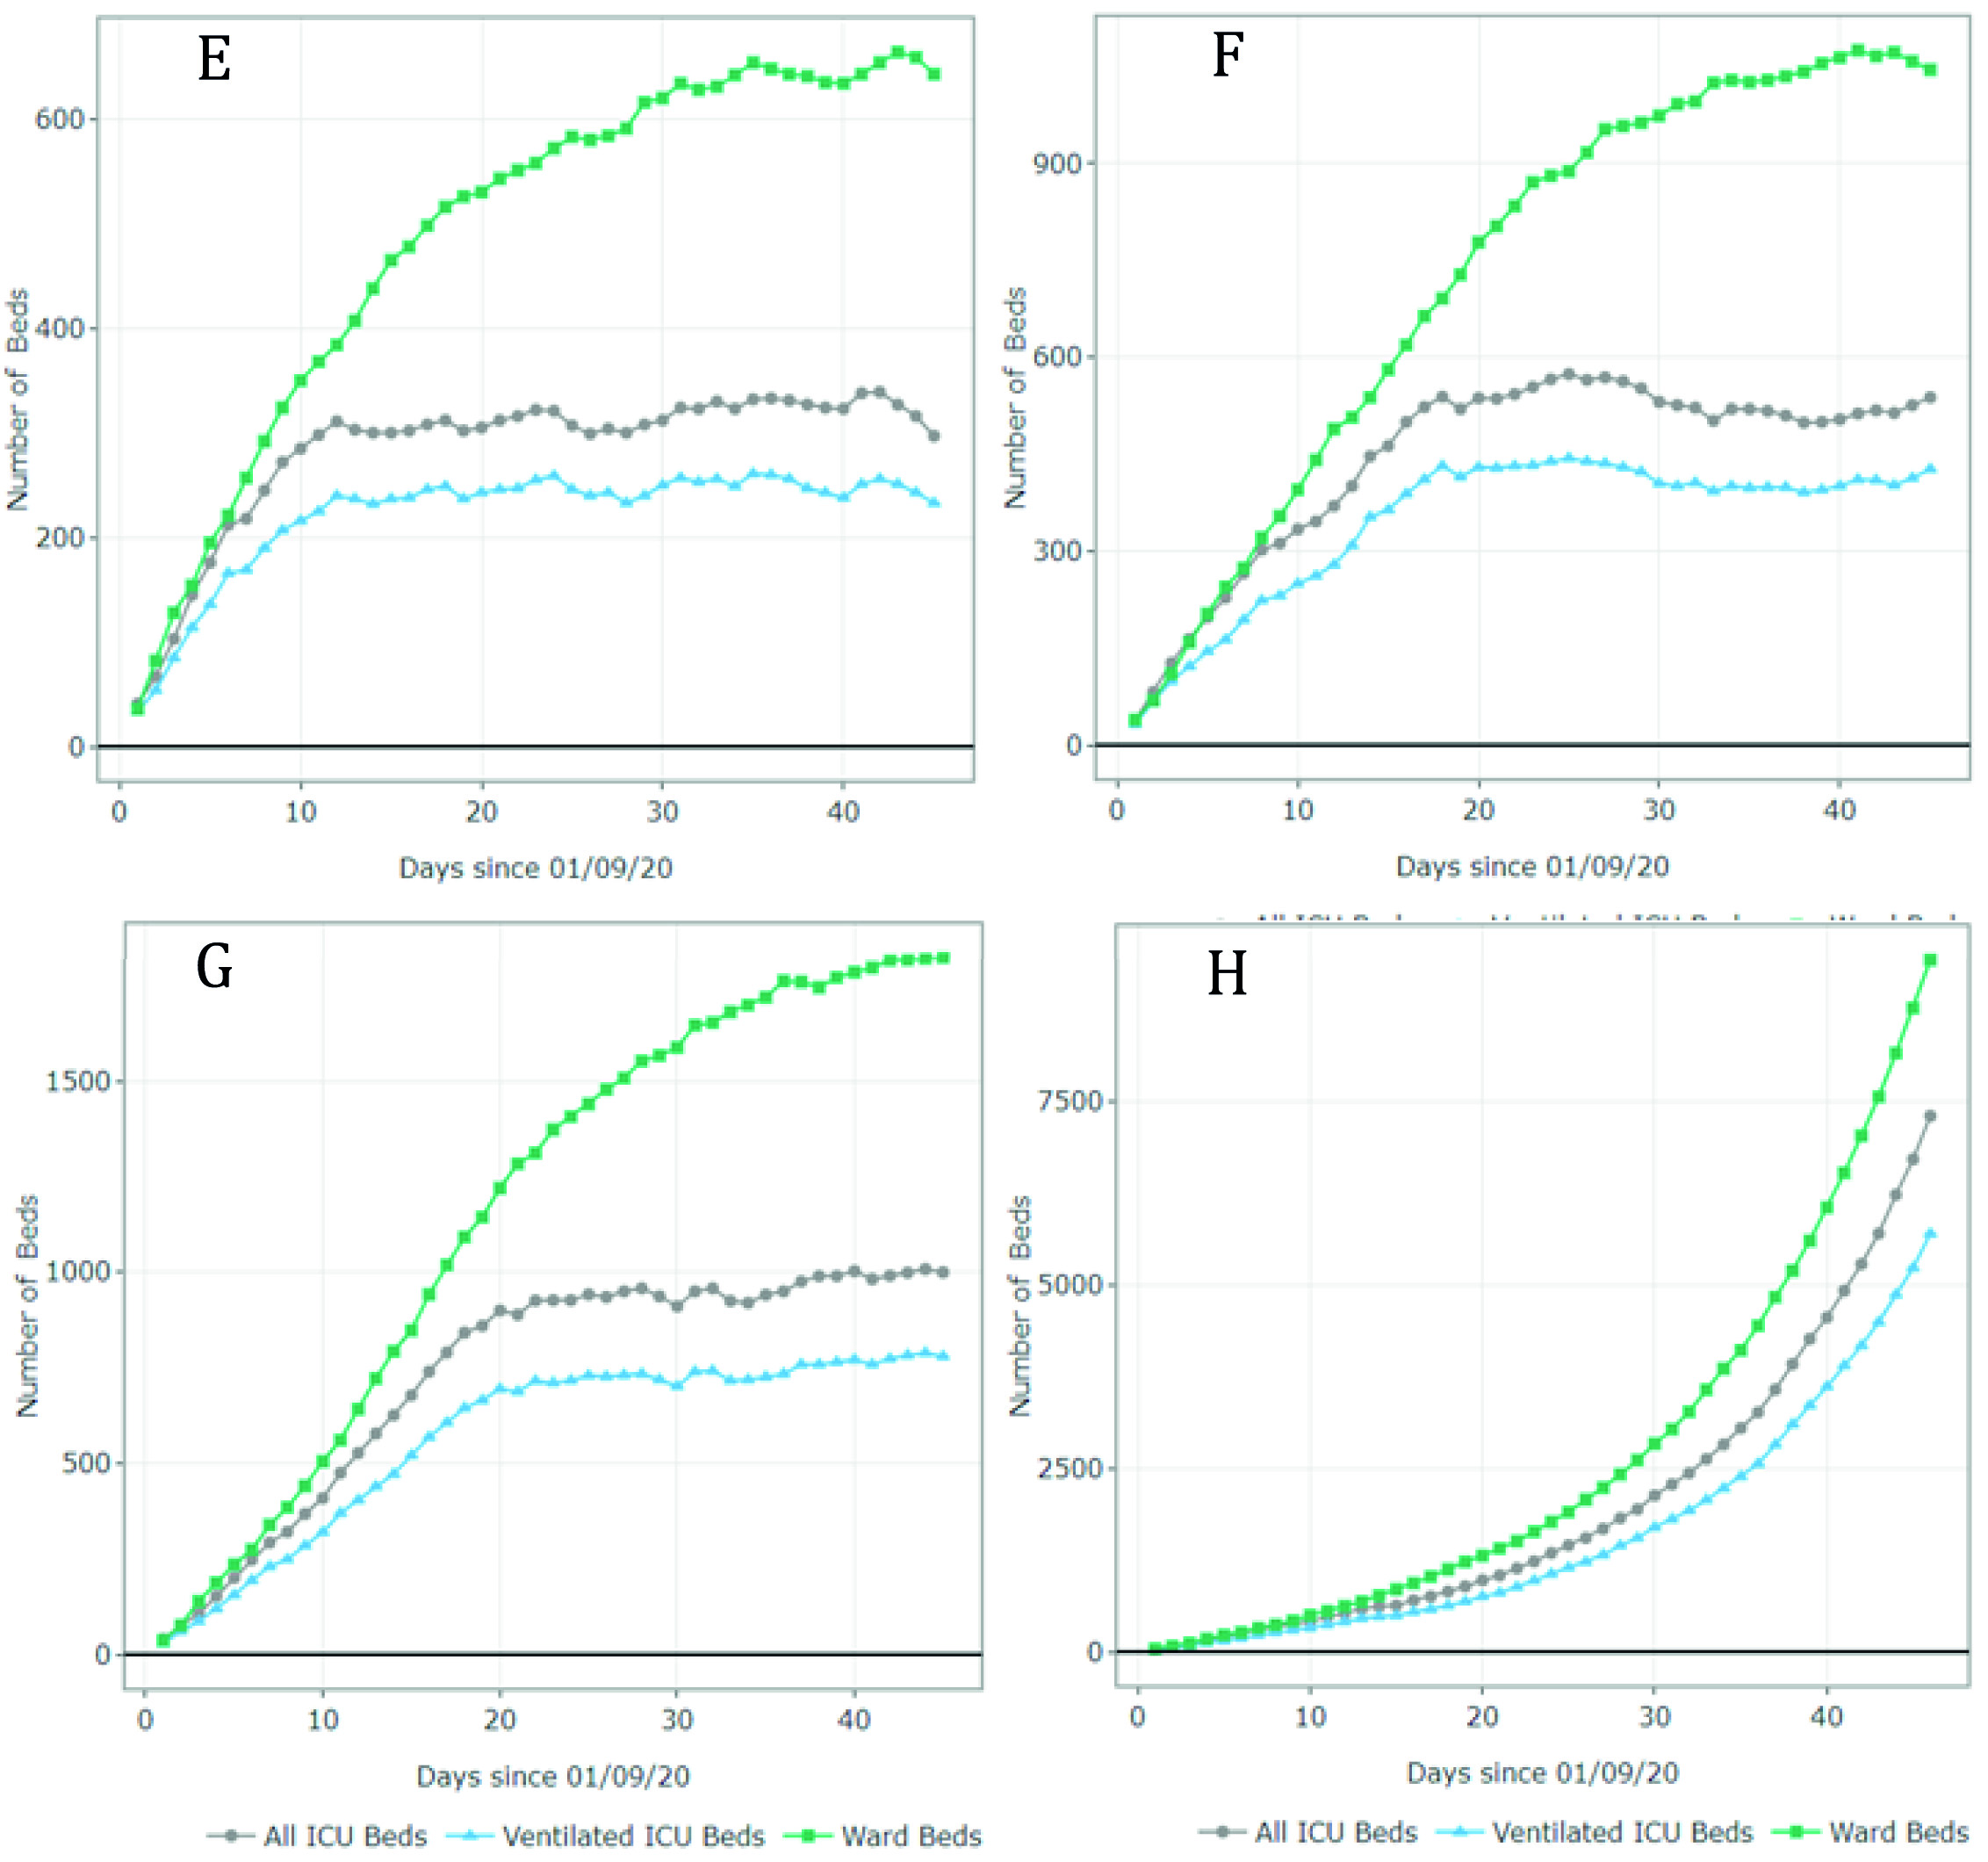
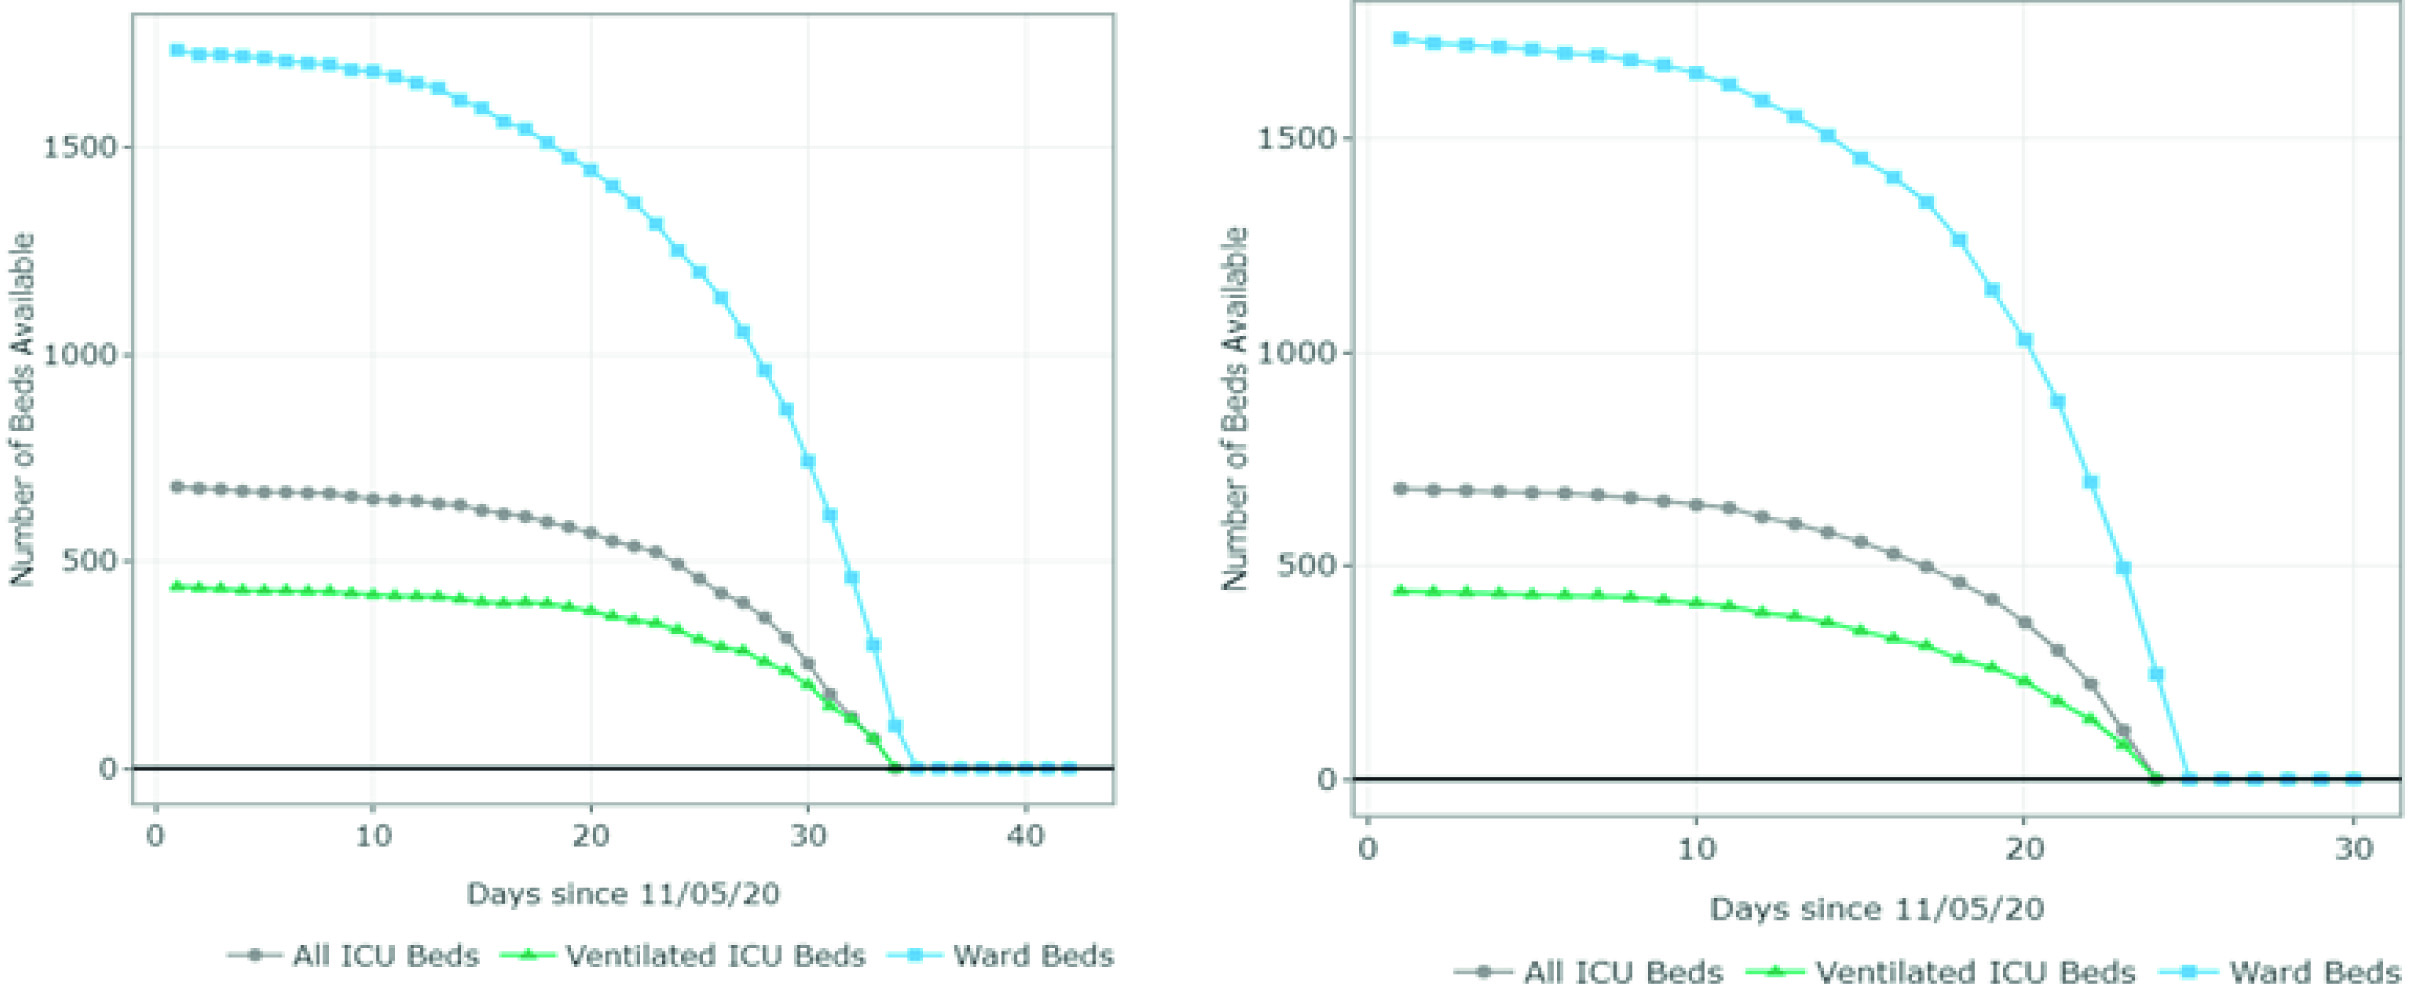
Figure 4 summarizes the results for scenarios E-H (September 1 - October 15). For scenario E, the model predicted 1,011 available ward beds and 512 available ventilated ICU beds by October 15 (occupancy rate of 40% and 30% of the current ward and ICU bed capacity, respectively). Under partial restrictions and a 4% growth rate (scenario F), 610 ward beds and 321 ventilated ICU beds would be available for COVID-19 patients on August 1st (64% and 56% occupancy rate of the ward and ICU bed capacity, respectively). Under scenario G (partial restrictions and 8% growth rate), the available ward and ICU beds were completely depleted by October 5th and September 27th, respectively (occupancy rate of 100%). Finally, the results suggest that the ward and ICU beds would be completely occupied between September 23rd and September 20th (occupancy of 100%) if all social distancing restrictions were lifted as of September 1st. These results are summarized in Table 2.
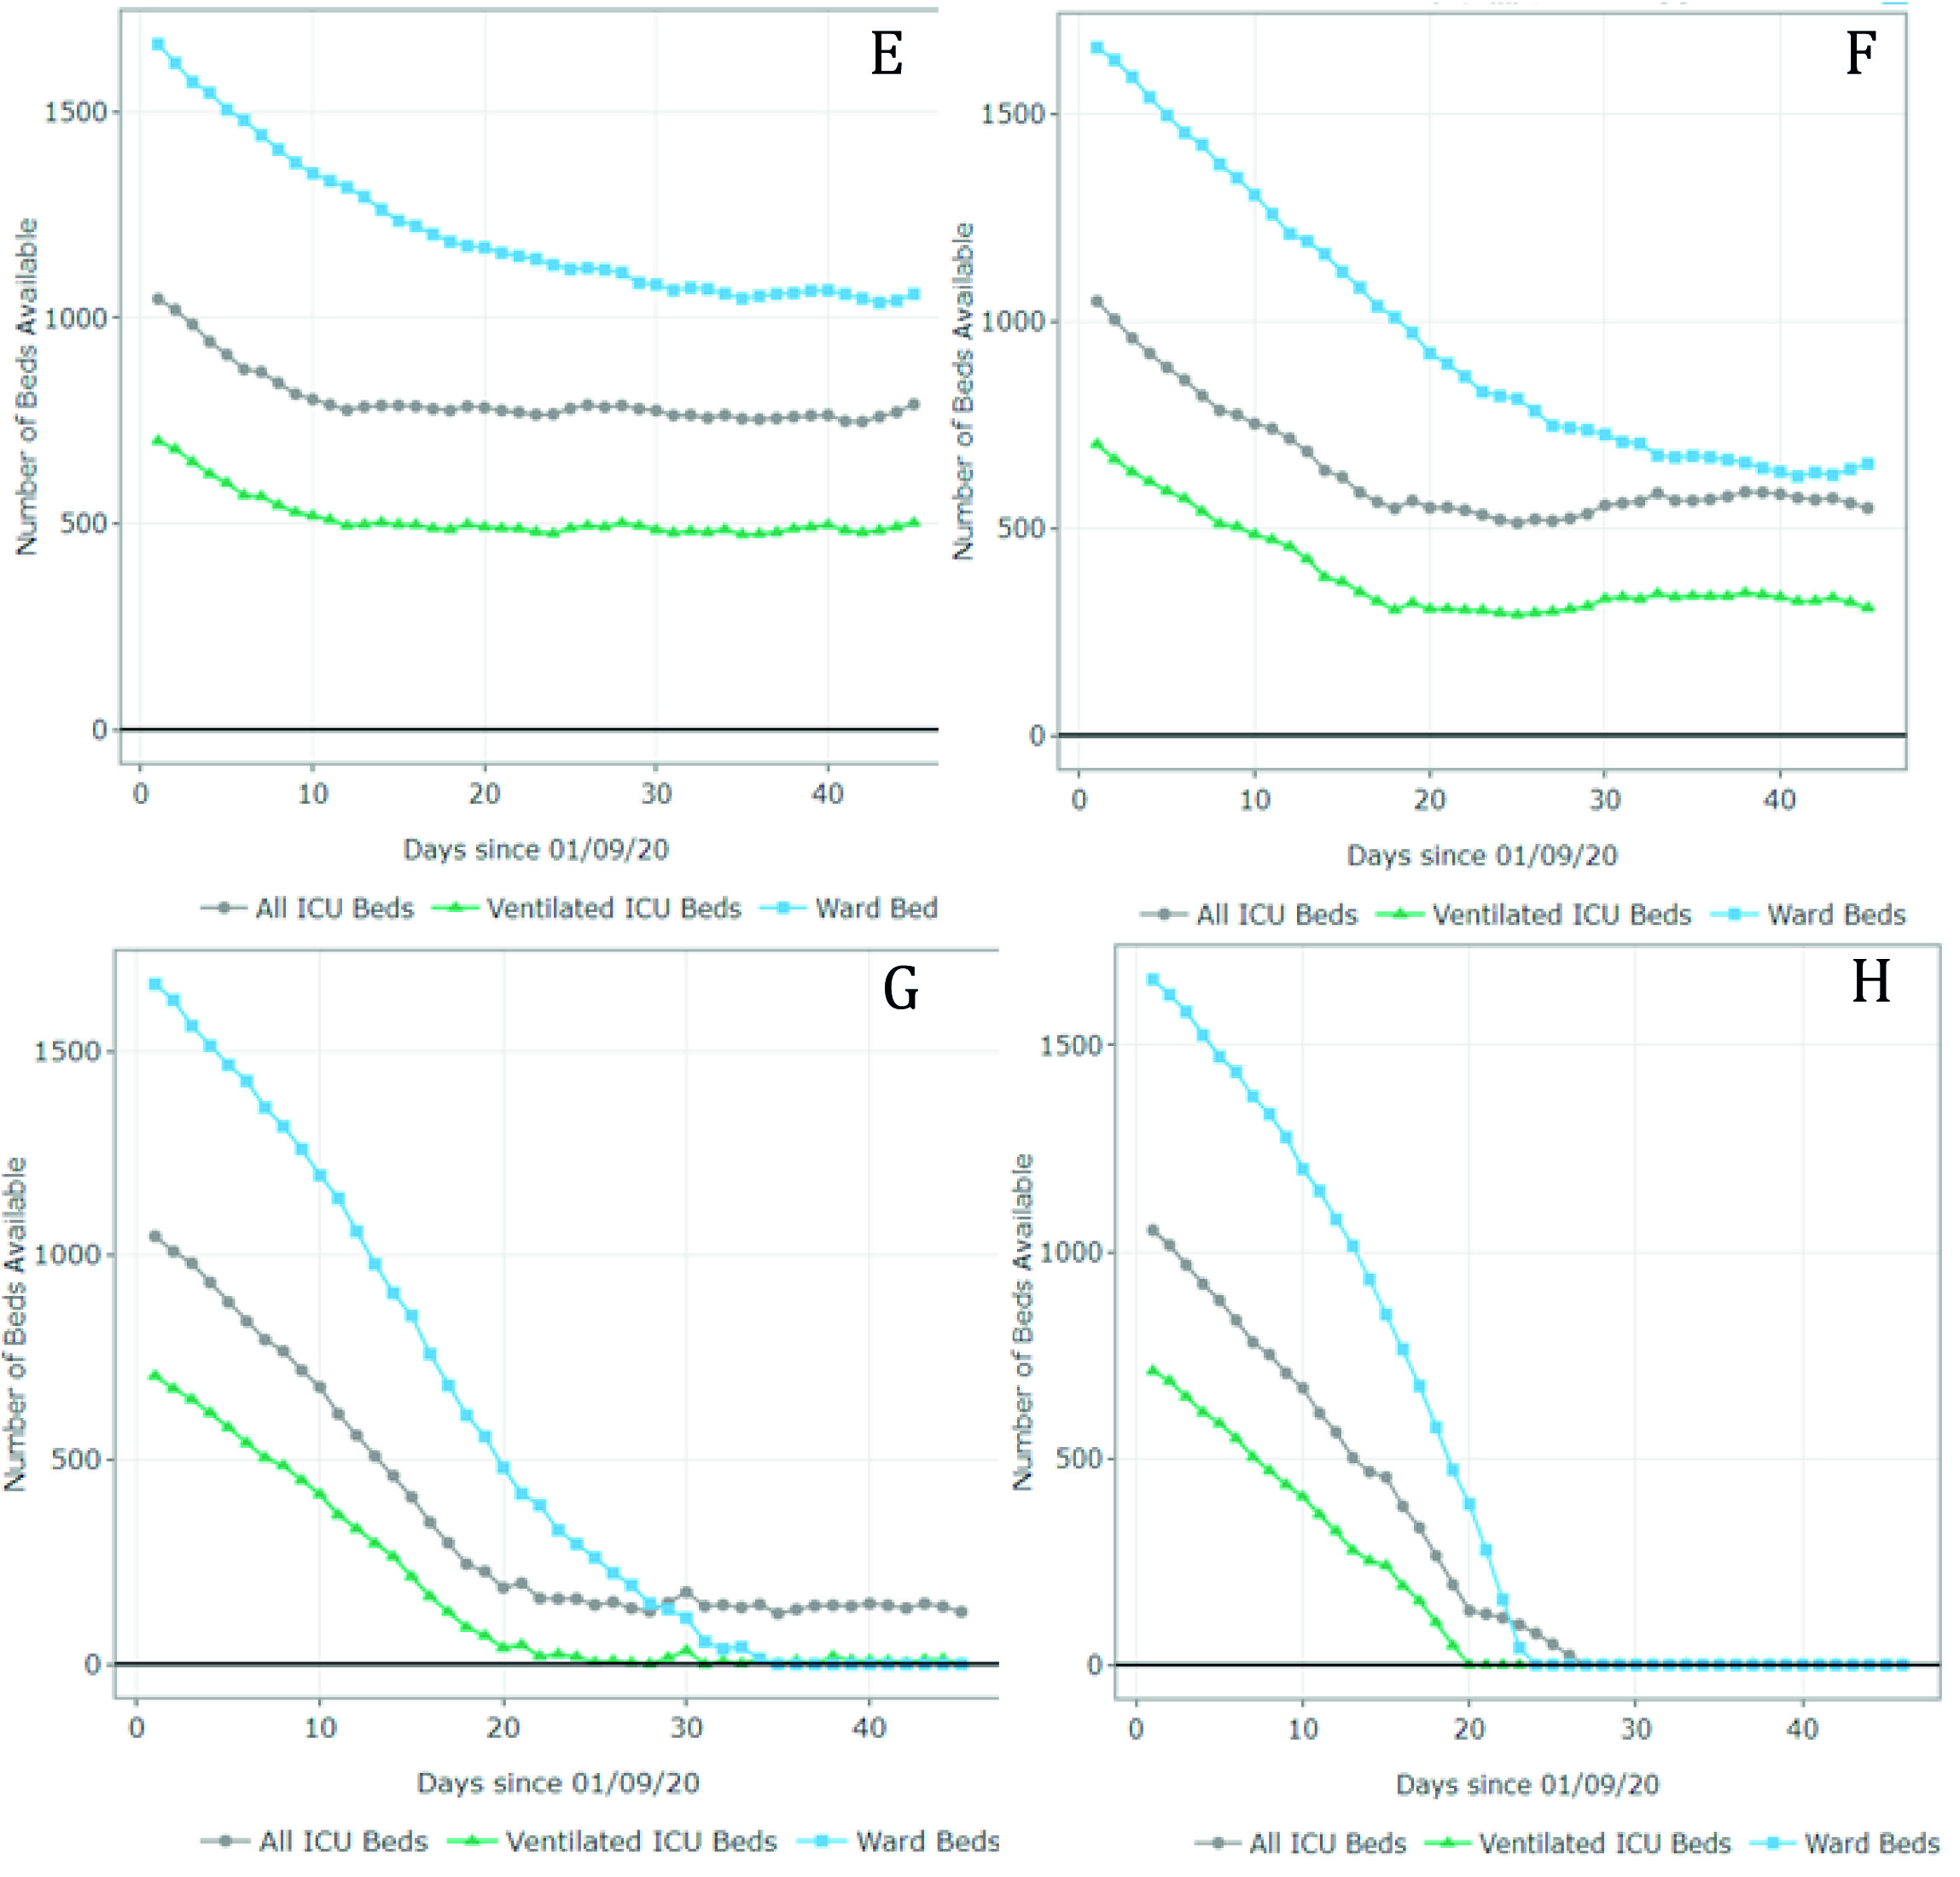
Figure 4 Number of ward and ICU beds (ventilated and non ventilated) that are available for use by patients with COVID-19 per day, between September 1st and October 15th. Scenario E - quarantine decreed in September (daily growth of 2%) - 67,694 cases by October 15th; Scenario F - partial restrictions continue in September(daily growth of 4%) - 80,389 cases by October 15th; Scenario G - partial restrictions continue in September (daily growth of 8%) - 101,489 cases by October 15th; Scenario H - No restrictions after September 1st (daily growth of 10%) - 208,502 cases by October 15th. Patients must wait for beds to become available when full occupancy is reached. Patients waiting for beds and ventilators results in higher mortality rates.
Table 2 Summary of results
| Scenario | Restrictions as of July 1st | Daily infection rate | Free ward beds (by August 1st) | Free total ICU beds (by August 1st) | Free ventilated ICU beds (by August 1s) |
|---|---|---|---|---|---|
| A | Quarantine | 2% | 1,407 | 604 | 349 |
| B | Partial restrictions | 4% | 1,098 | 421 | 224 |
| C | Partial restrictions | 8% | 585 | 151 | 0 (totally occupied by July 16) |
| D | No restrictions | 10% | 0 (totally occupied by July 20) | 0 (totally occupied by July 17) | 0 (totally occupied by July 11) |
| Scenario | Restrictions as of September1st | Daily infection rate | Free ward beds (by October 15th) | Free total ICU beds (by October 15th) | Free ventilated ICU beds (by October 15th) |
| E | Quarantine | 2% | 1,011 | 653 | 512 |
| F | Partial restrictions | 4% | 610 | 507 | 321 |
| G | Partial restrictions | 8% | 0 (totally occupied by October 5th) | 88 | 0 (totally occupied by October September 27th) |
| H | No restrictions | 10% | 0 (totally occupied by September 23rd) | 0 (totally occupied by September27th) | 0 (totally occupied by September 20th) |
Even though Figures 3 and 4 can be used to identify the moment at which the beds are fully occupied (i.e., the date at which the available number of beads reaches 0), it does not explain how many additional beds would be required. Appendix B shows the number of beds required per day for each scenario. For example, in scenario G, the number of required ventilated ICU beds on October 15 was estimated at 810 when assuming an infection rate of 8%. This is at least 1.1 times the capacity on September 1st. In scenario H, the number of required ventilated ICU beds was estimated at over 5,000 (at least 7 times the current capacity).
We estimated the number of deaths, including avoidable deaths, i.e., deaths due to unavailability of resources, between June 20th and August 1st, and between September 1st and October 15th (Table 3). The expected number of deaths for the first two scenarios (A and B - quarantine at 2%, and partial quarantine at 4%) was estimated at 301 and 535, respectively. There were no deaths due to resource constraints given sufficient ward and ICU beds, as well as ventilators. On the contrary, the number of expected deaths for scenarios C and D (partial restrictions at 8%, and no restrictions at 10%) was estimated at 1,050 and 9,211, respectively. This translated to 150 and 5,996 avoidable deaths for each scenario, given an unlimited availability of resources. The results for the scenarios between September 1st and October 15th were similar. Since resources were not expected to run out for scenarios E and F, increasing hospital and ICU beds would not necessarily avoid COVID-related deaths. However, assuming higher infection rates under scenarios G and H, the model predicted additional avoidable deaths. If the growth rate increased to 8% with partial restrictions, Valle del Cauca could prevent 46 deaths between September 1st and October 15th by increasing hospital capacity at least by 30 ventilated ICU beds. The number of avoidable deaths for the most severe scenario (10% infection rate with no restrictions) was estimated at 6,831. However, an additional 3,600 ventilated ICU beds would be required.
Finally, based on the predicted number of cases for each scenario, we estimated the number of required tests (Appendix C). Scenario E, with a daily growth rate of 2%, is expected to represent 20,250 additional cases (i.e., 67,694 predicted cases on October 15th - 47,444 cases on September 1st) between September 1st and October 15th. Considering a positivity rate of 10%, a total of 202,500 PCR tests would be required to identify these new cases. The number of required tests was estimated at 328,450 and 540,450 when assuming a partial quarantine and a daily infection rate of 4% and 8%, respectively. Finally, the number of required tests for the most extreme scenario, assuming no restrictions and a daily infection rate of 10%, was estimated at 1,610,580.
Table 3 Number of avoidable deaths per scenario given an unlimited availability of ward and ICU beds
| Scenario | Deaths between June 20th and August 1st | Deaths (with unlimited availability of beds) | Avoidable deaths |
|---|---|---|---|
| A - Quarantine (2%) | 301 | 301 | 0 |
| B - Partial quarantine (4%) | 535 | 535 | 0 |
| C - Partial quarantine (8%) | 1,050 | 1,200 | 150 |
| D - No restrictions (10%) | 9,211 | 3,215 | 5,996 |
| Scenario | Deaths between September 1st and October 15th | Deaths (with unlimited availability of beds) | Avoidable deaths |
| E - Quarantine (2%) | 664 | 664 | 0 |
| F - Partial quarantine (4%) | 1,056 | 1,056 | 0 |
| G - Partial quarantine (8%) | 1,747 | 1,701 | 46 |
| H - No restrictions (10%) | 11,409 | 4,578 | 6,831 |
Scenario A - quarantine decreed in July (daily growth of 2%) - 15,920 cases by August 1st;
Scenario B - partial restriction maintained in July (daily growth of 4%) - 24,050 cases by August 1st; Scenario C - partial restriction maintained in July (daily growth of 8%) - 37,372 cases by August 1st; Scenario D - No restrictions after July 1st (daily growth of 10%) - 116,018 cases by August 1st.
Scenario E - quarantine decreed in September (daily growth of 2%) - 67,694 cases by October 15th; Scenario F - partial restrictions continue in September (daily growth of 4%) - 80,389 cases by October 15th;
Scenario G - partial restrictions continue in September (daily growth of 8%) - 101,489 cases by October 15th;
Scenario H - No restrictions after September 1st (daily growth of 10%) - 208,502 cases by October 15th.
Validation of case prediction
Appendix D summarizes the validation exercise. The predicted cases follow a similar trend as the observed data. Between March 16 and March 26, the number of cases increases considerably, until the national quarantine was put in place. This marked a reduction trend up to April 27, when the number of cases started increasing due to the implementation of more flexible measures.
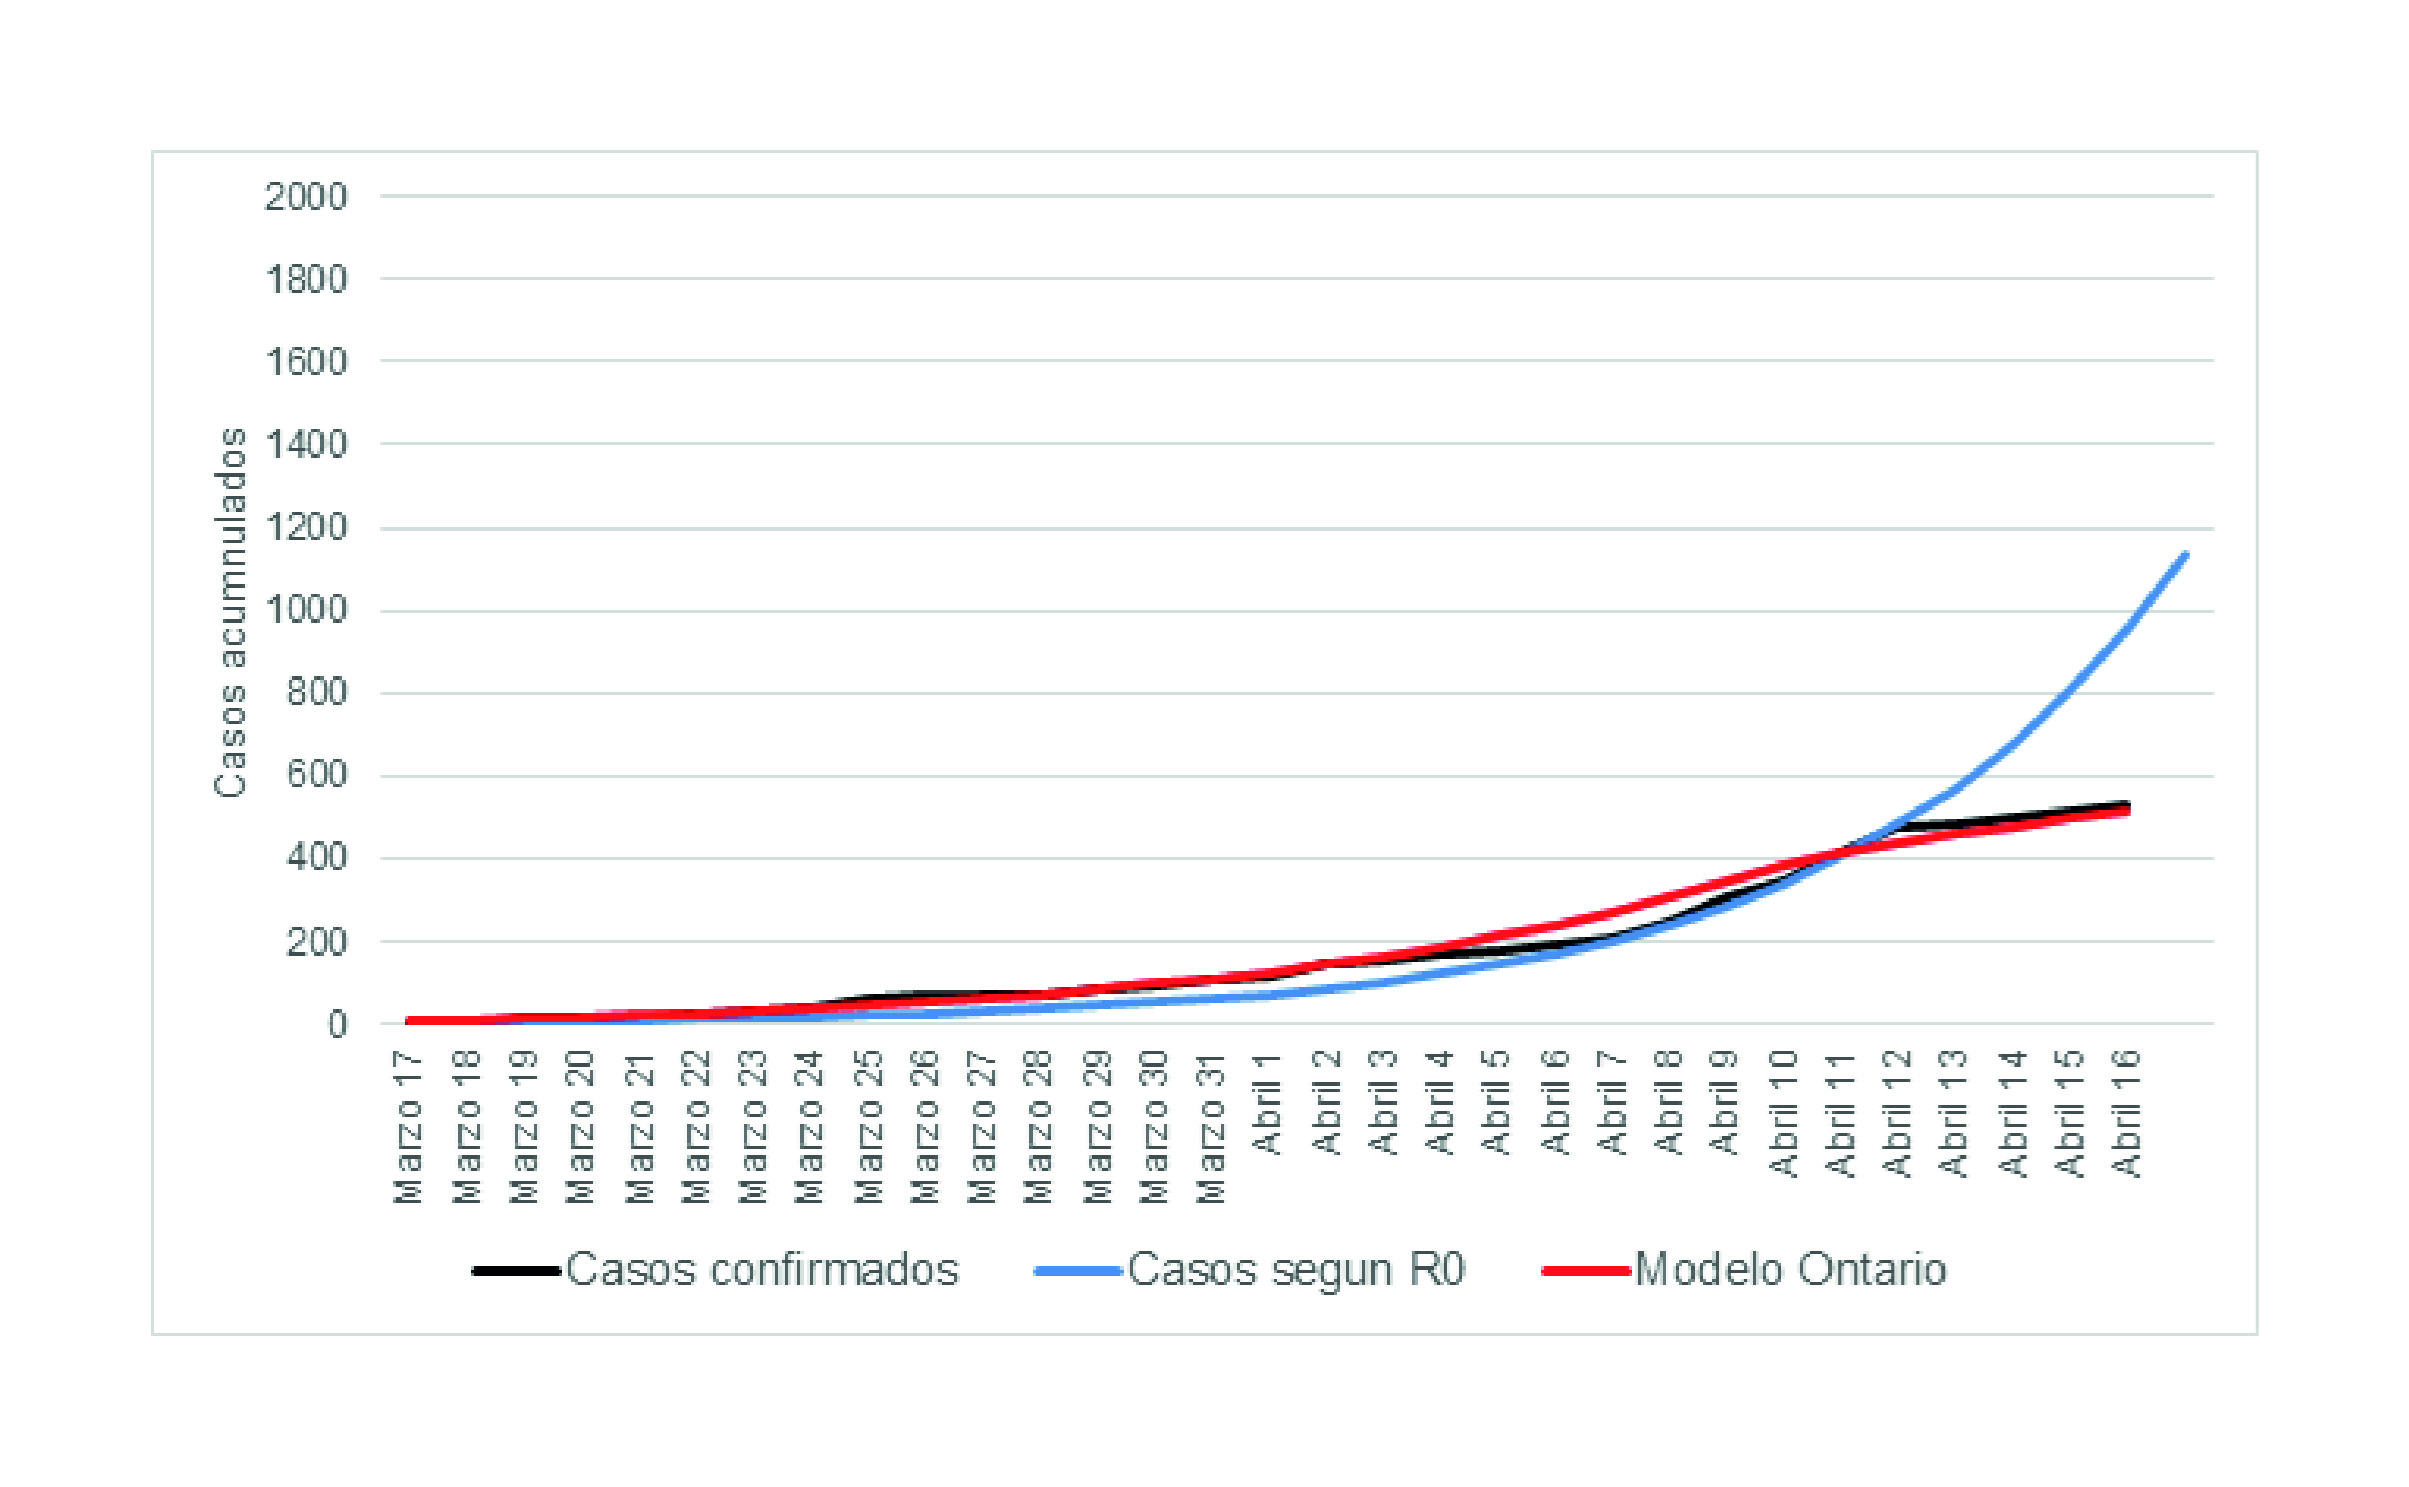
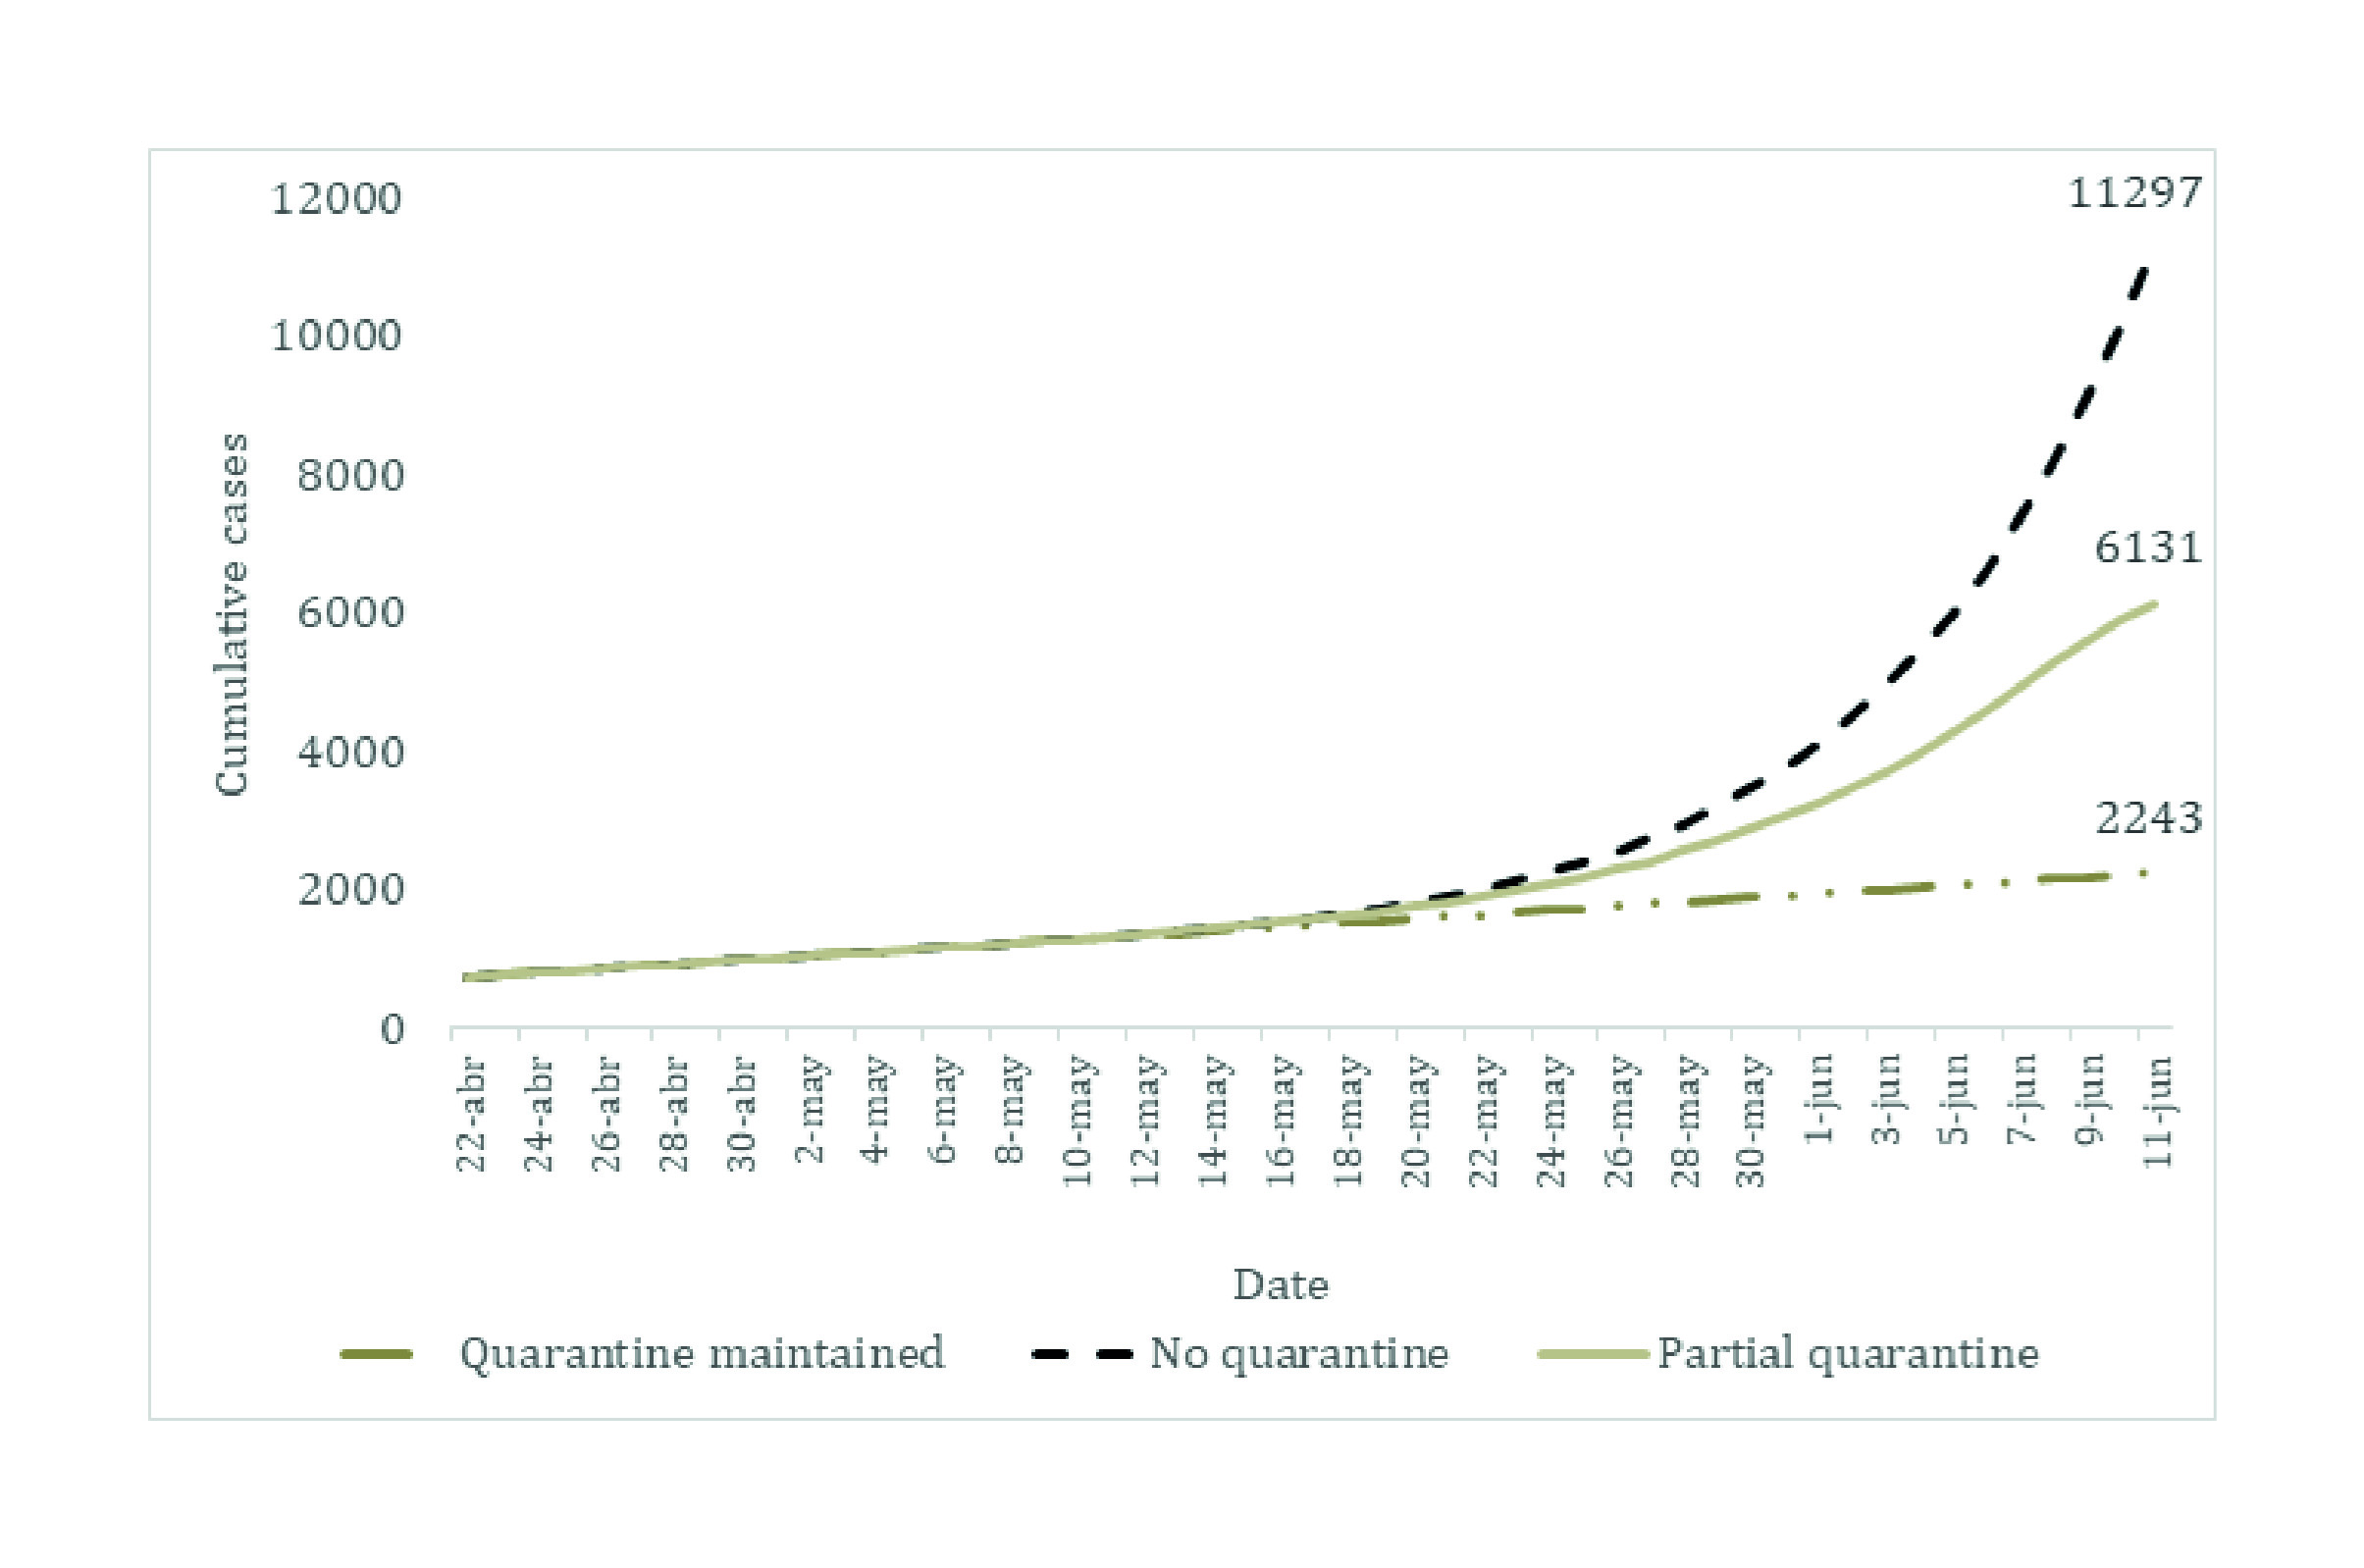
Prior analyses
Additional model predictions are presented in Appendix E. We added the first modelling exercises that were conducted between March and May.
Discussion
Given the lack of specific and effective anti-COVID-19 therapies, decision-makers require timely and accurate data to determine the disease incidence and hospital resources needed to mitigate the impact of the pandemic. As of July 1st, 2020, Valle del Cauca had the third-highest number of COVID-19 cases in Colombia, with over 10,000 cases reported. On September 1st, Valle del Cauca registered over 50,000 cases. Analyses of the data collected since the SARS-CoV-2 introduction to Colombia demonstrate that hospitals in Valle del Cauca may experience significant strain on their ICU and ward bed resources due to COVID-19 in the coming month after social distancing restrictions were relaxed. Our results support policy measures to rapidly identify and create opportunities to curb the infection and expand ICU capacity to care for critically ill patients. Our results also demonstrate that the hospital bed capacity may be insufficient. Thus, we must identify policies that enable patients to move quickly through the hospital system and allow the accommodation of an increased number of patients.
The analyses assuming high infection rates predicted that all available hospital and ICU beds for COVID-19 patients would be fully occupied between July 11 and July 20. On the other hand, analyses assuming lower infection rates under a full or a partial quarantine predicted a higher availability of beds and an occupancy rate between 17% and 65% of the ward and ventilated ICU beds by August 1st. Although implementing a new quarantine was expected to yield the lowest number of predicted cases and required resources, a partial restriction with low infection rates (e.g., 4-7%) could allow for the reactivation of additional economic sectors while avoiding a complete depletion of hospital and ICU beds. As such, the government of Valle del Cauca maintained partial restrictions between June and August. The predicted cases under this scenario (~4% daily growth rate) closely resembled the observed cases by August 1st (24,050 estimated compared with 25,628 observed (9). As predicted, the hospitals and health care sectors were running close to full capacity, but the availability of ICU and ward beds and COVID-19 was always maintained. Additionally, the government of Valle del Cauca worked on acquiring additional hospital and ICU beds, which acted as a safeguard against higher-than-expected infection rates. This explains why the bed availability was higher on September 1st than June 20th. The infection rate in Valle del Cauca is expected to increase considerably in September, as restrictions were lifted on September 1st at a national level. Therefore, considering the results of this study, health authorities must ensure that daily infection rates do not surpass 4% and that additional resources are made available. A scenario with no restrictions and a 10% infection rate would collapse the hospital system in 20 days.
Although local governments have previously used similar model predictions to inform decision-making, it is important to highlight the limitations of our analysis. First, there is a limited number of national and international studies upon which to draw data to populate the model. Therefore, we extracted data from international studies, which may not adequately represent the Colombian context. Second, although the CORE model prioritizes patients by wait times, it does not take into account changing health status while waiting. Third, the model does not consider the potential increase for the demand of hospital resources in Valle del Cauca from neighbouring regions with limited capacity, as regional borders within Colombia are reopened. Additionally, we did not consider additional resource constraints such as medical staff, personal protective equipment, and medications. Furthermore, it is important to note that these results do not simulate the effect of public interventions targeted at specific population groups. For example, allowing the construction sector to resume activities is expected to have a different effect on the rate of infections compared with office jobs. Construction workers are usually outdoors, and office workers are often confined to smaller enclosed spaces. Therefore, the rate of infection would be expected to be higher if office workers, who can more easily work from home, are allowed back. However, construction demands multiple complementary activities, goods, and service providers. As such, future work includes modelling public policies involving different economic sectors, to determine the best way to re-open the economy while ensuring enough hospital resources are available. Finally, future versions of this work could incorporate the effects of the introduction of novel treatments or vaccines, to ensure that the modelling closely resembles the status quo as it continues to evolve.
Predictive models are important tools to understand the potential impact of implementing preventive measures to tackle health issues, such as the COVID-19 pandemic. However, their capability is often limited to the quality and availability of data. In this case, we used the COVID-19 CORE model during different phases of the pandemic and across different international settings. While acknowledging the limitations associated with this predictive model, the task force comprised by the University of Toronto, Pontificia Universidad Javeriana, and government representatives from Valle del Cauca, developed a decision-making process that involved iterative predictive analyses that built upon new data availability and lessons learned. To better understand this process, we included previous predictions during the early stages of the pandemic. Although the objective of this study did not include analyzing these data, we provided them so the reader can observe how the model was used iteratively to produce more nuanced estimates that decision-makers used to strengthen specific policies that were enacted.
Although infection rates appear to have been reduced in Valle del Cauca and Colombia, it is paramount that decision-makers and government representatives continue using these tools to predict potential scenarios, specifically after introducing policies such as the termination of social distancing restrictions. Our results show that if the daily infection rate is increased beyond 8% in September-October, and no restrictions are quickly re-enacted, the health care system could rapidly collapse due to the lack of ICU and hospital beds.