


 text in
  English (pdf)
 Article in xml format
 Article references
 Send this article by e-mail
 Cited by SciELO
  Cited by Google
  Similars in
SciELO
Similars in
SciELO  Similars in Google
 Permalink
Remark
| 1) Why was this study conducted? |
| The proportion of cesarean deliveries in Colombia is high. However, neither the overall contextual effect nor the effect of department-specific characteristics on the individual likelihood of cesarean section has yet been explored. |
| 2) What were the most relevant results of the study? |
| A large department-contextual effect on the possibility of C-section was observed by using a multilevel analysis of individual heterogeneity. Differences in the individual characteristics of pregnant women between departments did not explain this effect. However, the region to which the department belonged explained most of the contextual effect. Thus, birthplace plays an important role in the individual likelihood of C-section. |
| 3) What do these results contribute? |
| The large department-contextual effect indicates that to reduce C-section in Colombia, it would be efficient to target interventions in some departments, particularly those in the Caribbean region. The distribution of the residuals showed that in some departments the proportion of cesarean deliveries was much lower than expected, which also merits special attention. The multilevel analysis of individual heterogeneity can be used as a public health precision strategy in the prioritization of interventions with a proportional universalism approach. |
Introduction
Cesarean section or C-section is recommended when vaginal delivery is not possible due to the mother’s or fetus’ conditions. It is intended to reduce maternal-perinatal complications 1. However, this procedure is not risk-free. Newborns born by C-section have greater respiratory morbidity, sharp injuries to the skin, skull fractures, humerus, clavicle, femur, and brachial plexus injuries 2. Likewise, mothers are at greater risk of uterine hemorrhage, wound infection, respiratory distress 3,4, and inadequate implantation of the placenta in future pregnancies 2. Therefore, C-section should be carried out when the benefits outweigh the risks. In spite of this, most of them have no specific medical indication 5. Births by C-section have increased from 15% to 33% worldwide in the last 25 years 6. Statistics vary between countries 7. In Brazil and the Dominican Republic, the proportion of cesarean deliveries exceeds 50% 8, while in Guatemala it is 18% 9. In Colombia, it has increased from 24.9% in 1998 2, to 37.2% in 2008 10 and 44.4% in 2018 11. Faced with this situation, the World Health Organization (WHO) has identified cesarean delivery as a public health problem and has proposed, that in order to maintain the maternal perinatal benefit, its percentage should be between 10 and 15% 5,12-14. In addition, it proposed Robson's classification (based on obstetric history and current pregnancy) as a guide for comparison between different places or institutions 5. In Colombia, the proportion of Robson's groups differs between cities 13,15, and the proportion of cesarean deliveries varies between departments 16. In this regard, the influence of contextual factors on the mode of delivery have already been described, such as the public or private nature of the institution 17, the limitation of specialized human resources, and contracting at differential rates 2.
The influence of context on health outcomes is usually studied under the ecological model framework (18 and can be quantified using multilevel statistical models 19,20. The advantages of using multilevel models in the assessment of contextual effects have been widely described 21-23. By using these models, differences between departments for example, are not measured as the simple difference between proportions. Instead, they are measured as the percentage of the total variance in the individual risk of C-section attributed to the department level (20. Determining the relevance of each level (individual, contextual or both) in the outcome, would allow identifying where to allocate interventions and resources to improve health care indicators.
Given that the proportion of cesarean deliveries in Colombia is high, the existence of a small department-contextual effect would indicate that the departments share similar behavior and therefore all of them should be intervened to reduce the proportion of cesarean deliveries. On the contrary, if the contextual effect is large, the department plays an important role in the individual risk, and therefore, specific departments could be selected for being intervened. Therefore, the objectives of this study were to determine (i) the overall contextual effect of the department on the likelihood or odds of C-section, and (ii) the effect of individual and context-specific characteristics on this risk. For this purpose, a multilevel analysis of individual heterogeneity and discriminative ability was used 19,24. Their results provide guidance on the type of intervention (universal, selective, or proportional universalism) 25,26 that would be most efficient in reducing C-section in Colombia.
Materials and Methods
This is a Cross-sectional analytical study of a cohort of births in Colombia. The information from the life birth certificates was sourced from the National Administrative Department of Statistics (DANE) database. Births between January 1, 2016 and December 31, 2016 were included. The certificate was filled out immediately after the birth by the health professional (usually the doctor or nurse) in attendance. In areas of the country where deliveries are not attended by professionals, nursing assistants and health promoters are authorized fill out the certificate. This database can be accessed openly through the DANE web page. Before releasing the information, DANE carries out a review process, codification, quality control, and information processing 27, as well as eliminating personal identification data, and converting quantitative variables to qualitative to protect anonymity.
The protocol for this study was approved by the ethics committee of the Pontificia Universidad Javeriana, Cali (Act 007: 2019, with approval date 28/09/2019).
Non-institutional deliveries were excluded, since they do not have the opportunity to undergo this surgical procedure; in fact, none of them were by cesarean section. Multiple pregnancies were also excluded due to their high indication for C-section and the impossibility of identifying paired records in the database. Hence, the number of live births corresponds to the number of pregnant women. Those births with missing values in the study variables were excluded from the analysis.
The outcome variable was mode of delivery, classified as cesarean or vaginal (including instrumental vaginal deliveries). The main contextual variable was the department. Regarding the political-administrative point of view, Colombia has 33 divisions: a capital district, Bogotá, and 32 departments, which are governed from their respective capital cities. At this level, three department-specific characteristics were evaluated: gross domestic product as an economic indicator 28, the timeliness of obstetrician appointments as an indicator of the availability of specialists, and the region to which they belong. Gross domestic product was classified according to the growth rate for 2016 by DANE as decreasing (<0%), low (0%-1.9%), medium (2%-2. 9%) and high (≥3%) 29). The timeliness of obstetrician appointments was classified as very low (≥ 7 days), low (6-6.99 days), medium (5.1-5.99 days) and high (0-5 days) 30. The departments are grouped into five geographic regions: Amazon, Andean, Orinoquia, Pacific, and Caribbean and Insular (Table S1, supplemental material). In addition to their geographic proximity, these regions share similar cultures. Due to the small number of cases in the Insular region and its proximity to the Caribbean, both were included in the same category. The Andean region was taken as a reference, since it has the largest population.
Individual covariates included maternal age, marital status, educational level (according to the last year of study completed by the mother), mother's usual area of residence, area of birth, gestational age at birth, parity, number of prenatal visits, ethnicity, sex of live birth, birth weight and length at birth. Newborn Apgar 31 was employed as a proxy for fetal status and was recoded as normal (≥7), low (4-6), and very low (≤3). The ethnicity of the newborn was determined considering those recognized in Colombia: indigenous, Afro-Colombian, Rom or Gypsy, Raizal and Palanquera. Those who reported as not belonging to any ethnicity usually represent the mestizo or mixed composition of the Colombian population.
The mother's affiliation to the General Health Social Security System was also included. Health Promoting Entity provide the services covered by the public health insurance directly or indirectly. Most Colombians are affiliated to the contributory and subsidized health regime and there are more than 40 entities in both insurance regimes. All salaried employees, pensioners, and self-employed workers with incomes equal to or higher than one minimum wage affiliate to the contributory regime. Any person that is unable to pay and not covered by the contributory regime affiliates to the subsidized regime. There is also a special or exempt regime for teachers, the Armed Forces, the National Police, and those who work in public universities, or in the national Colombian oil company. There is also a uninsured regime for the urban and rural population identified as poor by the Identification System of Potential Beneficiaries, and the special populations registered in the census lists that are not members of the Subsidized Regime 32.
Statistical analyses were performed in Stata 15 (Stata Corp., College Station, TX, USA).
Study groups were described and compared using relative frequencies in tables with corresponding χ2 of Fisher´s exact test where appropriated. A single level multiple logistic regression was initially fitted to select individual-level variables using the backward strategy. Variables with p <0.05 were retained for multilevel analyses. (Table S2, supplemental material). Then, three consecutive logistic multilevel models were performed with two level of analyses: individual (level 1) nested within department (level 2). Although the region could be considered as a third level, it was included as a fixed effect. Different simulations have shown that when the number of groups in the level is small (i.e; 5 regions), the variance of that level is usually underestimated, as well as its standard errors. 33,34.
The first multilevel logistic regression model included a random intercept of departments to capture the variation in the possibility of C-Section across department (Empty model/ Model1). The General Contextual Effect of the departments was calculated using the Variance Partition coefficient based on the latent response formulation of the model 35. This Coefficient quantifies the proportion on the variation of having a C-Section that is explained by the differences across the departments and embraces the influence of this level on the patient outcome without identifying any specific departmental information. The larger this proportion, the more relevant the context is. Considering previous references 20, the magnitude of the VPC was classified as absent if the Variance Partition Coefficient, in percentage, was between 0-1, small between 1-5, moderate between 5-10, large between 10-20 and very large >20. In addition, the median odds ratio was quantified. It is defined as the median value of the odds ratio between the department at highest risk and the department at lowest risk when randomly picking out two women from different departments. In general, it represents the increased risk that a woman (in median) would have if moving to another department with a higher risk. (35.
To account for possible differences in individual composition within departments, a second model was fitted by including individual variables (Model 2). The Variance Partition Coefficient from this model was also obtained to determine the General Contextual Effect adjusted by individual-level characteristics. This model allows to identify the extent to which the differences in the individual variables between departments explained the general contextual effect of the department observed in model 1. The comparison of the general contextual effect between models was performed considering the Variance Partition Coefficient and not through the second level variance, since the re-scaling phenomenon when including individual variables (first level). The coefficients of the individual variables obtained from model 2 quantify the effect on the odds of C- sections, keeping constant the department and the other individual variables included in the model.
Finally, model 2 was extended by adding contextual information (Model 3) to determine the amount of the general contextual effect that is explained by specific characteristics of the departments. The coefficients of the contextual variables are interpreted in a similar way to the individual ones. However, contextual variables are constant by department, therefore, the interpretation of their coefficients can be problematic. 36. Then, 80% Interval Odds Ratio was calculated 36,37, to quantify the effect of the contextual variables with respect to the variance between departments. The 80% Interval Odds Ratio is defined as the range where 80% of the distribution of the Odds Ratios derived from the vis-a-vis random comparison between women from departments exposed and not exposed to the contextual variable. If the range does not contain the unit, the effect of the contextual variable is well defined, if it contains the unit, the unexplained variability is greater than the effect of the contextual variable and therefore there may be cases where the association could be in the opposite direction to that observed 19. The Variance Partition Coefficient and the Median Odds Ratio were also determined for models 2 and 3. In addition, the Percentage of Change in Variance was determined in model 3, which quantifies the reduction in variance at the department level when moving from model 2 to 3, that is, the variation between departments that is attributed to the effect of the contextual variables. Bayesian information criterion was used to determine the model that best fit the data.
Residuals by department of each model were plotted together with their confidence intervals (CI 95%). A residual with a value of zero represents the precision weighted average of C-sections between the departments (shrunken residuals). Residuals above and below zero reflect the differences between each department and the precision weighted mean across them, which are not explained by the variables contained in the models. Therefore, the residuals and the information on the general contextual effect, allow to identify those departments to which public health interventions should be oriented. In supplementary material, there is a table containing possible scenarios that can be derived from the multilevel analysis of individual heterogeneity, their interpretation and the public health strategy that would be recommended in order to achieve the goal of the WHO (Table S3, supplemental material)
Results
There were 647,521 life-births registered in 2016, among them 647,363 had information regarding the mode of delivery and 640,522 were born in healthcare institutions. Among those who met the eligibility criteria, 0.10% had missing data on some exposure variables (n= 658), therefore a complete-case analysis was performed. Figure 1 shows the flowchart of the study population. The proportion of women with singleton fetuses who were attended in health care institutions and had a C-section was 45.5% (95% CI: 45.4%-45.6%) from a total of 628,780 deliveries included in the present analysis. Figure 2 shows that the proportion of cesarean sections ranged from 5% in Vichada to 76% in San Andrés and Providencia. Table 1 shows the characteristics of the overall study population and according to mode of delivery. With the exception of parity, there were statistical significant differences between being birth by C-section and vaginal delivery in all study variables. Table 2 shows that according to model 1, 15% of the total individual variance of in the underlying propensity of C-section was at the department level. The model that best fit the data was model 2. the adjusted individual variance.
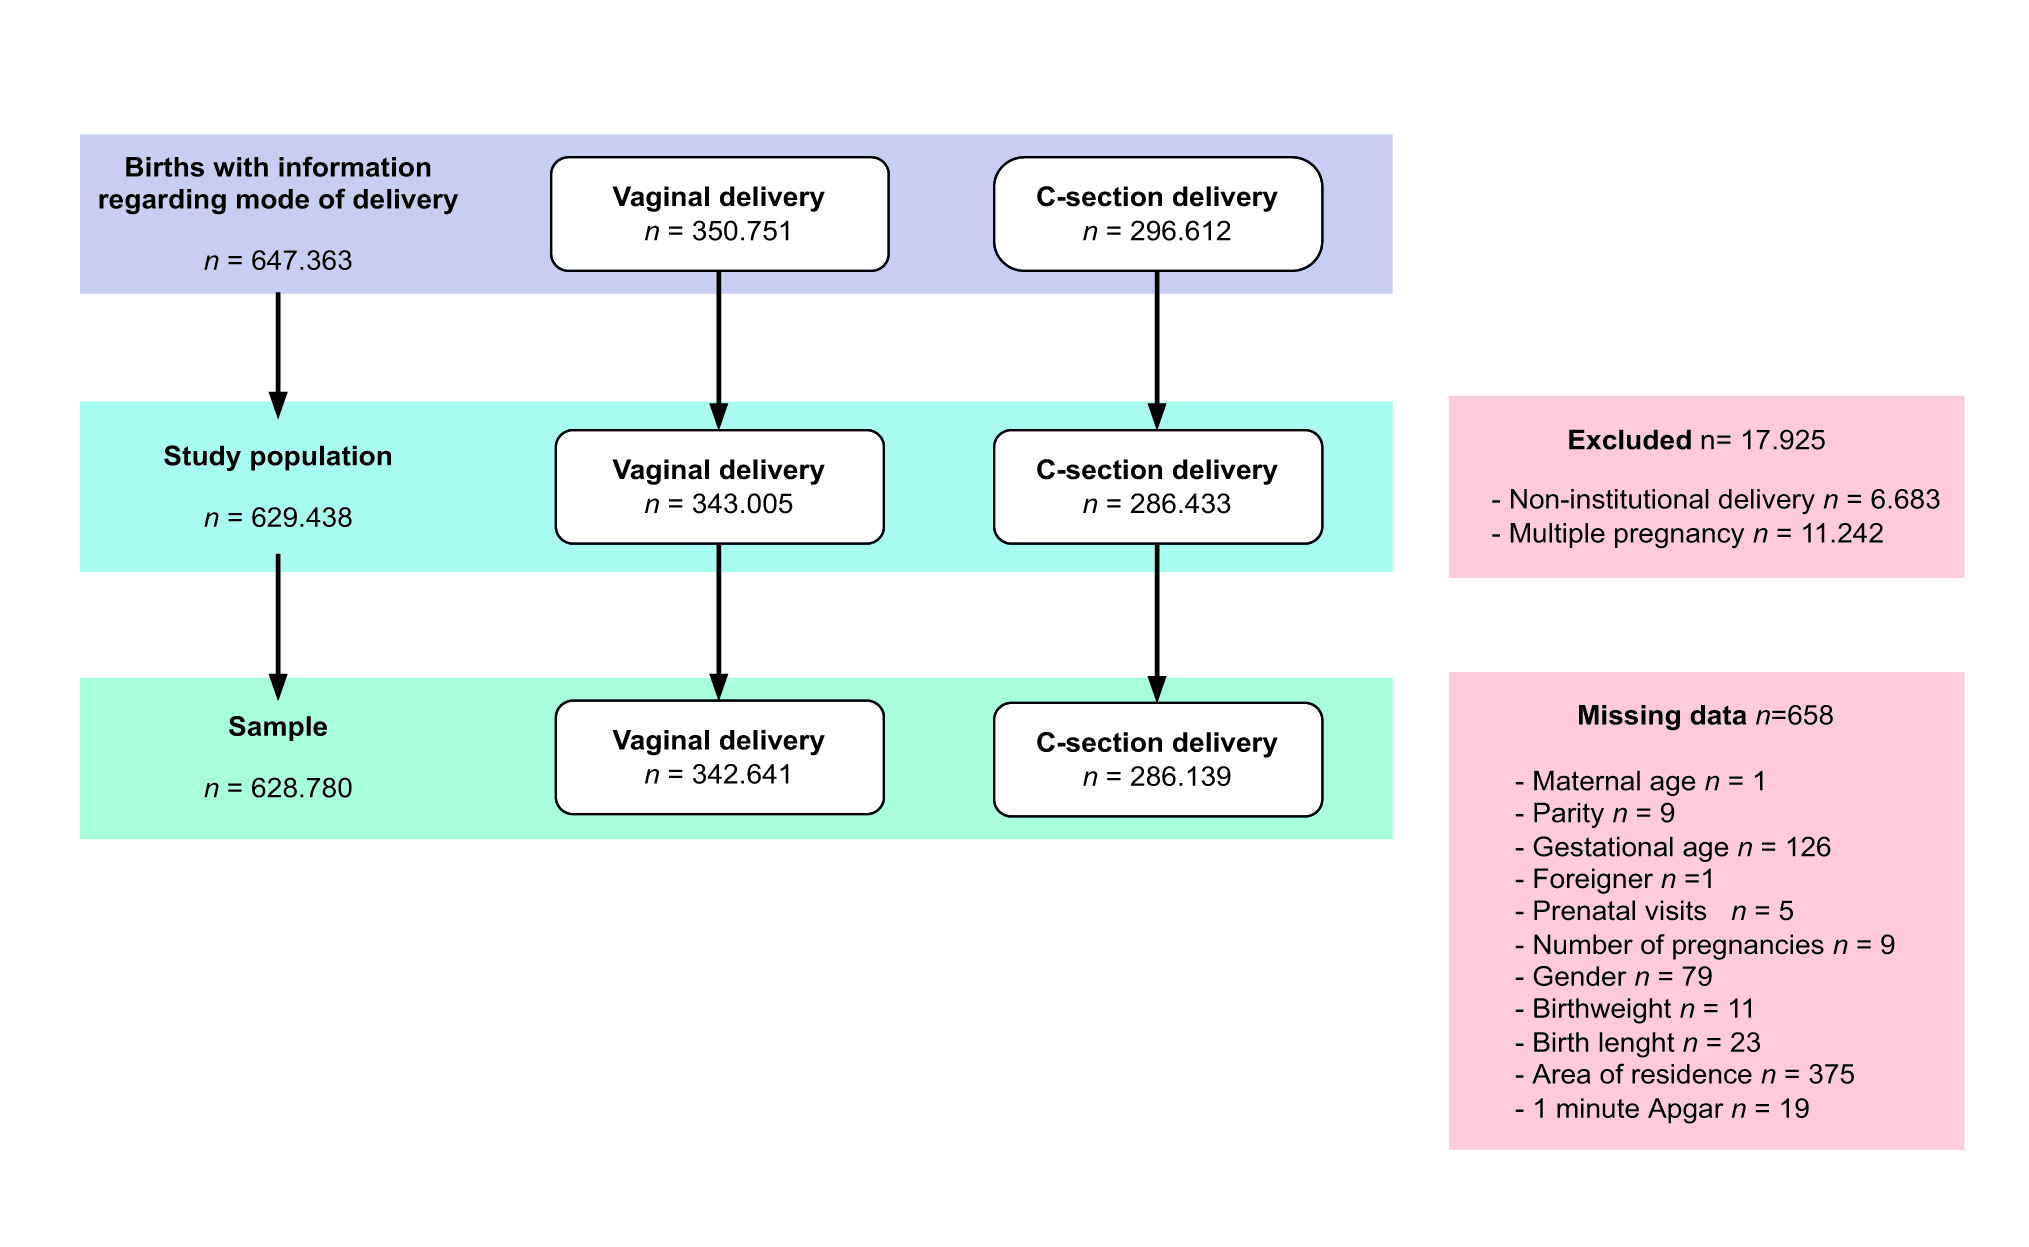
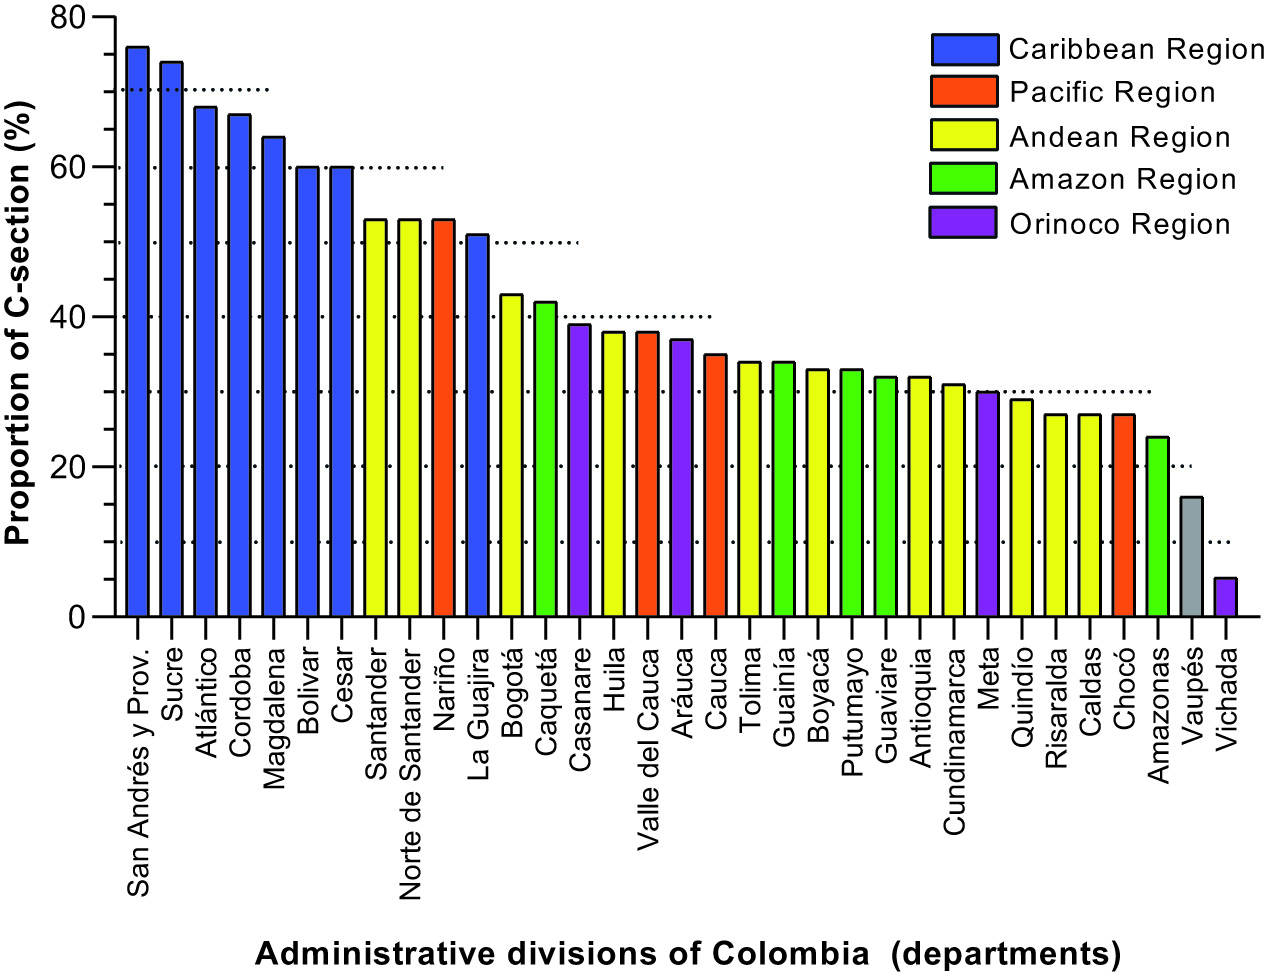
Figure 2 Distribution of the proportion of C-section by departments in 2016 among pregnant women with single fetuses, ordered from least to greatest, in Colombia
Table 1 Characteristics of the study population according to mode of delivery (vaginal or C-section) of pregnancies with a single fetus in Colombia during 2016.
| Characteristics | Total N=628780 n (%) | Mode of delivery | ||
|---|---|---|---|---|
| Vaginal N=342641 n(%) | C-section N=286139 n (%) | p-value | ||
| Individual-level characteristics | ||||
| Maternal age (years) | ||||
| <20 | 132.625 (21.09) | 81.132 (23.68) | 51.493 (18.00) | <0.001 |
| 20-39 | 482.768 (76.78) | 255.669 (74.62) | 227.104 (79.37) | |
| ≥40 | 13.387 (2.13) | 5.841 (1.70) | 7.546 (2.64) | |
| Marital status | ||||
| Married, Common low | 524.402 (83.40) | 280.844 (81.96) | 243.558 (85.12) | <0.001 |
| Single, Widowed, Divorced | 89.982 (14.31) | 55.097 (16.08) | 34.885 (12.19) | |
| No information | 14.396 (2.29) | 6.700 (1.96) | 7.696 (2.69) | |
| Educational level | ||||
| University, Posgraduate | 75.765 (12.52) | 30.177 (9.11) | 45.588 (16.63) | <0.001 |
| Technical, Technological | 72.777 (12.02) | 36.433 (11.00) | 36.344 (13.26) | |
| High, Bachelor, Normal | 370.884 (61.27) | 210.474 (63.56) | 160.410 (58.51) | |
| None, Elementary | 85.901 (14.19) | 54.076 (16.33) | 31.825 (11.61) | |
| Health Social Security Insurance affiliation | ||||
| Contributory | 274.836 (43.71) | 140.723 (41.07) | 134.113 (46.87) | <0.001 |
| Subsidized | 323.384 (51.43) | 185.600 (54.17) | 137.784 (48.15) | |
| Special or exception | 16.357 (2.60) | 7.406 (2.16) | 8.951 (3.13) | |
| Uninsure | 14.203 (2.26) | 8.912 (2.60) | 5.291 (1.85) | |
| Mother´s area of residence | ||||
| Municipal seat | 504.113 (80.17) | 264.434 (77.18) | 239.679 (83.76) | <0.001 |
| Small town | 45.408 (7.22) | 26.355 (7.69) | 19.053 (6.66) | |
| Rural | 79.259 (12.61) | 51.852 (15.13) | 27.407 (9.58) | |
| Area of birth | ||||
| Municipal seat | 626.556 (99.65) | 340.579 (99.40) | 285.984 (99.94) | <0.001 |
| Small town | 1639(0.26) | 1610(0.47) | 29(0.01) | |
| Rural | 585(0.09) | 452(0.13) | 133(0.05) | |
| Gestational age (weeks) | ||||
| < 27 | 2.229 (0.35) | 1.026(0.30) | 1.203(0.42) | <0.001 |
| 28 a 37 | 117.175 (18.64) | 54.170(15.81) | 63.005(22.02) | |
| 38 a 41 | 508.070 (80.80) | 286.660(83.66) | 221.410(77.38) | |
| ≥42 | 1.306 (0.21) | 785(0.23) | 521(0.18) | |
| Parity | ||||
| Primiparous | 307580 (48.92) | 167.882 (49.00) | 139.698 (48.82) | 0.167 |
| Multiparous | 321.200 (51.08) | 174.759 (51.00) | 146.441 (51.18) | |
| Number of Prenatal Care visits | ||||
| <5 | 116.535 (18.53) | 72.567 (21.18) | 43.968 (15.37) | <0.001 |
| 5-9 | 459.718 (73.11) | 243.837 (71.16) | 215.881 (75.45) | |
| >=10 | 52.527 (8.35) | 26.237 (7.66) | 26.290 (9.19) | |
| Etnicity | ||||
| None | 585.186 (93.07) | 313.845 (91.60) | 271.341 (94.83) | <0.001 |
| Indigenous | 13.535 (2.15) | 10.778 (3.15) | 2.757 (0.96) | |
| ROM | 43(0.01) | 26(0.01) | 17(0.01) | |
| Afrocolombian/black /mulato Palenquera /Raizal | 30.016(4.77) | 17.992(5.25) | 12.024(4.20) | |
| Newborn gender | ||||
| Male | 323.608 (51.47) | 174.706 (50.99) | 148.902 (52.04) | <0.001 |
| Female | 305.172 (48.53) | 167.935 (49.01) | 137.237 (47.96) | |
| Birthweight (g) | ||||
| Normal: 2,500-3,999 | 560.623(89.16) | 313.592(91.52) | 247.031(86.33) | <0.001 |
| Low: <2,500 g | 50.577 (8.04) | 21.957 (6.41) | 28.620 (10.00) | |
| Macrosomic: ≥4,000 | 17.580(2.80) | 7.092(2.07) | 10.488(3.67) | |
| Birth lenght (cm) | ||||
| ≥50 | 378.203 (60.22) | 211.024 (61.59) | 167.636 (58.59) | <0.001 |
| <50 | 250.120 (39.78) | 131.617 (38.41) | 118.503 (41.41) | |
| 1 minute -Apgar | ||||
| Normal ≥7 | 608.674(96.80) | 331.406(96.72) | 277.268(96.90) | <0.001 |
| Low 4-6 | 16.934(2.69) | 9.523(2.78) | 7.411(2.59) | |
| Very low ≤3 | 3.172(0.50) | 1.712(0.50) | 1.460(0.51) | |
| Contextual Characteristics | ||||
| Region | ||||
| Andina | 330.935 (52.63) | 202.530 (59.11) | 128.405 (44.88) | <0.001 |
| Amazonas | 13.223 (2.10) | 8.400 (2.45) | 4.823 (1.69) | |
| Caribe e Insular | 171.485 (27.27) | 61.534 (17.96) | 109.955 (38.43) | |
| Orinoquia | 25.556 (4.06) | 17.207 (5.02) | 8.348 (2.92) | |
| Pacífica | 87.581/13.93) | 52.970 (15.46) | 34.611 (12.10) | |
| Gross Domestic Product Growth | ||||
| Decreased | 60.411 (9.61) | 37.700(11.00) | 22.711(7.94) | <0.001 |
| Low | 139.102 (22.12) | 65.505(19.12) | 73.597(25.72) | |
| Middle | 207.374 (32.98) | 129.064(37.67) | 78.310(27.37) | |
| High | 221.893 (35.29) | 110.064(32.21) | 111.521(38.97) | |
| Timeliness of obstetrician appointment | ||||
| Very low | 383.868 (61.05) | 200.047(58.38) | 183.821(64.24) | <0.001 |
| Low | 147.069 (23.39) | 91.029 (26.57) | 56.040 (19.58) | |
| Middle | 61.295 (9.75) | 32.245 (9.41) | 29.050 (10.15) | |
| High | 36.548 (5.81) | 19.320 (5.64) | 17.228 (6.02) | |
Table 2 Random effects and goodness of fit of multilevel logistic regression models: empty model (Model 1), including individual-level variables (Model 2), and including individual and contextual-level variables (Model 3) modelling the odds of C-section of pregnancies nested within Colombian departments in 2016
| Model 1 (CI 95%) | Model 2 (CI 95%) | Model 3 (CI 95%) | |
|---|---|---|---|
| Variance | 0.62(0.38-1.02) | 0.57(0.35-0.94) | 0.16(0.10-0.27) |
| VPC | 15.86 | 14.84 | 7.12 |
| PCV | - | - | 71.15 |
| MOR | 2.12(1.80-2.61) | 2.06(1.76-2.52) | 1.47(1.35-1.6517) |
| BIC | 819488 | 759980.2 | 760073.6 |
VPC: Variance Partition Coefficient, PCV: Proportional Change in Variance, MOR: Median Odds Ratio, BIC: Bayesian Information Criteria
Table 3 shows the measures of association of the individual and contextual variables derived from the multilevel regression models. Based on model 2, C-section was positively associated with older maternal age, higher number of prenatal visits, low birth weight, macrosomia, and short length at birth. A small increase in the odds of having a C-section was observed among those born between 28 and 37 weeks compared to those below 28 weeks, as well as the special regime compared to the contributory regime. On the contrary, being single, widowed or separated, lower educational background, subsidized or uninsured regime, residing or giving birth outside the municipal seat, gestational age at birth greater than 38 weeks, belong to any ethnic group, female sex of the newborn and low APGAR reduced the odds of cesarean section, compared to their reference categories. Regarding the contextual variables, the odds of C-section in the Caribbean and Insular region was almost four times the odds of the Andean region. No significant effects of the timeliness of obstetrician appointments or Gross Domestic Product Growth on the proportion of C-sections were observed.
Table 3 Measures of association from multilevel logistic regression modelling the odds of C-section including individual-level variables (Model 2) and including individual and contextual level variables (Model 3) of mother nested within departments of Colombia in 2016
| Variables | Model 2 OR (CI 95%) | Model 3 OR (CI 95%) |
|---|---|---|
| Individual Variable | ||
| Maternal age (years) | ||
| <20 | ||
| 20-39 | 1.21(1.19 -1.23) | 1.21(1.19-1.23) |
| ≥40 | 1.91(1.84 -1.99) | 1.91(1.84-1.99) |
| Marital status | ||
| Married, Common low | ||
| Single, Widowed, Divorced | 0.95 (0.94 - 0.97) | 0.95 (0.94 - 0.97) |
| No information | 1.03 (0.96 - 1.10) | 1.03 (0.96 - 1.09) |
| Educational level | ||
| University, Posgraduate | ||
| Technical, Technological | 0.65 (0.64 - 0.67) | 0.65 (0.64 - 0.67) |
| High, Bachelor, Normal | 0.57 (0.56 - 0.59) | 0.57 (0.56 - 0.59) |
| None, Elementary | 0.48 (0.47 - 0.49) | 0.48 ( 0.47 - 0.49) |
| Health Social Security Insurance affiliation | ||
| Contributory | ||
| Subsidized | 0.79 (0.78 - 0.80) | 0.79 (0.78 - 0.80) |
| Special or Exception | 1.09 (1.06 - 1.14) | 1.09 (1.06 - 1.14) |
| Uninsure | 0.75 (0.72 - 0.78) | 0.75 (0.72 - 078) |
| Mother´s area of residence | ||
| Municipal seat | ||
| Small town | 0.81 (0.79 - 0.83) | 0.81 (0.79 - 0.83) |
| Rural | 0.85 (0.83 - 0.87) | 0.85 (0.83 - 0.87) |
| Area of birth | ||
| Municipal seat | ||
| Small town | 0.04 (0.03-0.06) | 0.04 (0.03 - 0.06) |
| Rural | 0.52 (0.42-0.64) | 0.51 (0.42 - 0.64) |
| Gestational age, weeks | ||
| <28 | ||
| 28-37 | 1.11(1.01-1.22) | 1.11(1.01-1.22) |
| 38-41 | 0.83(0.76-0.91) | 0.83(0.76-0.91) |
| ≥42 | 0.84(0.72-0.98) | 0.84(0.72-.098) |
| Parity | ||
| Primiparous | ||
| Multiparous | 1.02 (1.00 - 1.03) | 1.02 (1.00 - 1.03) |
| Number of Prenatal Care visits | ||
| <5 | ||
| 5-9 | 1.32 (1.30 - 1.34) | 1.32 (1.30 - 1.34) |
| ≥10 | 1.52 (1.49 - 1.56) | 1.52 (1.49 - 1.56) |
| Ethnicity | ||
| None | ||
| Indigenous | 0.33 (0.31 - 0.35) | 0.33(0.31 - 0.35) |
| ROM | 0.72 (0.37 - 1.40) | 0.72 (0.37-1.40) |
| Afrocolombian/black /mulato Palenquera /Raizal | 0.89 (0.87 - 0.92) | 0.89(0.87 - 0.92) |
| Newborn gender | ||
| Male | ||
| Female | 0.95(0.94 - 0.96) | 0.95 (0.94-0.96) |
| Birthweight (g) | ||
| Normal 2,500-3,999 | ||
| Low <2,500 | 1.49 (1.45 - 1.52) | 1.49 (1.45 - 1.52) |
| Macrosomic ≥4,000 | 2.06 (1.99 - 2.13) | 2.06 (1.99 - 2.13) |
| Birth lenght (cm) | ||
| ≥50 | ||
| <50 | 1.12 (1.11 - 1.14) | 1.12(1.11 - 1.14) |
| 1 minute -Apgar | ||
| Normal ≥7 | ||
| Low 4-6 | 0.93 (0.90 - 0.96) | 0.93 (0.90 - 0.96) |
| Very low ≤3 | 1.05 (0.97-1.14) | 1.05 (0.97 - 1.14) |
| Specific Contextual Effect | ||
| Region | ||
| Andina | Ref | |
| Amazonía | 1.39 (0.86-2.24) | |
| Caribe e Insular | 3.88 (2.65 -5.67) | |
| Orinoquia | 0.61 (0.34 -1.10) | |
| Pacífico | 1.36 (0.83-2.22) | |
| Gross Domestic Product Growth | ||
| Decreased | Ref | |
| Low | 0.97 (0.62 -1.53) | |
| Middle | 0.71 (0.43 - 1.18) | |
| High | 0.82 (0.48 - 1.41) | |
| Timeliness of obstetrician appointment | ||
| Very low | Ref | |
| Low | 0.83 (0.54-1.25) | |
| Middle | 1.06 (0.67-1.68) | |
| High | 0.65 (0.39-1.09) | |
Individual-level variables did not substantially modify the Variance Partition Coefficient. However, contextual variables were able to explain up to 71% of the variance. If a pregnant woman moves from a department with low risk to one with high risk od C section, the increase in the odds of C-section was 2.06, and 1.47 when this movement occurs between departments of the same region, with the same Gross Domestic Product Growth and the same timelines opportunity for obstetric appointments. The 80% Interval Odds Ratio for specific contextual variable contained the unit (not shown in these results), except for the Caribbean and Insular region, which ranged between 1.87-8.26. Figure 3 shows a greater flattening of the residuals after adjustment for contextual variables (Model 3). Table 4 shows that, after covariates adjustment, the departments with the lowest proportion of C-sections were Vichada, Risaralda and Quindío, and those with the highest proportion were Córdoba, San Andrés, Providencia and Santa Catalina, and Sucre.
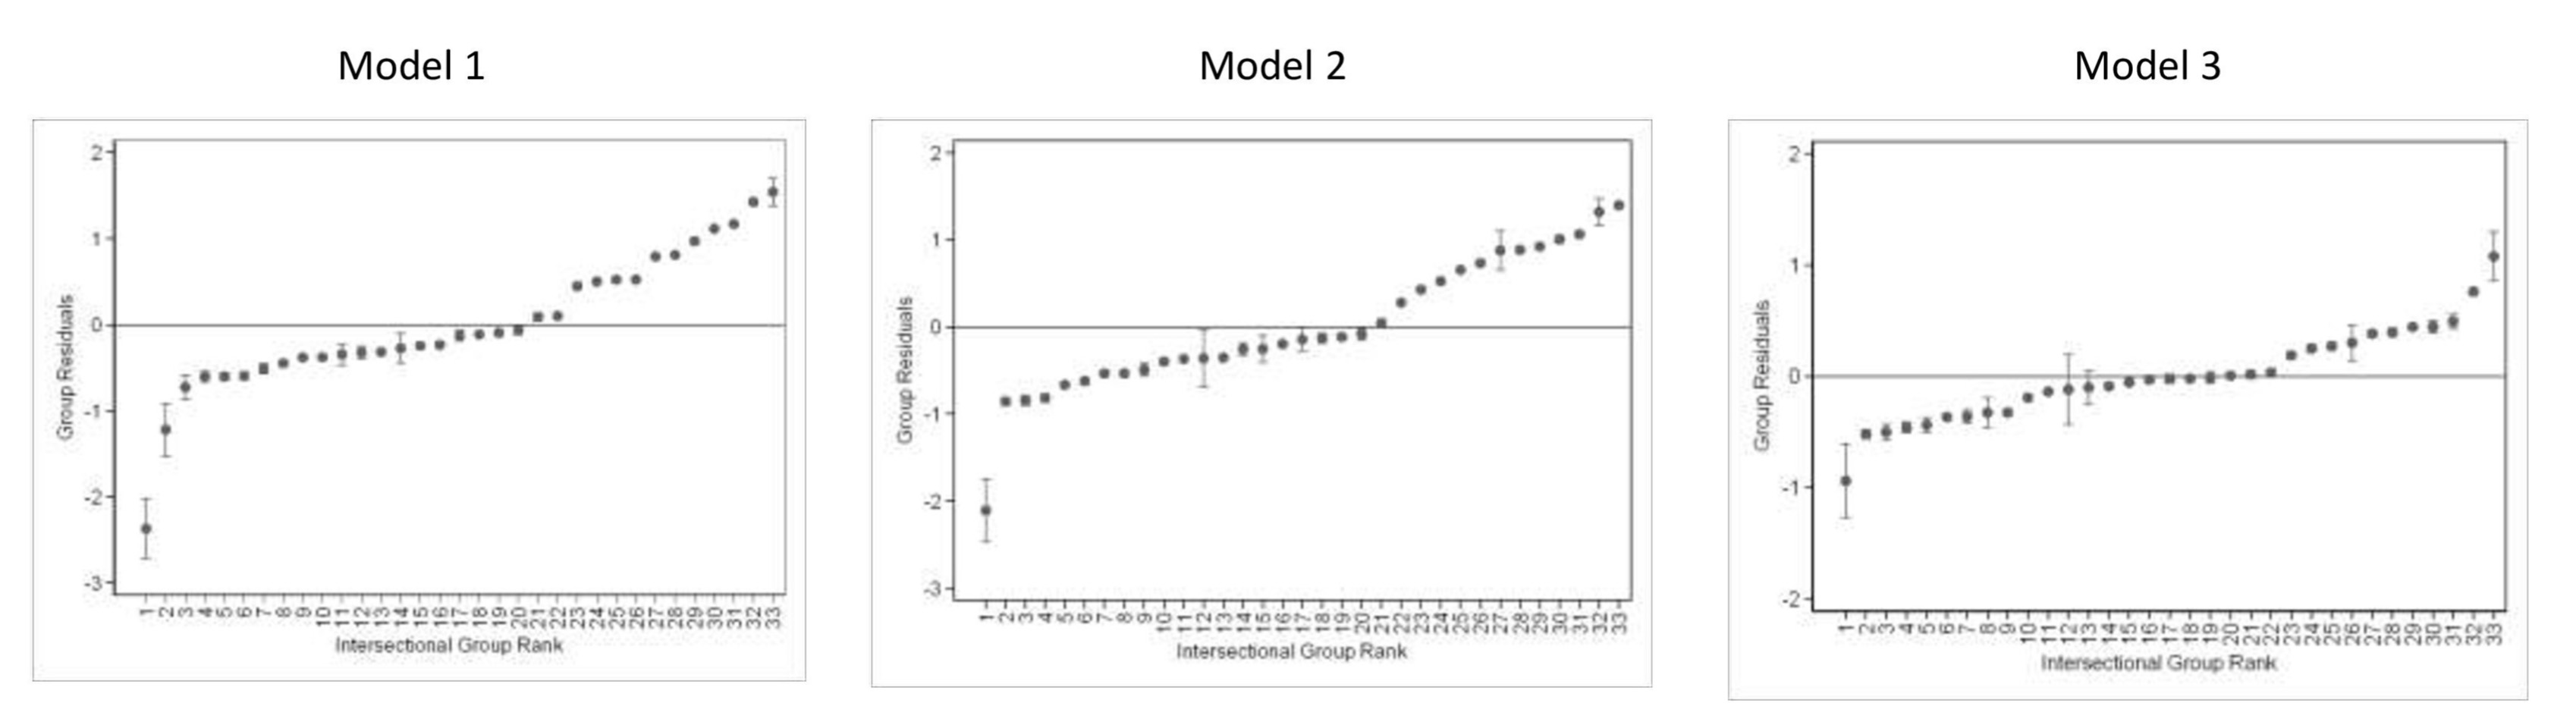
Figure 3 Rank of the C-section obtained from the multilevel models ordered by departments from lowest to highest. Empty Model (Model 1), Model with individual-level variables (Model 2), Full Model with contextual and individual variables (Model 3). The values correspond to the shrunken residuals with their 95% confidence intervals
Table 4 Departments of Colombia ordered from lowest to highest according to the value of the residuals obtained from multilevel logistic regression models: Empty model (Model 1), with individual variables (Model 2), and with individual and contextual variables (Model 3)
| Orden | Model 1 | Model 2 | Model 3 |
|---|---|---|---|
| 1 | Vichada | Vichada | Vichada |
| 2 | Vaupés | Risaralda | Risaralda |
| 3 | Amazonas | Quindío | Putumayo |
| 4 | Choco | Caldas | Caldas |
| 5 | Caldas | Antioquia | Choco |
| 6 | Risaralda | Meta | Bolívar |
| 7 | Quindío | Cundinamarca | Quindío |
| 8 | Meta | Boyacá | Guaviare |
| 9 | Cundinamarca | Choco | Magdalena |
| 10 | Antioquia | Tolima | Valle del Cauca |
| 11 | Guaviare | Valle del Cauca | Atlántico |
| 12 | Putumayo | Vaupés | Vaupés |
| 13 | Boyacá | Bogotá | Amazonas |
| 14 | Guainía | Putumayo | Huila |
| 15 | Tolima | Amazonas | Cundinamarca |
| 16 | Cauca | Huila | Cesar |
| 17 | Arauca | Guaviare | La Guajira |
| 18 | Valle del Cauca | Casanare | Bogotá |
| 19 | Huila | Cauca | Caquetá |
| 20 | Casanare | Arauca | Antioquia |
| 21 | Caquetá | Caquetá | Meta |
| 22 | Bogotá | Santander | Boyacá |
| 23 | La Guajira | Norte de Santander | Córdoba |
| 24 | Nariño | Nariño | Cauca |
| 25 | Norte de Santander | Bolívar | Tolima |
| 26 | Santander | Cesar | Nariño |
| 27 | Cesar | Guainía | San Andrés, Providencia y Santa Catalina |
| 28 | Bolívar | Atlántico | Sucre |
| 29 | Magdalena | Magdalena | Santander |
| 30 | Córdoba | La Guajira | Casanare |
| 31 | Atlántico | Córdoba | Arauca |
| 32 | Sucre | San Andrés, Providencia y Santa Catalina | Norte de Santander |
| 33 | San Andrés, Providencia y Santa Catalina | Sucre | Guainía |
Discussion
The overall C-section proportion was 45%, a value higher than the target suggested by the WHO 5. Using a multilevel analysis of individual heterogeneity, a large department -general contextual effect was found, since 15% of the variation in the proportion of cesarean sections was found at this level. The difference in patient-mix across departments did not explain the overall contextual effect. In contrast, the region to which the department belongs explained most of this effect. In particular, the odds of C-section in Caribbean and Insular region was 4 times higher than the Andean region, with 80% interval odds ratio higher than 1. This contextual-specific effect was superior to most of the effects of the individual variables, despite occurring in a context of a high Variance Partition Coefficient. This suggests that the department and the region where delivery is attended in Colombia play an important role in the possibility of C-section.
By including the region as a second level fixed effect, the Variance Partition Coefficient was substantially reduced. Regions in Colombia have marked cultural differences, which together with differences in obstetric practices 4,12 and delivery room conditions, could explain this birthplace effect. For example, it has been shown that having full-time obstetricians and nurses reduces the risk of C-section (38), since this allows sharing decisions with colleagues, participating in medical boards, and the development of institutional strategies and protocols for medical management. Practices such as the preference for C-section when delivery occurs at night 39, or C-section without medical indication, can be more easily shared among professionals in the same region or department. In fact, the same professional may move to different municipalities within the department and region along with his or her practices. For instance, this may occur between the capital cities of Bolivar (Cartagena), Atlántico (Barranquilla) and Magdalena (Santa Marta).
The Caribbean departments showed the highest risk of C-section. However, after adjusting for individual and contextual variables, some departments also showed a higher proportion of C-section compared to other departments from the same region, e.g., Guainía, Arauca and Santander. This heterogeneity is observed within the Amazon region, where residuals from Putumayo and Guainía were similar in the crude analysis, but different after covariate adjustment. The influence of ethnic proportion at the department-level was not evaluated in this study, however, there are more ethnic communities in Guainía than in Putumayo 40. At the individual-level, belonging to an ethnic group reduces the possibility of C-sections. Therefore, it is possible that Guainía shows a higher risk than expected after adjusting for this individual-level variable. Ethnic communities have confidence in their ancestral knowledge, including the skills of traditional birth attendants 41,42. It is also possible that indigenous or Afro-Colombian pregnant women who attend or are referred to health care institutions prefer vaginal than cesarean delivery.
This birthplace effect was found at country-level among those from sub-Saharan Africa 43. It was also observed at hospital-level (Variance Partition Coefficient of 20%) in Colombia in 2007. Similar to our results, the region explained one third of the variation among hospitals in the latter study 12) although it only included institutions belonging to one contributory regime health insurer. Individual-level variables were modestly associated with the odds of C-section (OR <2). Our results coincide with previous reports showing that women living in families with high socioeconomic status, male fetuses 43-45, fetal macrosomia 45,46, or those from urban areas and higher educational level, 8,47 have a higher chance of having a C-section. Likewise, the greater number of prenatal visits was associated with a greater possibility of C-section, which could be explained by a more frequent followed-up of high-risk women 48,49.
To our knowledge, this is the first study that demonstrates a general (department) and specific (region) contextual effect on the possibility of C-sections in Colombia. Level 2 variance in multilevel analysis is usually used to account for correlations of the outcomes of individuals in the same level. However, in our study this variance is itself a result of interest, as a measure of the general contextual effect. A large general contextual effect, such as that observed in this study, may lead to an imprecise estimation of the specific contextual effects. That is to say, that there is no specific effect of the contextual variable when there in fact is 50. On the other hand, there were only five regions which limited this variable to be considered as a level of analysis. This implies that the estimates of uncertainty about this variable could actually be less precise than those obtained. This could be as a result of the oversizing of the sample size if correlation between individuals in the same region are not considered. In spite of this, the Caribbean region was positively associated with the possibility of cesarean sections in Colombia. Future studies are required to understand this behavior.
One of the main limitations of the study was the impossibility of assessing other individual-level risk factors. For example, access to services, or the presence of hypertensive disorders, diabetes, or previous C- section. Regarding previous C-Section, when restricting the analyses to primiparous women, the Variance Partition Coefficient of the null model was equally high: 14.14 (9.07-21.38). In addition, the existence of residual confounding could not be ruled out given the qualitative nature of the variables and the categories predefined by DANE. It was also not possible to identify whether the C-section was a planned (elective) or an emergency procedure, or whether it was performed without medical indication. In addition, a greater presence of risk factors was observed among those observations with missing data, which may have underestimated the effect of some individual-level variables. Missingness was not associated with the outcome variable, which together with the small amount of missing data, reduce the potential for bias to negligible levels. Indeed, including missing data did not impact the Variance Partition Coefficient of the empty model.
Likewise, the use of logistic regression when the prevalence of the outcome is high could be questioned. As an alternative, other models such as modified Poisson regression, binomial regression or complementary Log-Log regression have been proposed. When analyzing this data using modified Poisson regression, the coefficients were very similar in terms of magnitude and statistical significance. As expected, there was a discrete greater magnitude of the coefficients obtained from the logistic than from Poisson regression (Table S2, supplementary material). Given that the main objective of this research was the estimation of the contextual effect, we prefer to use logistic regression for the sake of interpretability, greater development within the context of multilevel analysis, and better convergence of the models.
Conclusion
Department and region have an effect on the likelihood of cesarean delivery in Colombia, independently of individual characteristics. Our results suggest that interventions guided by a "proportional universalism" approach 25,26 are required to reach the goal proposed by the WHO; that is, actions in all departments, with an intensity and orientation proportional to the disadvantage 51. For example, targeted interventions in the Caribbean region could be more effective in reducing the proportion of cesarean deliveries in Colombia. Given that the high proportion of C-section has been maintained over the years 2,10, institutional policies for its adequate indication and studies to determine the impact of this procedure on maternal and perinatal outcomes are also required. Finally, multilevel analysis of individual heterogeneity is an analysis strategy for precision public health 52 that can be applied to other outcomes of interest to tailor interventions to the needs of each department

