text in
  English (pdf)
 Article in xml format
 Article references
 Send this article by e-mail
 Cited by SciELO
  Cited by Google
  Similars in
SciELO
Similars in
SciELO  Similars in Google
 Permalink
Remark
| 1) Why was this study conducted? |
| The CURB-65, CRB-65 and qSOFA were designed to identify patients at increased risk of complications and mortality. These scores share clinical variables in their compositions and community-acquired pneumonia is the main cause of sepsis; therefore, exploring potential differences in their performance as prognosis models would have implications for clinical practice. |
| 2) What were the most relevant results of the study? |
| We did not find either the qSOFA, CURB-65 or CRB-65 to be adequate tools for discriminating hospital mortality or ICU admission in three cohorts of patients with community-acquired pneumonia, who were admitted to emergency departments in 5 reference hospitals in Medellín, Colombia. |
| 3) What do these results contribute? |
| The qSOFA, CURB-65 and CRB-65 were all found to be ineffective predictive tools for mortality and admission to the ICU in our cohorts, therefore it is necessary to develop and validate predictive models of prognosis of community-acquired pneumonia that are useful for the Colombian population. |
Introduction
Pneumonia is a significant cause of sepsis worldwide, representing approximately half of all cases, and is the second most frequent cause of sepsis in Colombia 1,2. Globally, pneumonia confers a high risk of mortality 3,4. Between 2005 and 2012 in Colombia, acute respiratory infection was the number one cause of death from communicable diseases, with 48.6% of the cases, representing 56.2% of deaths from communicable diseases in women and 43.1% in men 5.
Providing health care to patients with severe infections carries high cost to a state and its health system. These infections have a challenging clinical approach because they do not have simple and specific prognostic markers that allow early identification of individuals at risk who warrant differential care. Therefore, it is important to have useful clinical tools to estimate the risk of death or complications in emergency department patients with suspected infections. Several studies have been conducted to define a mortality predictive score specifically for pneumonia, and the CURB-65 and CRB-65 scores have been widely used due to their easy application, compared with other ones such as the PSI (Pneumonia Severity Index) 6. Recently, the third consensus in sepsis (SEPSIS 3) encouraged the implementation of qSOFA (quick sepsis-related organ failure assessment) score in adult patients suspected of having an acute bacterial infection for early identification of those on worse prognosis 7. The Colombian Ministry of Health 8, as well as the Argentine Society of Infectious Diseases 9, and the Mexican Institute of Social Security 10 in their guidelines for the management of patients with community-acquired pneumonia, recommend implementing CURB-65, despite the lack of local studies to confirm and validate this recommendation 7.
The CURB-65, CRB-65 and qSOFA were designed to identify patients at increased risk of complications and mortality. These scores share clinical variables in their compositions and community-acquired pneumonia is the main cause of sepsis; therefore, exploring potential differences in their performance as prognosis models would have implications for clinical practice. Likewise, it is necessary to validate any multivariable model that has been developed for prognostic or diagnostic purposes for a clinical issue in independent populations 11. Therefore, this study aimed to validate and compare the three scores to determine the best tool to identify emergency department patients with pneumonia who are at increased risk of mortality or intensive care unit (ICU) admission.
Materials and Methods
Study design and setting
This analysis was performed using three prospective cohort studies developed between 2013 and 2016 in five emergency departments of the city of Medellín: Hospital Universitario San Vicente Fundación (560 adult inpatient beds and 45 ICU beds in 4 units), the University Health Services Provider Institution IPS Universitaria Clinica León XIII (450 adult inpatient beds and 24 ICU beds in 2 units), Hospital Pablo Tobón Uribe (360 adult inpatient beds and 40 UCI beds in 3 units), Hospital General de Medellín (442 beds) and Clínica Las Américas (304 beds) 12-14. The first cohort was recruited from the emergency department of three tertiary care hospitals: Hospital Pablo Tobón Uribe, Hospital General de Medellín and Clínica Las Américas (2013-2016). The second was from the emergency departments of three tertiary care hospitals, Hospital Universitario San Vicente Fundación, Institución Universitaria Clínica León XIII and Hospital Pablo Tobón Uribe (2014-2016), and the third was from the emergency service of the Hospital Universitario San Vicente Fundación (2014-2016).
Source of data
For each of the original cohorts, trained research assistants collected data based on electronic medical records in a systematic way, reviewing all admissions to hospital institutions and screening all patients admitted for emergencies with a diagnosis of infection, sepsis, severe sepsis or shock. The definition of the infection source and the presence of organ dysfunction or septic shock were verified with the data extracted from the medical history records in the first 6 hours. To assess the data accuracy, the information was evaluated periodically by the co-investigators. This information was recorded using forms designed specifically for each of the investigations and then stored in electronic databases. Given that the cohorts were prospective, the evaluation of predictors was independent from knowledge of the outcomes of interest.
Additionally, it was necessary for this study to recover the BUN (blood urea nitrogen) value upon hospital admission for patients at Hospital Universitario San Vicente Fundación and Hospital Pablo Tobón Uribe. The data collection process took information confidentiality into account and was approved by the ethics committees of each of the participating institutions.
Participants
For the current study, the inclusion criteria were patients who had entered the previous studies with a diagnosis of pneumonia. For cohort 1, the Centers for Disease Control and Prevention (CDC) criteria for infection were used for inclusion, cohort 2 consisted of suspected infection with at least one organ dysfunction criterion, and cohort 3 consisted of clinical suspicion of infection. As common criteria exclusion, we found for the 3 cohorts: patients that were early discharge or referenced to another institution, and patients with do-not-resuscitate orders or terminal diseases (Annex 1). No additional exclusion criteria that had not been considered in the original studies were used in the present study (12-14).
Variables
The primary outcome was hospital mortality; ICU admission was included as a secondary outcome.
The predictor variables
qSOFA: This severity prediction score includes scoring variables on the Glasgow Coma Scale ≤14, systolic blood pressure ≤100 mmHg, and respiratory rate ≥22 breaths per minute, with one point for each variable, for a total score between 0 and 3. It is proposed that the presence of two of these three criteria could predict mortality in patients with suspected infection outside the ICU (7).
CURB-65: This score includes the variables confusion (Glasgow score <15), urea >7 mmol/L, respiratory rate ≥30, systolic pressure <90 or diastolic <60 mmHg, age ≥65 years, with one point for each variable, for a total score between 0 and 5. It is proposed that the presence of three or more points could predict mortality in patients with community-acquired pneumonia 15.
CRB-65: This score includes the variables described above in the CURB-65 excepting the urea information. The score includes one point for each variable, for a total score between 0 and 4. It is proposed that the presence of three or more points could predict mortality in community-acquired pneumonia patients 15.
Sample size
Given that this was a secondary analysis of data, there was no calculation of sample size because the analysis was performed with patients of the respective cohorts that met the inclusion criteria. However, the power for the expected difference in the areas under the curve was calculated from a fixed number of patients and considered a type I error fixed at 0.05. The calculation was based on the formula described by Hanley and McNeil 16,17.
With a fixed sample size of 158, 745 and 207 patients for cohorts 1, 2 and 3, respectively, an alpha of 0.05 and taking the observed values of the AUC-ROC (area under the ROC curve) as θ1: 0.7 and θ2: 0.77 (based on the study by Kolditz et al. 18 because we lacked this information locally), we found an estimation of power of 0.52, 0.98 and 0.62, respectively.
Statistical methods
The quantitative variables with a normal distribution are presented as means and standard deviations, while those without a normal distribution are expressed as medians and interquartile ranges (IQRs).
A validation and comparison of the three predictive models (CURB-65, CRB-65 and qSOFA) was performed in terms of prognosis. To determine the accuracy of the prediction of the models, it was necessary to examine both the calibration and the discrimination. Calibration compares and establishes the agreement between observed and expected events, while discrimination establishes the ability with which the score distinguishes between individuals who experience or do not experience the event of interest 19. The performance of the scores in terms of discrimination was determined based on the area under the receiver operating characteristics curve (AUC-ROC) based on the models defined as the sum of the corresponding predictors. The differences between the AUC-ROC were tested using the DeLong-DeLong statistic 20. The calibration was determined by the degree of correspondence given by the Hosmer-Lemeshow goodness-of-fit test (p> 0.05). Additionally, calibration curves were performed based on the results of the models in each of the cohorts.
The operative characteristics for prediction of mortality and ICU need for each of the scores were then estimated, taking two or more points for the qSOFA and 3 or more for both the CURB-65 and CRB-65, based on the original proposal of the models indicating these cutoff points as high risk of mortality. Likewise, the performance of each of the predictive models was analyzed according to all possible cutoff points and compared with the originally proposed cohort points. To calculate the sensitivity, specificity, predictive values and the likelihood ratios of the mentioned scores with their respective cutoff points, Bayes theorem was used, considering mortality and ICU need as a reference test or gold standard.
In the main analysis, missing data were considered as abnormal values (worst-case scenario). Additionally, a sensitivity analysis was performed with two additional models: the best scenario, considering the missing data as normal values, and with a multivariate normal regression (MVN), multiple imputation technique, taking the BUN, age, gender, Charlson index, SOFA and Acute Physiology, Age, Chronic Health Evaluation II (APACHEII) as independent values.
Statistical analyses were performed with the Stata 14® software. The results are presented with their respective 95% confidence intervals (CI), and a significance level of p <0.05 was applied. Publication standards given by the transparent reporting of a multivariable prediction model for individual prognosis or diagnosis (TRIPOD) guidelines were followed 11.
Results
A total of 158, 745 and 207 patients were analyzed for cohorts 1, 2 and 3, respectively. In the same order, the median age was 70 (IQR = 56-81), 66 (IQR = 54-77) and 60 (IQR = 44-75) years; 34.2%, 48.9% and 44.4% were female; 52.5%, 43.5% and 25.6% required admission to the ICU; and 32.3%, 17.2% and 18.4% died during hospitalization (Table 1). Blood cultures were requested in 95.6%, 84.8% and 84.5% and germs were isolated for 23.2%, 10.8% and 9.1% of the patients in cohorts 1, 2, and 3, respectively. The most frequent microorganisms found in each of the cohorts were Streptococcus pneumoniae, Klebsiella pneumoniae, Haemophilus influenzae and Escherichia coli (Table 2).
Table 1 Baseline Characteristics of the study population, according to the original cohorts.
| Cohort 1 (n=158) | Cohort 2 (n=745) | Cohort 3 (n=207) | |
|---|---|---|---|
| Characteristics | |||
| Age, years | 70 (56-81) | 66 (54-77) | 60 (44-75) |
| Female sex | 54 (34.2%) | 364 (48.9%) | 92 (44.4%) |
| CDC criteria | 158 (100%) | 628 (84.75%) | 187 (90.34%) |
| Severity | |||
| Charlson index | 1 (0-3) | 1 (0-2) | 1 (0-2) |
| SOFA | 4 (3-6) | 4 (3-6) | 3 (2-5) |
| APACHE II | 17 (12-21) | 15 (11-19) | 13 (9-17) |
| Variables | |||
| RR | 24 (20- 28) | 22 (19-27) | 23 (19- 26) |
| SAP | 110 (90-130) | 113 (92-132) | 120 (100-140) |
| DAP | 60 (49-72) | 68 (55-80) | 76 (60-84) |
| MAP | 76 (64-90) | 83 (68-97) | 91 (73-101) |
| Glasgow coma scale | 15 (14-15) | 15 (15-15) | 15 (15-15) |
| BUN | n= 143 27.1 (16.3- 45.2) | n= 704 21.5 (14-33.4) | n= 206 18 (13-29) |
| ≥65 years | 93 (58.9%) | 393 (52.8%) | 89 (43%) |
| Scores | |||
| qSOFA | 1 (1-2) | 1 (1-2) | 1 (0-1) |
| CURB 65 | 2 (2-3) | 2 (1-3) | 1 (1-2) |
| CRB 65 | 2 (1-2) | 1 (1-2) | 1 (0-2) |
| Outcomes | |||
| ICU | 83 (52.5%) | 324 (43.5%) | 53 (25.6%) |
| Death | 51 (32.3%) | 128 (17.2%) | 38 (18.4%) |
Abbreviations: SOFA, Sequential Organ Failure Assessment; APACHE II, Acute Physiology and Chronic Health Evaluation II; RR, respiratory rate; SAP, systolic arterial pressure; DAP, diastolic arterial pressure; MAP, mean arterial pressure; BUN, blood urea nitrogen. The quantitative variables were expressed as the medians and their respective interquartile range; categorical variables are shown in absolute and relative frequencies.
Table 2 Blood cultures and microbiological results in the study population, according to the original cohorts
| Cohort 1 (n=158) | Cohort 2 (n=745) | Cohort 3 (n=207) | |
|---|---|---|---|
| Characteristics | |||
| Blood culture requested | 151 (95.6%) | 632 (84.8%) | 175 (84.5%) |
| Positive blood culture | 35 (23.2%) | 68 (10.8%) | 16 (9.1%) |
| Main microorganisms | |||
| Streptococcus pneumoniae | 13 (8.6%) | 23 (3.6%) | 6 (3.4%) |
| Klebsiella pneumoniae | 6 (4%) | 6 (1%) | 1 (1%) |
| Haemophilus influenza | 2 (1.3%) | 6 (1%) | 2 (1.1%) |
| Staphylococcus aureus | 4 (2.7%) | 8 (1%) | 2 (1%) |
| Escherichia coli | 5 (3.3%) | 9 (1.4%) | 1 (1%) |
| Pseudomonas aeruginosa | 2 (1.3%) | 3 (1%) | 0 |
For the outcome of admission to the ICU, discrimination was low for the three scores in the three cohorts. From the DeLong-DeLong statistic, a statistically significant difference was found between the AUC-ROC in cohorts 1 and 2 (P <0.05) (Figure 1), with an AUC-ROC of 0.59 for the qSOFA, 0.43 for the CURB-65 and 0.44 for the CRB-65 in cohort 1. For the mortality outcome, discrimination was not adequate in any of the three scores in any of the three cohorts. From the DeLong-DeLong statistic, a statistically significant difference was found in the AUC-ROC of cohorts 1 and 2 (Figure 2), with an AUC-ROC of 0.66 (95% CI = 0.62- 0.71) for the CURB-65, 0.60 (95% CI = 0.56-0.65) for the qSOFA and 0.63 (95% CI = 0.59-0.68) for the CRB -65 in cohort 2.
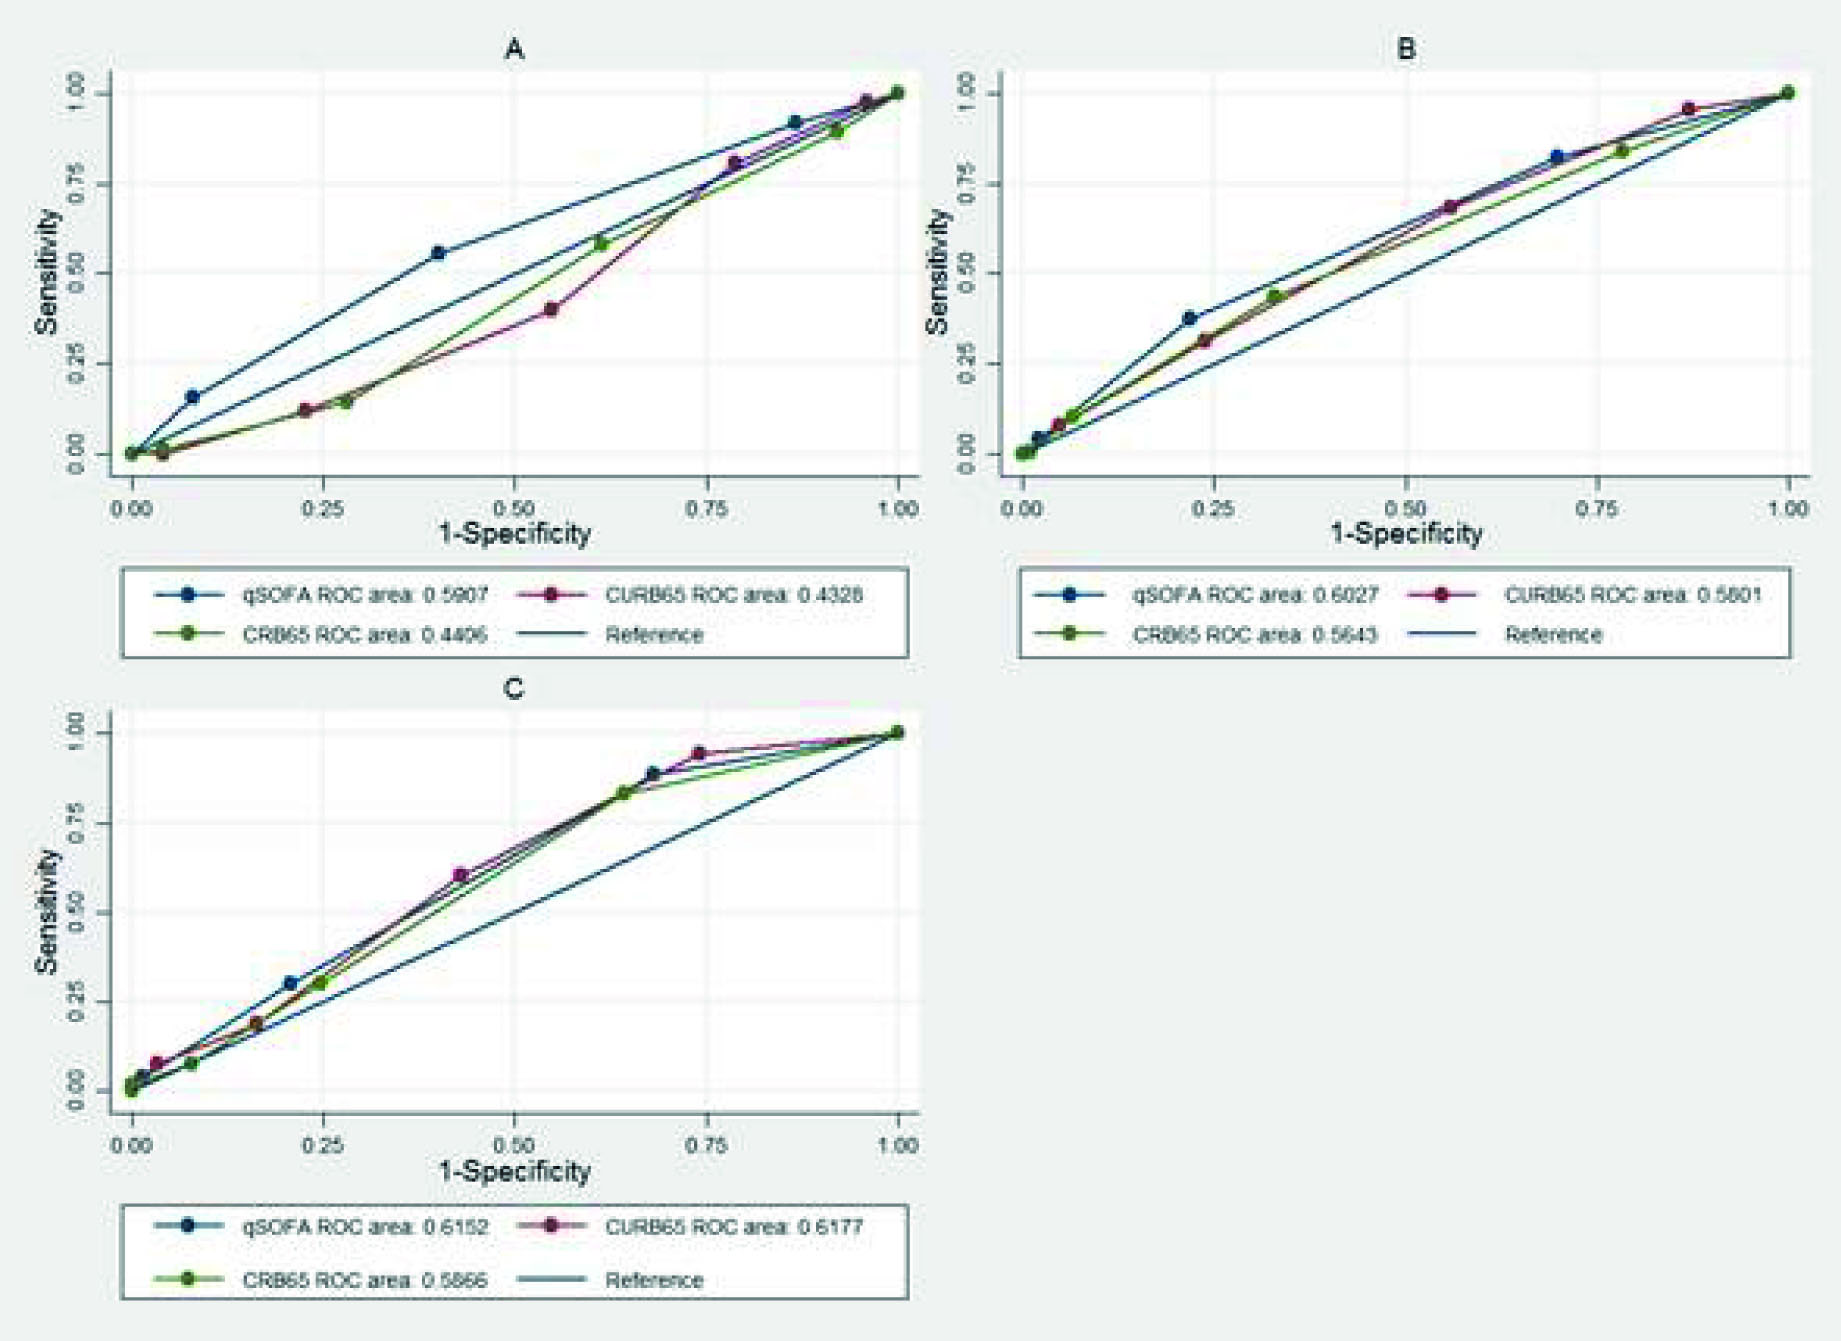
Figure 1 Receiver operating characteristic curve in the different cohorts for qSOFA, CURB-65 and CRB-65 in the discrimination of ICU admission. A. Cohort: 1- DeLong-DeLong p= 0.0008. B. Cohort 2- DeLong-DeLong p= 0.0402. C. Cohort 3 - DeLong-DeLong p= 0.3403.
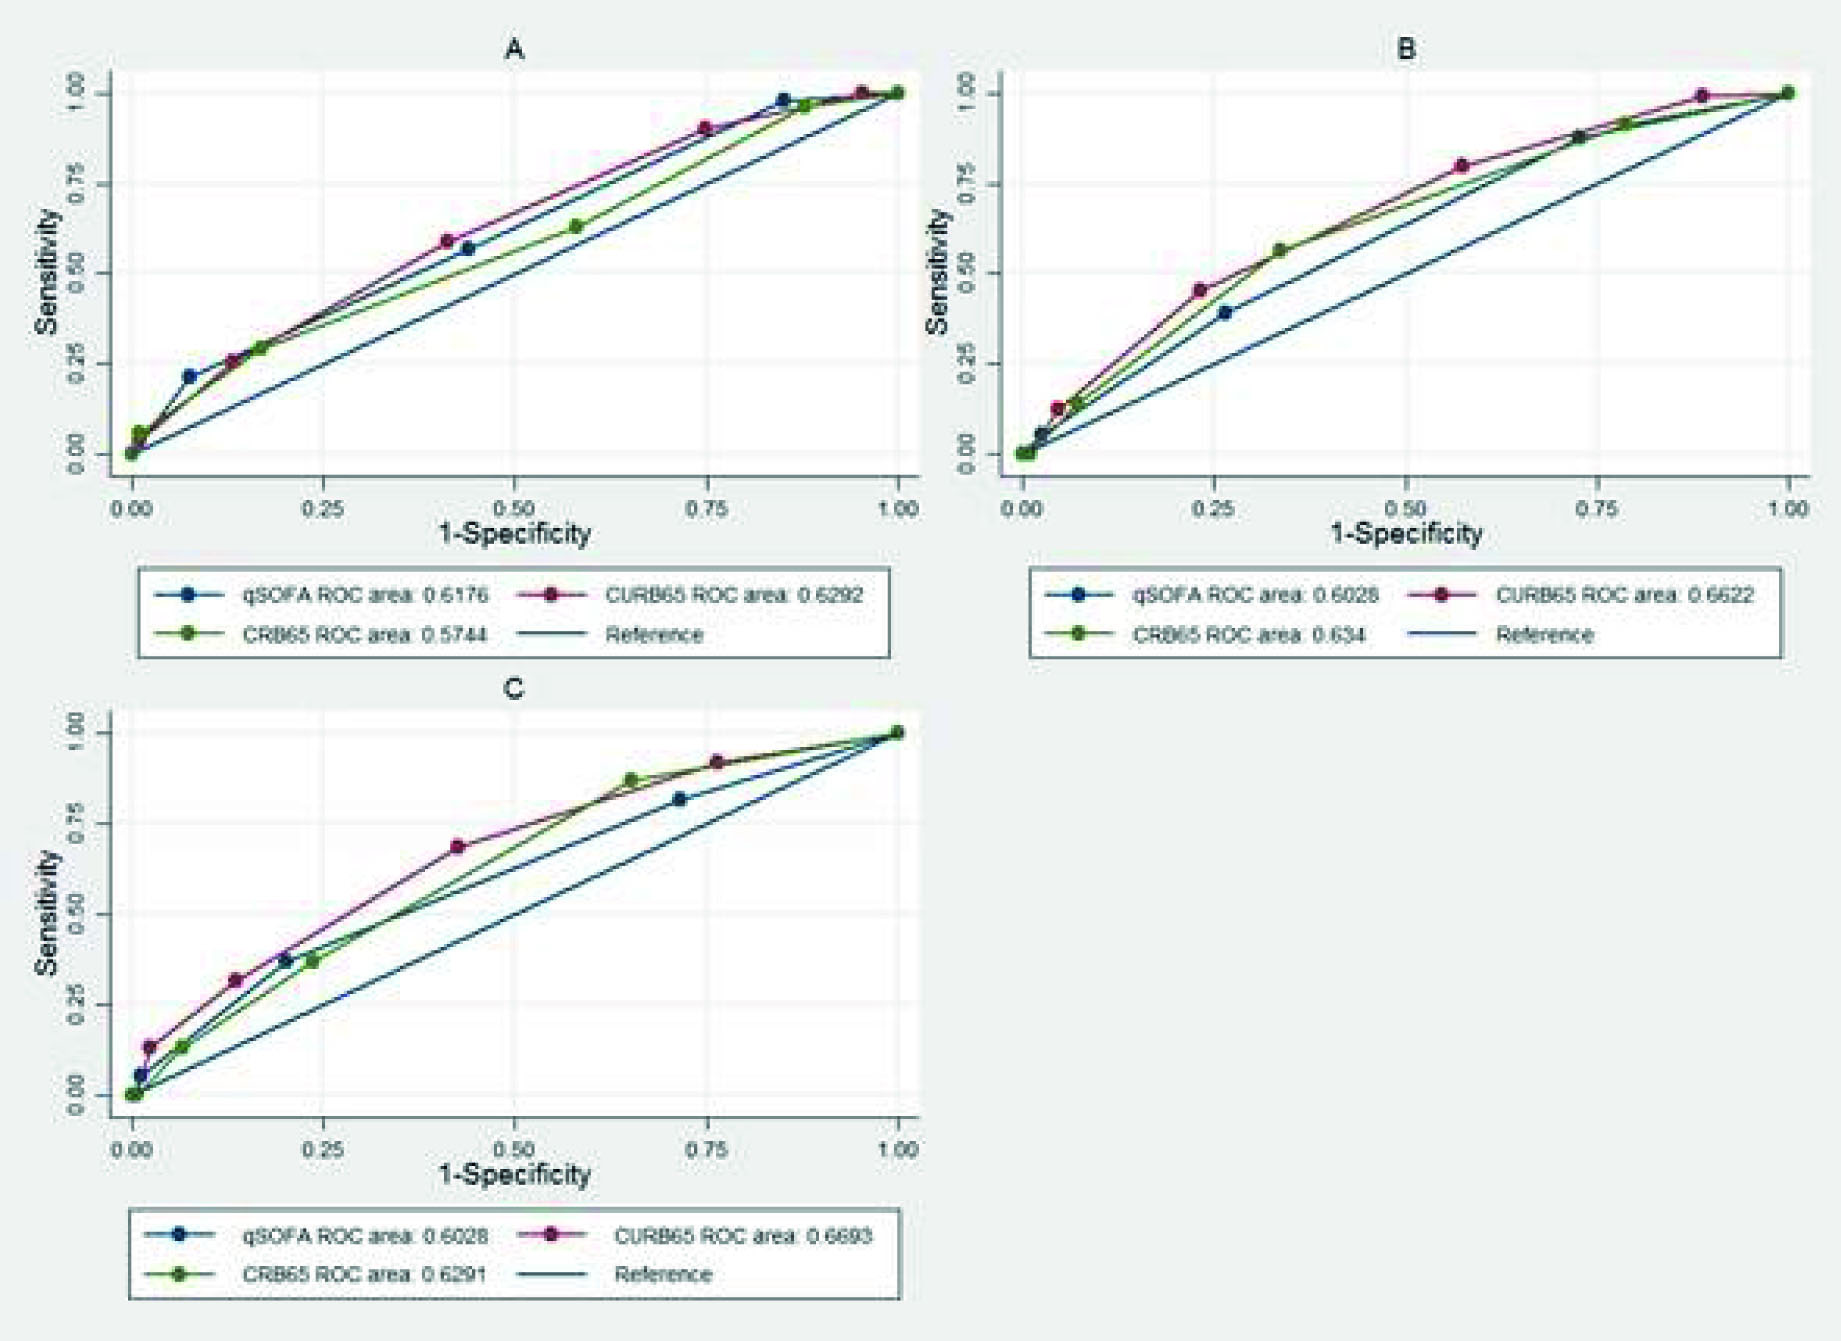
Figure 2 Receiver operating characteristic curve in the different cohorts for qSOFA, CURB-65 and CRB-65 in the discrimination of mortality. A. Cohort 1 (DeLong-DeLong p= 0.0108). B. Cohort 2 (DeLong-DeLong p= 0.0218). C. Cohort (DeLong-DeLong p= 0.1606).
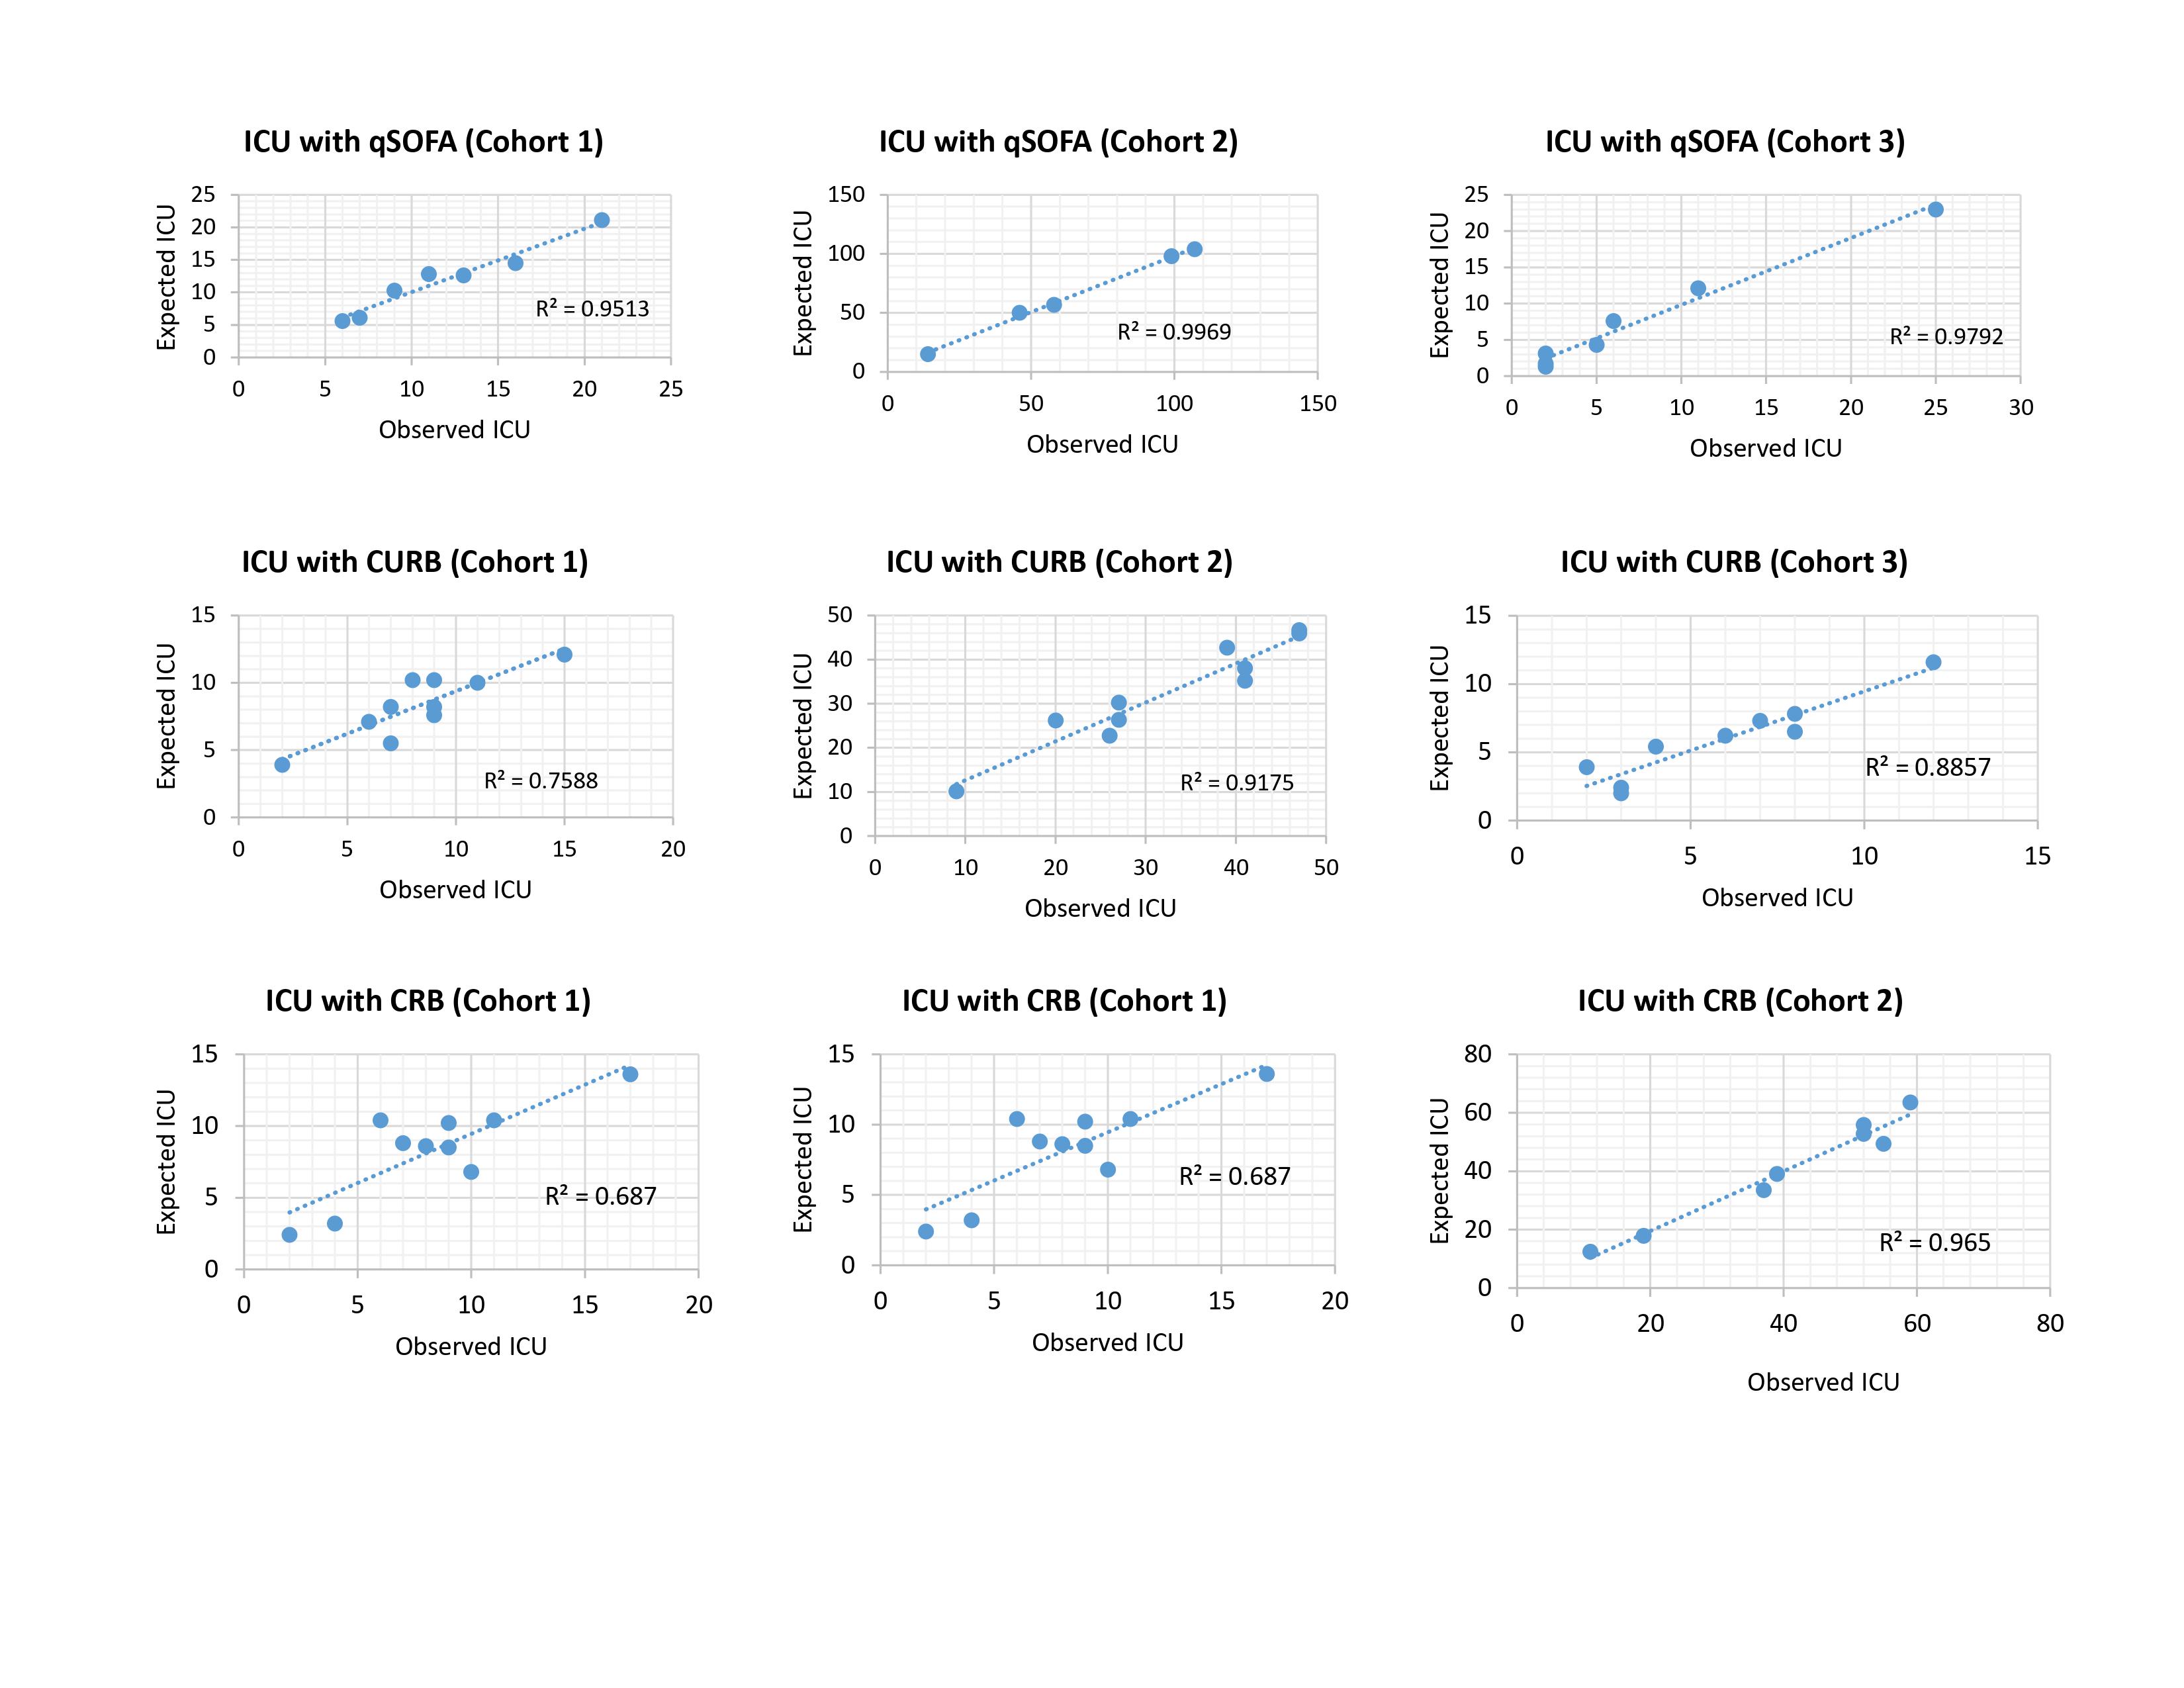
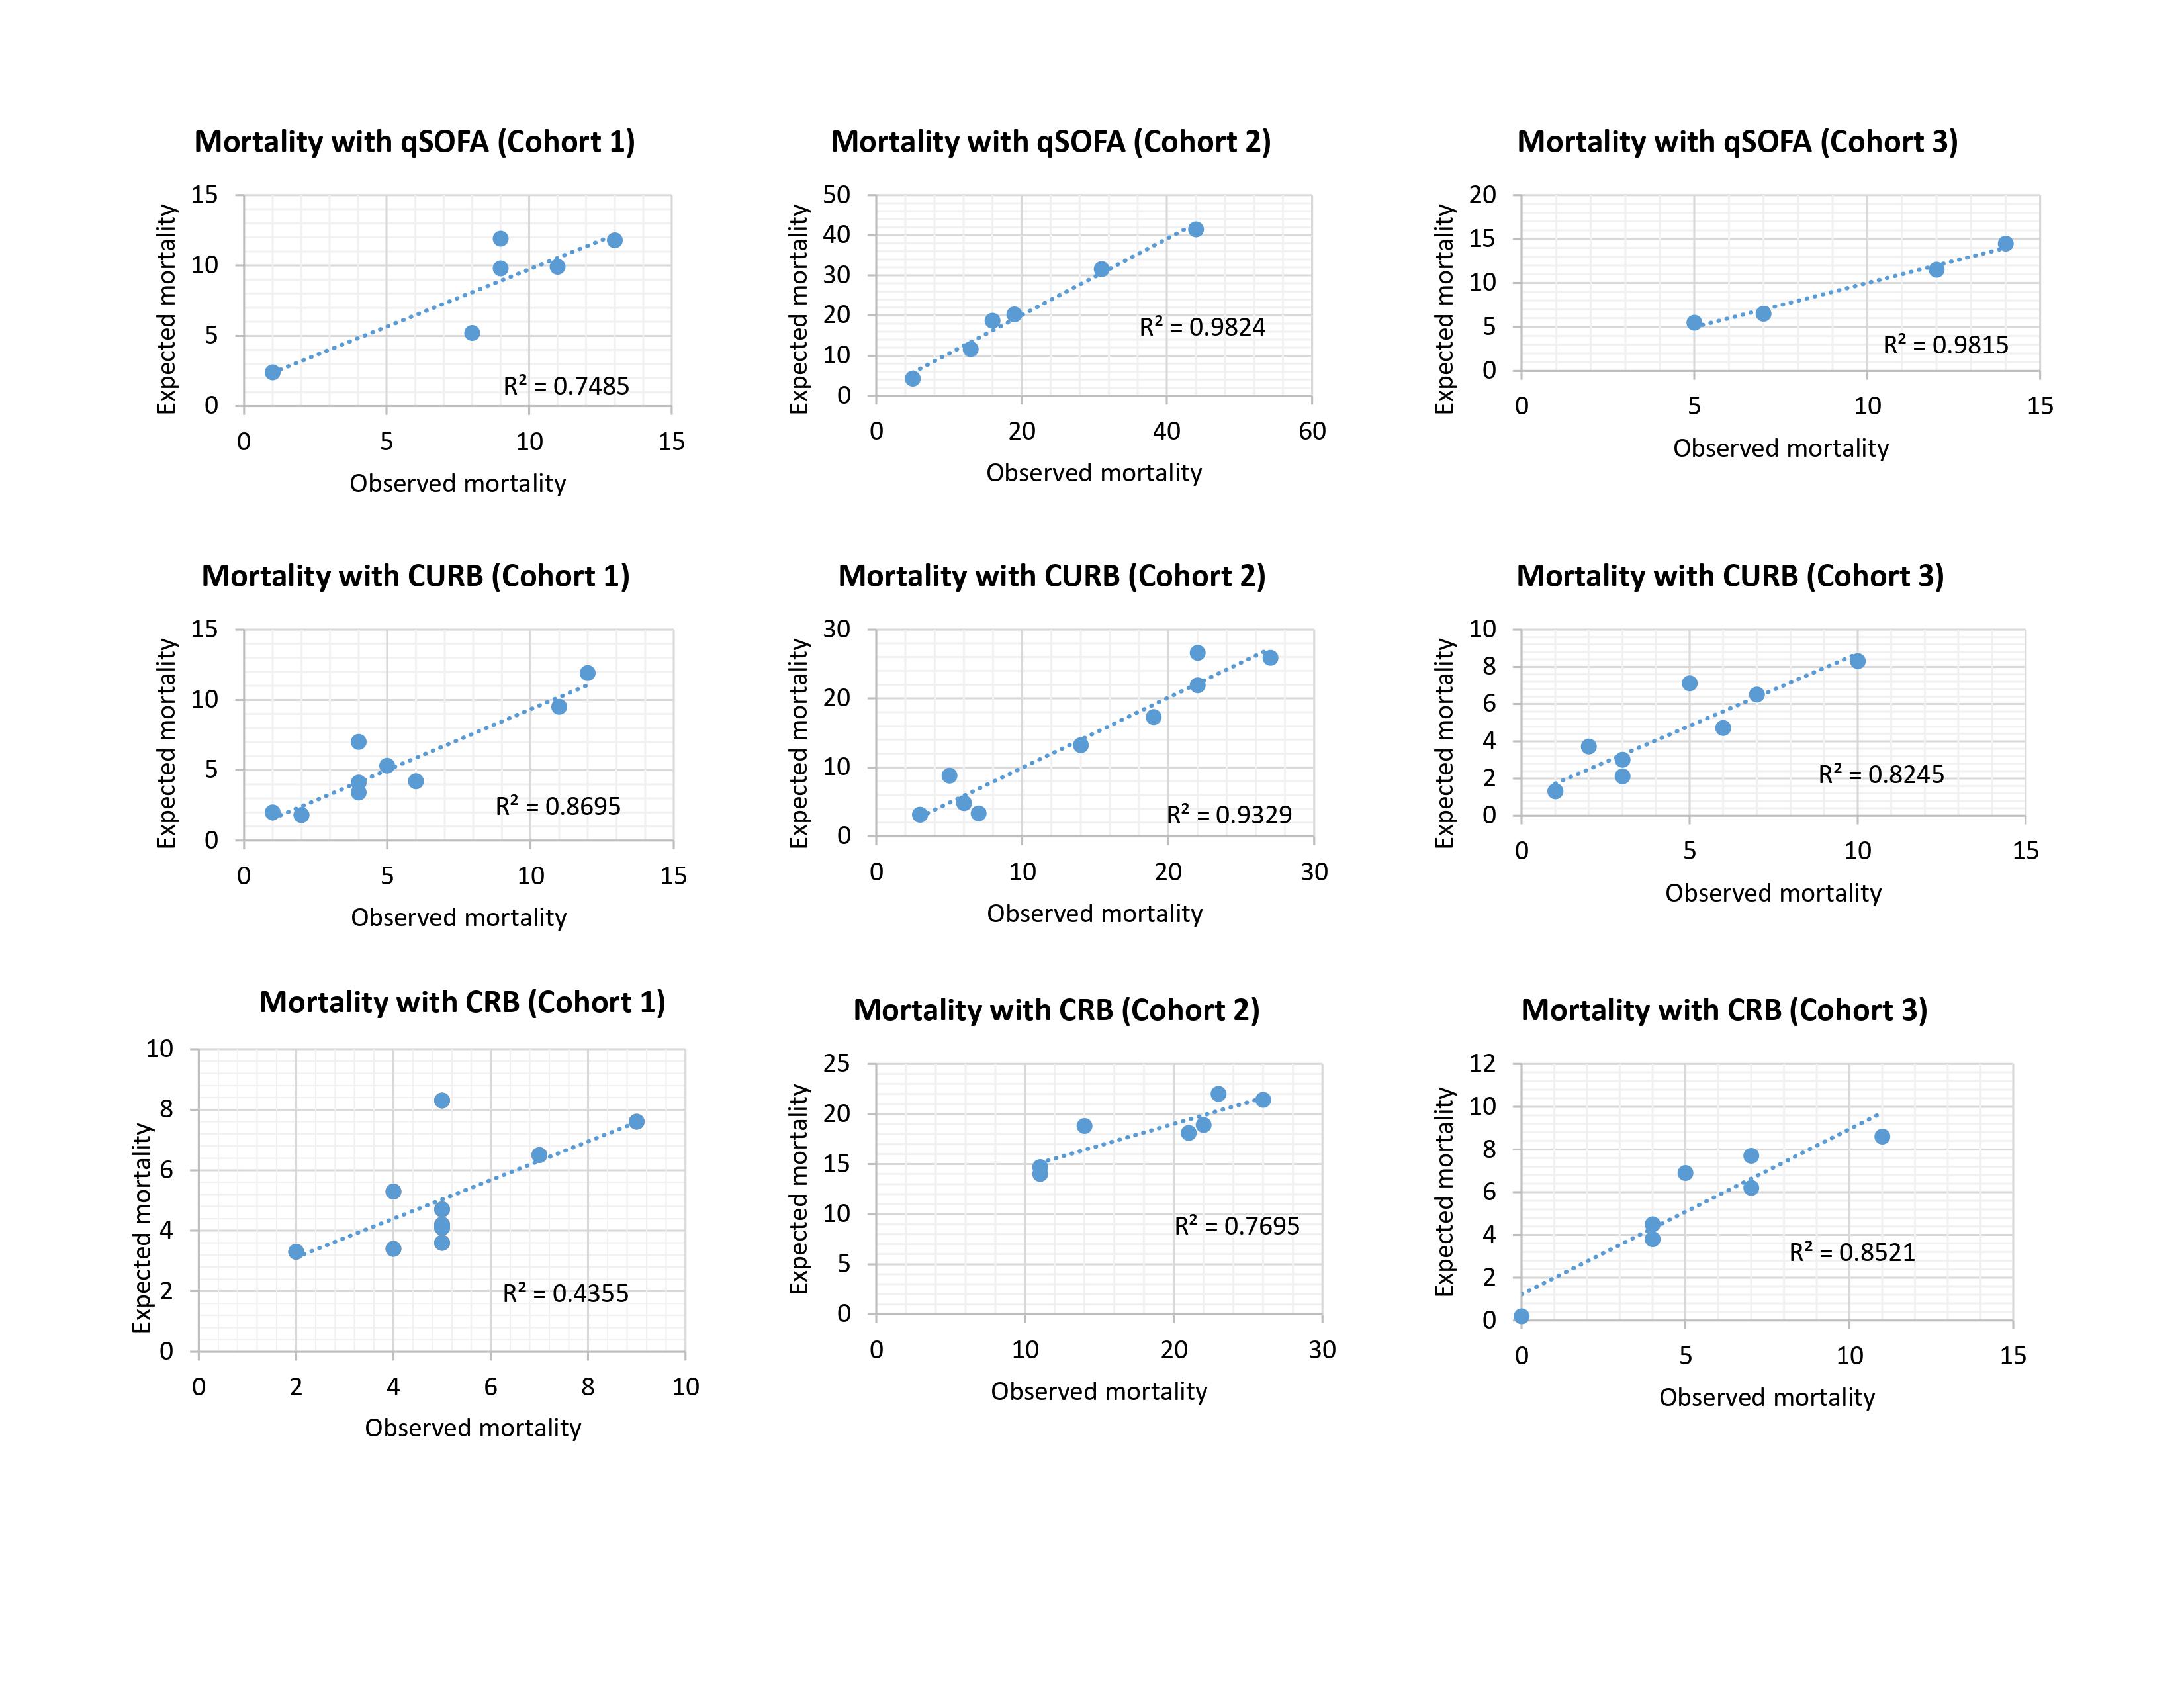
The calibration of the models was adequate in the study population for admission to the ICU and the mortality outcome, according to the Hosmer-Lemeshow statistic of the three scores in each of the cohorts (p> 0.05) (Table S1).
Additionally, calibration curves were performed for both outcomes in the different models in each of the cohorts, and a high degree of correspondence of the scores was shown in most of the cohorts (Supplementary Figure S1 and S2).
Regarding the performance of the models in their operative characteristics, the greatest sensitivity for ICU need was with the qSOFA (55.4%) and for mortality was with CURB-65 (58.8%) in cohort 1. The greatest specificity was with CRB-65 for both ICU need and mortality, with 93.5% and 93.4% in cohorts 2 and 3, respectively. The lowest performance in predicting mortality in terms of sensitivity was for the CRB-65 in cohort 3 (13.2%), for specificity it was for the qSOFA in cohort 1 (43.9%) and for the positive predictive value it was the CRB-65 in cohort 3 (Tables S2 and S3).
Discussion
We found that qSOFA, CURB-65 or CRB-65 were not optimal in discriminating hospital mortality or ICU admission in three cohorts of patients with community-acquired pneumonia admitted to five hospitals in Medellín. However, looking at the AUC, sensitivity and negative predictive value values, CURB-65 appeared to consistently perform better than the other two tools with respect to mortality discrimination. In contrast, with regard to calibration, it was possible to demonstrate a good performance for the three scores in the 3 cohorts. Nevertheless, a lack of good discriminative performance indicates that these scoring systems should not be used as predictive tools 19,21.
It is necessary to account for the setting of the studies that originally developed the scores: the CURB-65 and the CRB-65 were developed in the United Kingdom, New Zealand and the Netherlands 22 more than 20 years ago, countries with a community-acquired pneumonia associated mortality lower than in Colombia (9% vs 17-32%). On the other hand, the qSOFA was derived from a very recent cohort 23 that used a clinical spectrum beyond pneumonia and showed a hospital mortality of only 4%. In 2006, Capelastegui et al. (24, showed a similar performance between the CURB-65 and CRB-65 scores for mortality at 30 days with an AUC over 0.85. Subsequently, Man et al. compared these prediction rules for 30-day mortality in patients with community-acquired pneumonia and found AUCs higher than the ones observed in the present study 25.
In the original studies that served as the basis for the development of qSOFA, Seymour et al. found a good performance for the prediction of in-hospital mortality 26. Subsequently, Wang et al. performed a secondary analysis of data from a prospective cohort where they evaluated the performance of qSOFA in patients with an infection diagnosis who admitted to the emergency department, and found the score did not have a good performance (AUC=0.66) for 28-day mortality 27.
Previous studies have demonstrated these scores underestimated risk in patients with community acquired pneumonia. A couple of years ago, Chen et al. compared the performance of the qSOFA, CRB and CRB-65 with respect to mortality and admission to the ICU. The AUC-ROC values of the qSOFA for the prediction of mortality at 28 days were similar to those of the and CRB-65 scores, 0.655 vs 0.661 respectively. Likewise, the prediction of admission to the ICU showed similar discrimination measures, 0.666 vs 0.685 respectively 28. These results are consistent with ours in terms of discrimination, both for admission to the ICU and for mortality, despite its large sample size and being performed in a single hospital, which could result in less variability in the overall sample. In Germany, Kolditz et al. 18, compared qSOFA with the CRB and CRB-65 for 30-day mortality in patients with community-acquired pneumonia. They found that the AUC-ROC results favored the CRB-65 compared to the qSOFA, AUC-ROC 0.77 vs 0.70 respectively.
More recently, three different studies 29-31 show the comparison of severity scores in patients with COVID-19 pneumonia, all of them shows that that CURB-65 could be better compared with qSOFA at estimating mortality. Guohui et al. 30, found an AUC for discharge mortalitity of 0.85 for CURB-65, 0.80 for CRB-65 and 0.73 for and qSOFA. Bradley et al. found an AUC for 30 days mortalitity of 0.75 for CURB-65 and 0.62 for and qSOFA. Lazar Neto et al. found an AUC for 30 days in hospital mortalitity of 0.74 for CURB-65 and 0.63 for and qSOFA.
As shown in the studies presented previously, the performance of the scores changed significantly among all cohorts due to their differences, include the distribution of etiological agents, coexisting diseases, social support, availability of resources and medical behaviors, including the ICU admission criteria. In our study, these scores performance varied even though the cohorts were from the same city, which can be explained by the variability in the patient inclusion criteria.
The AUC-ROC is a statistical parameter that allows the comparison of predictive models of diagnosis or prognosis in terms of discrimination capacity, and it is reasonable to use an AUC-ROC >0.75 as a reference of acceptable performance. However, this statistical measure does not allow a direct clinical interpretation, and this limitation in predictive models is a constant in the literature on this topic, for this reason it is always necessary to evaluate simultaneously their operative characteristics. Regarding calibration, none of the mentioned studies above accounted for this in the statistical analysis. The critical importance of poor calibration is often underestimated. This can lead to a decrease in clinical utility; the implementation of a predictive tool with poor calibration could even lead to making decisions that are harmful to the patient 32. Future studies could consider other variables for score calculations, such as variables related to the microbiological agent, pulse oximetry, temperature, and comorbidities such as chronic obstructive pulmonary disease, congestive heart failure, and immunosuppression, among others.
One of the limitations of our study was the sample size. We based the difference of 0.7-0.77 between the discrimination (AUC-ROC) of CRB-65 and qSOFA scores on partial information from Kolditz et al 18. This difference, however, does not necessarily have a clinical basis and did not consider that all scores had a final poor discrimination performance (AUC <0.75). The traditional approximation of the sample size calculation in predictive models defines a value of at least 10 outcomes for each independent variable 33,34. For comparisons between models, exclusively by means of discrimination, we based the sample size formula on the AUC-ROC comparison by Hanley-McNeil 16,17. However, specifically for the validation of predictive models, there is no clear indication of the sample size calculation, and although some authors have suggested a minimum of 100 outcomes, many studies do not consider this aspect 35,36. On the other hand, the collection was performed in 5 institutions that are recognized as high quality health care centers, which can lead to a selection bias. However, the three cohorts had different inclusion criteria, which significantly improved the clinical spectrum of the study population. Another limitation was that despite being prospectively constructed cohorts, this study provides a secondary analysis of data, giving rise to missing urea values for some participants. These missing data were considered as abnormal values, which could generate a differential or non-differential classification bias. The missing data represented only 5%, however, and the sensitivity analysis with different scenarios did not improve the performance of the models.
A predictive model is not of practical use if it cannot discriminate and be calibrated at the same time: to properly separate those who present the condition from those who do not, is as important as whether there is agreement between observed and expected events 21. Unlike the supervision required for new medical technologies, prediction systems are not subjected to strict judgments, despite the potential risk of affecting a greater number of patients due to their extensive implementation.