


 texto em
  Inglês (pdf)
 Artigo em XML
 Referências do artigo
 Enviar este artigo por email
 Citado por SciELO
  Citado por Google
  Similares em
SciELO
Similares em
SciELO  Similares em Google
 Permalink
Remark
| 1) Why was this study conducted? |
| In order to update the information on incidence (2013-2017), mortality (2011-2020); and describe the changes in the trend of cancer incidence and mortality rates in Cali, Colombia from 1962 to 2017; and 1984 to 2020, respectively. |
| 2) What were the most relevant results of the study? |
| The incidence rates of cancers related to screening activities (prostate and breast) increased until the beginning of the 21st century; then declined in the second decade. With the implementation of aspiration cytology and the development of new diagnostic imaging methods, there was an increase in thyroid cancer diagnoses. In contrast, the incidence and mortality rates of cancers related to infectious agents continue to decrease (cervix and stomach), with an acceleration of the trend in the last five years. There is evidence of control of cancers related to tobacco consumption (lung, oral cavity, bladder). |
| 3) What do these results contribute? |
| Some indicators that will serve to evaluate the City Cancer Challenge initiative; and evidence of progress in the control of incidence and mortality for some types of cancer prioritized by the Ten-Year Plan for the Control of Colombian cancer. |
Introduction
Chronic non-communicable diseases (NCDs) cause 71% of all deaths annually in the world. One in five of these deaths is attributed to cancer 1,2, an increasing global public health problem, caused by a group of long-term diseases that are the first or second cause of premature death in people aged 30 to 69 years in 134 countries of the world 3. By 2040, it is estimated the appearance of 30.2 million new cases of cancer in the world; two thirds will occur in low- and middle-income countries, where cure rates are lower; and 20% of cancer diagnoses will occur in people under 75 years of age 4.
"The distribution of cancer types varies between countries; and age-standardized rates are expressed in cases per 100,000 person-years of incidence (ASR-I) and mortality (ASR-M). These rates are the measures of occurrence used to describe each type of cancer." In 2020, the ASR-I for the five most frequent locations of cancer in the world were breast (47.8), prostate (30.7), lung (22.4), colorectal (19.5) and cervix (13.3) Lung cancer was the leading cause of cancer death (ASR-M = 14.1) 5.
According to the World Health Organization (WHO), between 30 and 50% of cancers are preventable. To reduce the burden of the disease, it is necessary to reduce known risk factors and implement prevention strategies aimed at early diagnosis, timely treatment, and adequate patient care 6. These strategies coincide with the third of the Sustainable Development Goals (SDG), which aims to reduce by 2030 one third of premature deaths caused by NCDs 7.
The economic impact of cancer on the population and health systems is significant; however, there is evidence that investments in health are cost-effective. It is estimated that in order to save 7.3 million lives by 2030, a minimum investment of per capita spending is required, which can range from US $2.7 in high-income countries to US $3.95 and US $8.15 in high-to-medium income countries, and low-to-middle income countries, respectively 4. If between 2020 and 2030 there is an additional 6.9% increase in treatment costs for the comprehensive expansion of treatments, imaging tests and quality of cancer care, 12.5% of deaths in the world would be avoided, with US $2.9 billion in lifetime economic benefits, and a return on every dollar invested of US $12.43 8.
One in five low-to-middle income countries has the information necessary to promote policies against the disease 9. The Colombian government has organized the national cancer information system; it also determines the roles and responsibilities of the health system components, indicating the sources and integration of information, as well as the mechanisms for its improvement 10. There are six regional population-based cancer registries, which are part of the national cancer information system, and their purpose is to record incident cases in defined geographic areas: Cali, Pasto, Manizales, Bucaramanga, Barranquilla, and Medellín 11. The information they provide is used to measure and monitor the impact of cancer in the community; they represent the gold standard for providing cancer incidence and survival figures in each region, and they are a key element for cancer control because they provide indicators for planning and evaluating cancer control activities, as well as to conduct research 12.
The Cali Population Cancer Registry (RPCC, for its initials in Spanish) has operated continuously since 1962, monitoring the impact of cancer in the city 11,13,14. The RPCC is an accredited member of the International Association of Cancer Registries (IACR) and meets the international quality standards recommended by the International Agency for Research on Cancer (IARC) 15. This study presents age-standardized rates in incidence (2013 to 2017), and mortality from cancer (2011 to 2020); it also describes the changes in temporal trends in cancer incidence and mortality rates from 1962 to 2017, and 1984 to 2020, respectively.
Materials and Methods
Registry population and area
Cali, capital of the Valle del Cauca Province, is the third city in Colombia; its demographic structure, which is presented in Figure 1 according to the 1964 and 2018 censuses, shows changes in the shape of the population pyramid, with a reduction of the base and broadening of the cusp; the population has quadrupled, reaching 2.2 million inhabitants in 2018, from which 53.6% are women 16. There are 48 older adults (aged 65 years and over) for every 100 children and youth (aged under 15 years) 16,17. The population of 1964 was considerably younger than that of 2018. These data show a remarkable transformation of the population of Cali in the last 60 years. The coverage area of the cancer registry is the municipality of Cali, with a density of 40.42 inhabitants/hectare 18.
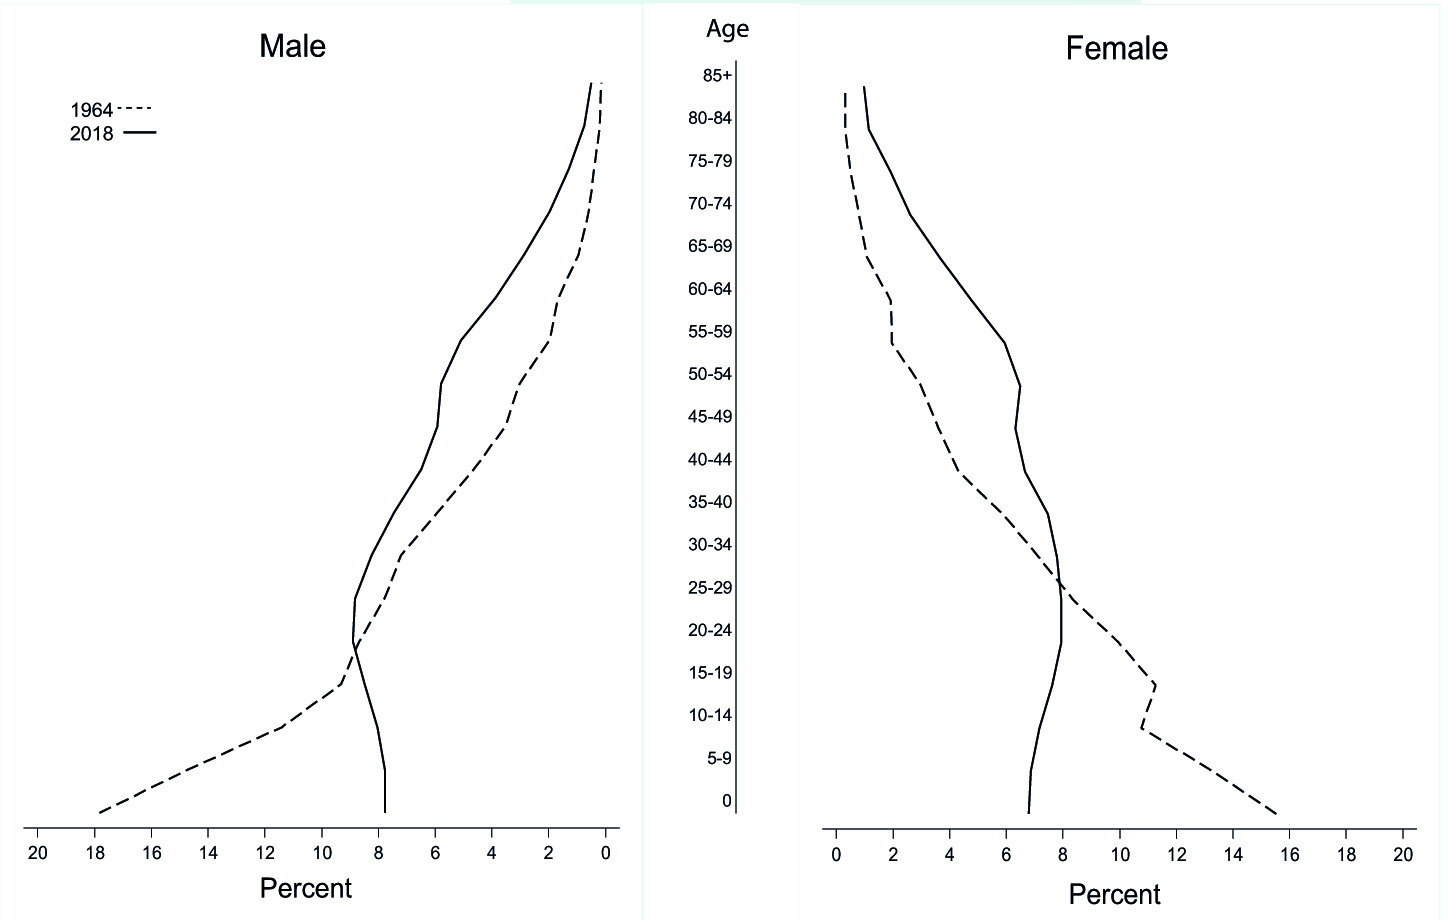
Figure 1 Silhouette of the population pyramids of Cali, 1964 and 2018. The 1964 population pyramid is expansive, with a broad base and a narrow top. The population pyramid in 2018 is regressive, with less population at the base than in the intermediate sections. For every 100 people aged under 15, there are 48 people aged over 65.
The Colombian health system
Colombia, a middle-to-high income country, has a General System of Social Security in Health based on a solidarity insurance model, founded on the principles of structured pluralism and regulated competition between public and private sectors. This compulsory and universal health insurance system seeks to cover the entire population, regardless of their socioeconomic status 19,20. Its financing is mixed, with contributions from workers, employers and the national government. Although health coverage reaches 99% of the population, the system is not yet efficient, and multiple supply and access barriers continue to exist 21.
The cancer care model was defined in the Decennial Cancer Control Plan in Colombia 2012-2021, which prioritizes cervical, breast, prostate, colorectal, stomach and childhood cancers 22. In Cali, the network for cancer care has 165 authorized oncology services, located in the urban area, where 95% of the population resides. Care is fractional, and only five hospitals have integrated cancer services; only one of them is a state hospital 23.
Cancer notification systems
Since 2014, the Ministry of Health has established a regulatory framework for the mandatory notification of cancer cases through the Epidemiology Surveillance System (SIVIGILA) 24 and the High-Cost Account (CAC) 25. Priority was given to all cases of childhood cancer and 11 adult cancers, seven solid tumors (breast, prostate, cervix, stomach, colon and rectum, lung, and melanoma) and four hematological neoplasms (both myeloid and acute lymphoblastic leukemias; as well as Hodgkin and non-Hodgkin's lymphomas). However, identity and tumor information are included for all people diagnosed with cancer located at any anatomical site, regardless of age or health insurance status 26.
The implementation of the notification systems facilitated the activities of the cancer registry during the 2013-2020 period, because most of the sources reported simultaneously to both the notification system of the ministry of health and the cancer registry.
Removal of cancer cases
The Cali cancer registry is population-based. New cases of cancer in permanent residents of the city are obtained on an ongoing basis through active search and reporting. Collection is continuous in diagnostic laboratories (pathology, cytology, flow cytometry), hospitals and clinics; both public and private; and in the Municipal Public Health Secretariat (death certificates and cancer notification systems). The procedures for updating the information and including new cases in the database have been previously described 27.
Case definition
Men and women of any age, residents in the urban area of Cali, with a diagnosis of invasive malignant tumor for the first time (incident), of any anatomical location, independent that has been confirmed or partially or totally treated. The basis for the diagnosis can be both microscopic (fluid cytology, peripheral blood and bone marrow, histology of primary tumors and autopsy); as well as non-microscopic (clinical, surgical and imaging diagnosis). They include single or multiple primary malignant tumors, all tumors of the Central Nervous System (CNS), and cancer in situ of the breast and cervix. There are excluded benign tumors with uncertain behavior, malignancies of metastatic site, and basal cell and squamous cell carcinoma of the skin (they were included until 1986). Those cases that have come to the city for treatment or diagnosis purposes are not considered residents of Cali 27.
Comparability
Malignant tumors were coded with the International Classification of Diseases (ICD) 28. During the long registration period, 1962-2020, three versions have been used (ICD-8, ICD-9 and ICD-10); in 1998, the IARCTools program was used to convert the codes between the CIE versions 29. The main locations were defined according to the guidelines suggested by the International Agency for Research on Cancer (IARC) for the analysis of incidence information; and by WHO to group the primary tumor site and the underlying cause of death 5,15,27. The date of incidence corresponds to the date of the first histological or cytological confirmation of the cancer. To classify multiple primary tumors, the guidelines of the European Network of Cancer Registries (ENCR) and the IARC/IACR 30,31. Details regarding the history, objectives, logistics and coverage; as well as procedures and methods for estimating incidence, mortality, and survival in adults have been previously described 15,27.
Incidence and mortality analysis
Cases: Information on new cancer cases was obtained from the RPCC database, and information on general mortality is periodically obtained from individual death certificates notified to the Municipal Public Health Secretariat of Cali.
Population at risk. The population structure for Cali by sex and five-year age groups for each calendar year was obtained from official census data provided by the National Administrative Department of Statistics of Colombia (DANE) 16,18. 18 age groups were taken into account, using the categories 0-4, 5-9, 10-14, 15-19… 80-84, 85+).
Estimate of rates. Incidence and mortality rates are expressed as annual average rates for a five-year observation period; the denominator (total population or specific stratum) becomes an estimate of person-years of observation. Individuals of the opposite sex were excluded from the denominator of sex-specific cancer rates.
Crude rates, standardized rates, and age-specific rates are expressed per 100,000 person-years. Standardization by age was done with the direct method using the world standard population proposed by Segi (ASR-W, for its English acronym, Age-Standardized Rate) 27,32. To describe the incidence and mortality information, the acronyms ASR-W (I) and ASR-W (M) will be used, respectively.
The crude rate (RC), for all ages, was calculated by dividing the total number of cases of each type of cancer by the number of person-years of observation. The age-specific rate for each group was calculated by dividing the number of cases in the age group by the corresponding person-years of observation. To obtain the ASR-W, the age-specific rates (ai) were multiplied by the weights of the standard population (pi) resulting in the product aipi, whose sum was divided by 100,000.
Rate trend analysis
The trend in cancer incidence and mortality rates was analyzed for eleven five-year periods (1962-2017) and seven five-year periods (1984-2020), respectively. The trend of the rates was examined using the annual percentage change in the rates (APC) with 95% confidence intervals (95% CI). It was used the weighted least squares method, implemented by default in the SEER * Stat program 33. In order to identify the moment in which significant changes in the trend occurred, and to estimate the trend observed in said interval, the JoinPoint regression model was used 34. The (APC) represents the average annual percentage increase or decrease in cancer rates during a specific time period. In describing the change, the terms "increase" or "decrease" were used when the APC was significantly different from zero (two-sided p-values <0.05); otherwise, the term "stable or flat" was used.
Quality indicators
Incidence information. Internal consistency was evaluated using the IarcTool program 12,29; validity, by using diagnostic criteria methods (percentage of cases identified only by death certificates, proportion of morphologically verified cases and categorized by sex and place). Completeness was evaluated by analyzing the mortality: incidence ratio (M: I), and the missing information analyses describe the percentage of poorly defined sites, unknown age, and unknown diagnosis base.
Mortality information. The quality of the certification of mortality was evaluated using the following proportions (%): deaths from cancer of the uterus of unspecified site (C55); deaths from cancer of an unestablished primary, of poorly specified sites, or as a consequence of a metastatic tumor without an unestablished primary (C76-C80, C97); cancer deaths without age information; cancer deaths that were not certified by a physician; and well-certified cancer deaths 35.
Ethical considerations
The RPCC follows the guidelines of the European Network of Cancer Registries (ENCR) 30. The director of the RPCC is responsible for information security. All members of the RPCC sign an agreement to ensure the protection of the confidentiality of data about people whose cancer is reported to the RPCC. Access to the physical space of the Registry is restricted to authorized persons. Information considered confidential is controlled by access codes to computers, closed files and destruction of material with identification when it is no longer useful. A single person (administrator) makes the initial matches between databases to detect new cases and update vital status and last contact information. Each case is assigned a registration number, and the information that identifies a patient is removed when the data (name and identity document) are analyzed.
Results
New cases of cancer (2013-2017)
Table 1 shows the cancer incidence rates per 100,000 person-years by sex and location for the five-year period 2013-2017. During this period, 24,963 new cases of cancer were diagnosed in permanent residents of Cali, for an annual average of 4,993 cases; 55% (13,772) occurred in women; the female/male ratio was 1.2. The age-standardized incidence rates for all locations in men were 191.2; and 175.4 in women. The proportion of cancer cases with morphological verification was 88.8%; and 1.5% had the death certificate as the only evidence of cancer diagnosis.
The five main sites of primary cancer in men were prostate (ASR: 53.8), stomach (ASR: 18.0), colon and rectum (ASR: 17.3), lymphomas (ASR: 13.3), and lung (ASR: 13.1), being 60.4% of all new cases during the period. In women, the most frequent locations were breast (ASR: 45.9), thyroid (ASR: 17.4), colon and rectum (ASR: 14.3), cervix (ASR: 13.0), and stomach (ASR: 9.8), corresponding to 56.8% of all new cases diagnosed in the period.
Table 1 Cali, Colombia. Incidence rates standardized by age (World Population) per 100,000 person-year and the annual percentage change (APC) by sex during the period 2013-2017
| Male | Female | Male | Female | Code | |||||
|---|---|---|---|---|---|---|---|---|---|
| Site | n | ASR | n | ASR | APC | 95% CI | APC | 95% CI | ICD 10 |
| Oral cavity and pharynx | 313 | 5.3 | 241 | 3.1 | -1.0* | (-1.3 ; -0.6) | -1.0* | (-1.5 ; -0.6) | C00-14 |
| Esophagus | 117 | 2.0 | 57 | 0.6 | -1.5* | (-2.1 ; -0.8) | ~ | C15 | |
| Stomach | 1,074 | 18.0 | 823 | 9.8 | -1.9* | (-2.1 ; -1.8) | -1.9* | (-2.2 ; -1.7) | C16 |
| Small intestine | 44 | 0.7 | 56 | 0.7 | ~ | ~ | C17 | ||
| Colon and Rectum | 1,025 | 17.3 | 1,168 | 14.3 | 2.2* | (1.9 ; 2.5) | 1.6* | (1.3 ; 1.9) | C18-20 |
| Anus | 37 | 0.6 | 96 | 1.2 | ~ | ~ | C21 | ||
| Liver | 272 | 4.7 | 282 | 3.3 | 1.8* | (1.2 ; 2.4) | 0.6 | (-0.1 ; 1.3) | C22 |
| Gallbladder | 119 | 2.0 | 244 | 2.9 | -1.3* | (-1.9 ; -0.8) | -2.1* | (-2.6 ; -1.6) | C23-24 |
| Pancreas | 271 | 4.6 | 318 | 3.7 | ~ | 0.0 | (-0.4 ; 0.3) | C25 | |
| Nasal cavity and middle ear, paranasal sinus | 33 | 0.6 | 37 | 0.4 | ~ | ~ | C30-31 | ||
| Larynx | 149 | 2.6 | 28 | 0.3 | -1.5* | (-2.0 ; -1.0) | ~ | C32 | |
| Bronchi and lung | 768 | 13.1 | 599 | 6.9 | -1.0* | (-1.5 ; -0.6) | 0.0 | (-0.5 ; 0.5) | C34 |
| Bone | 97 | 1.6 | 97 | 1.4 | 1.0* | (0.3 ; 1.6) | 0.5 | (-0.3 ; 1.3) | C40-41 |
| Connective tissue | 143 | 2.3 | 143 | 1.9 | ~ | 0.2 | (-0.3 ; 0.7) | C47-49 | |
| Mesothelioma | 14 | 0.2 | 6 | 0.1 | ~ | ~ | C45 | ||
| Kaposi Sarcoma | 60 | 1.0 | 11 | 0.1 | ~ | ~ | C46 | ||
| Skin melanoma | 137 | 2.3 | 174 | 2.2 | ~ | 0.4 | (-0.2 ; 1.0) | C43 | |
| Other skin | 54 | 0.9 | 68 | 0.9 | ~ | ~ | C44 | ||
| Breast | 58 | 1.0 | 3,546 | 45.9 | ~ | 1.1* | (0.9 ; 1.4) | C50 | |
| Vulva | 47 | 0.5 | -1.9* | (-2.6 ; -1.2) | C51 | ||||
| Vagina | 34 | 0.4 | ~ | C52 | |||||
| Uterus unspecified | 62 | 0.8 | ~ | C55 | |||||
| Uterine cervix | 992 | 13.0 | -3.1* | (-3.3 ; -2.9) | C53 | ||||
| Corpus uteri | 400 | 5.1 | 0.2 | (-0.2 ; 0.5) | C54 | ||||
| Ovary | 472 | 6.1 | -0.5* | (-0.8 ; -0.1) | C56 | ||||
| Other females genital organs | 32 | 0.4 | ~ | C57-58 | |||||
| Penis | 60 | 1.0 | ~ | C60 | |||||
| Prostate | 3,083 | 53.8 | 2.1* | (1.5 ; 2.7) | C61 | ||||
| Testicle | 160 | 2.5 | 1.6* | (1.0 ; 2.2) | C62 | ||||
| Other male genital organs | 7 | 0.1 | ~ | C63 | |||||
| Kidney, renal pelvis, urethra | 298 | 5.1 | 242 | 3.3 | 2.6* | (2.0 ; 3.1) | 2.0* | (1.5 ; 2.5) | C64-66 |
| Bladder | 301 | 5.1 | 118 | 1.3 | -0.9* | (-1.3 ; -0.5) | -1.4* | (-1.9 ; -0.8) | C67 |
| Other urinary organs | 2 | 0.0 | 0.0 | 0.0 | ~ | ~ | C68 | ||
| Eye | 78 | 1.3 | 73 | 1.1 | ~ | ~ | C69 | ||
| Central Nervous System | 295 | 5.1 | 268 | 3.7 | 1.0* | (0.5 ; 1.4) | 1.5* | (1.0 ; 2.0) | C70-72 |
| Thyroid | 234 | 3.8 | 1,293 | 17.4 | 1.9* | (1.1 ; 2.7) | 2.9* | (2.6 ; 3.3) | C73 |
| Other endocrine | 12 | 0.2 | 6.0 | 0.1 | ~ | ~ | C74-75 | ||
| Hodgkin's disease | 101 | 1.7 | 69 | 1.0 | -1.4* | (-1.9 ; -0.8) | -0.7* | (-1.4 ; -0.1) | C81 |
| Non-Hodgkin lymphoma | 502 | 8.5 | 467 | 6.0 | 1.5* | (1.0 ; 2.0) | 1.3* | (0.8 ; 1.9) | C82-85, 96 |
| Multiple myeloma | 187 | 3.1 | 173 | 2.1 | ~ | ~ | C90 | ||
| Lymphocytic leukemia | 245 | 4.7 | 177 | 2.6 | 1.9* | (1.4 ; 2.4) | ~ | C91 | |
| Myeloid and monocytic leukemia | 191 | 3.1 | 155 | 2.1 | -0.2 | (-0.8 ; 0.3) | 0.7* | (0.1 ; 1.2) | C92-94 |
| Non-specific leukemia | 48 | 0.8 | 43 | 0.5 | ~ | ~ | C95 | ||
| Poorly defined sites | 483 | 8.2 | 528 | 6.4 | -0.5* | (-0.9 ; -0.2) | -1.2* | (-1.6 ; -0.8) | ** |
| All the sites | 11,191 | 191.2 | 13,772 | 175.4 | 0.4* | (0.2 ; 0.6) | -0.2* | (-0.3 ; -0.1) | C00-96 |
| All the sites ¶ | 11,137 | 190.3 | 13,704 | 174.5 | 0.4* | (0.2 ; 0.6) | -0.2* | (-0.3 ; 0.0) | C00-43, 45-96 |
Number of cases (n); Standardized incidence rate by age (ASR, by its acronym in English)
APC: For its acronym in English Annual Percent Change. APC is calculated for period 1962-2017
*The APC is significantly different from zero (p <0.05)
**C26, C39, C48, C76, C80 - ICD: 998_/3
~ APC could not be calculated
¶ All sites excluding non-melanoma skin cancer
Figure 2 shows the age-specific incidence and mortality rates for all locations according to sex during the 2013-2017 period.
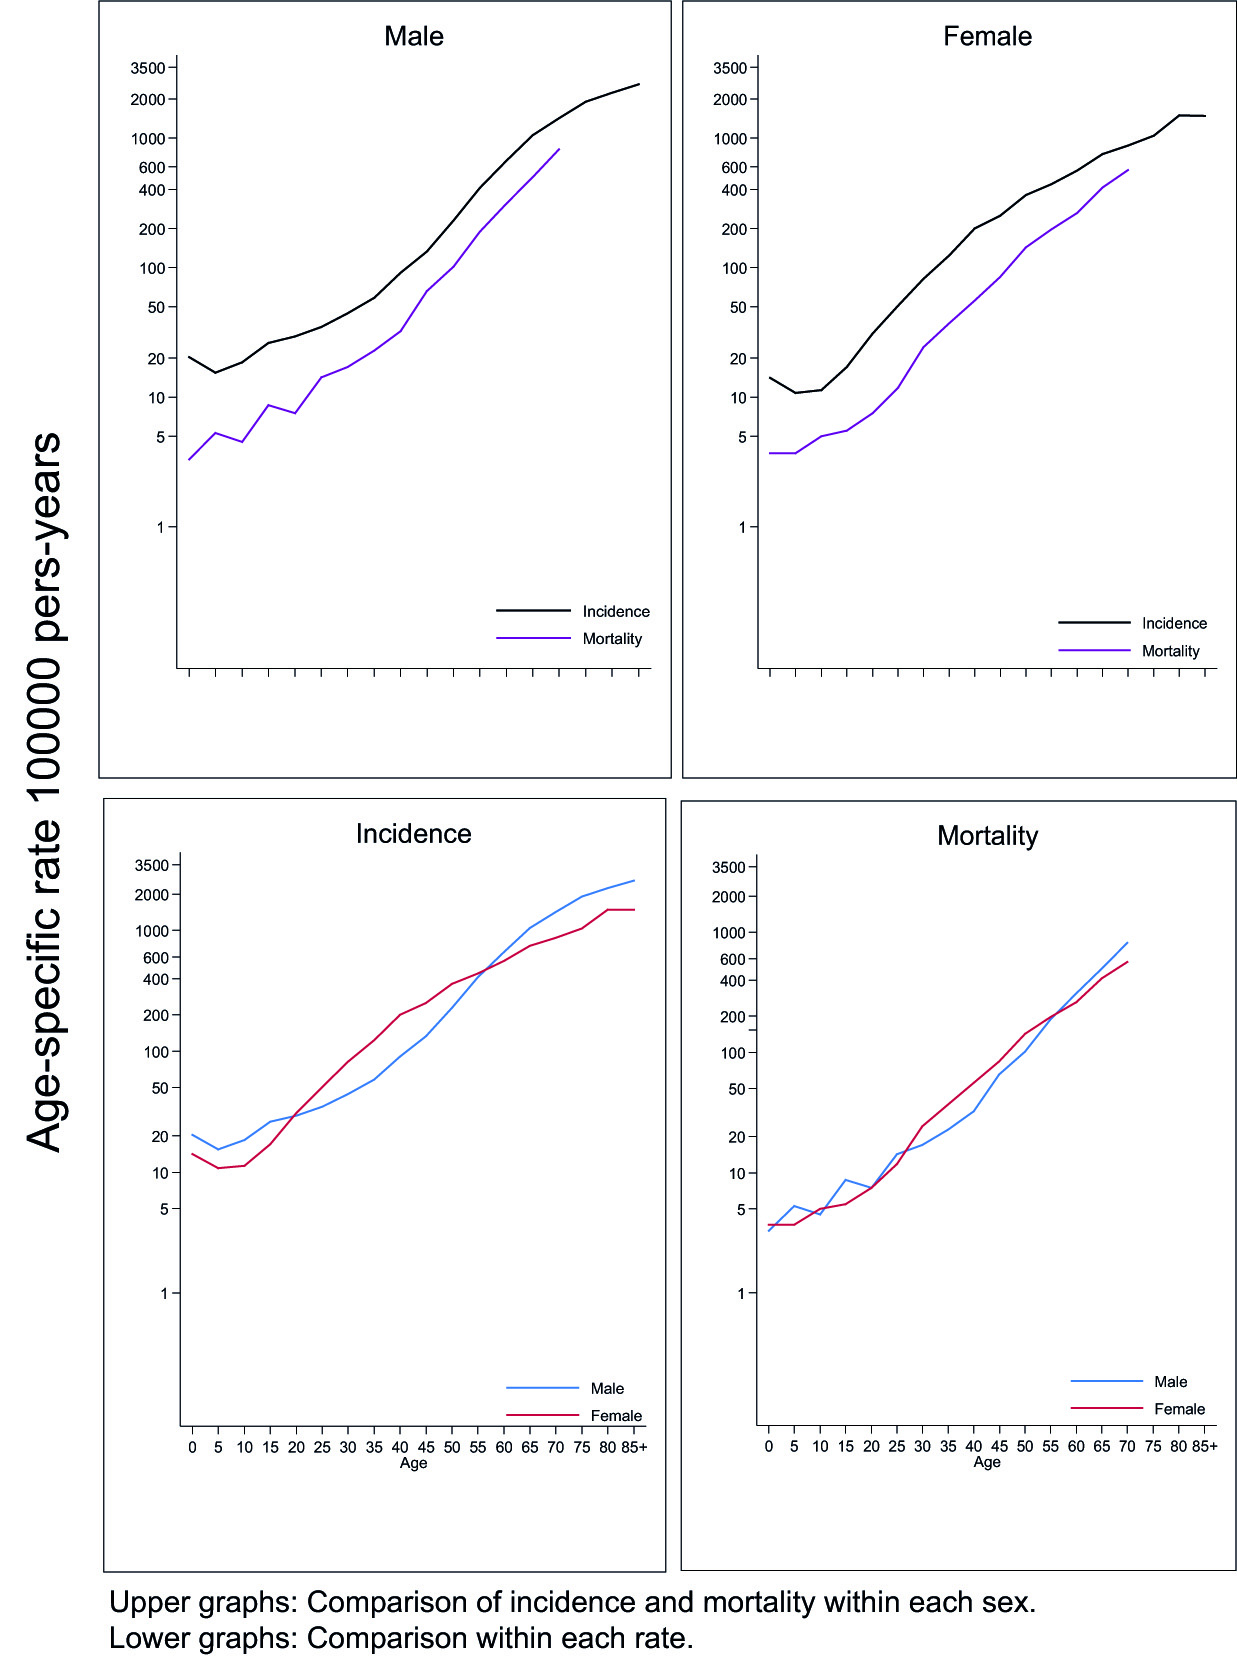
Figure 2 Cali, Colombia. Age-specific incidence and mortality rates for all locations according to sex. 2013-2017. The upper panel shows the age-specific incidence and mortality rates for all cancer sites for each sex. The incidence and mortality curves by sex follow a parallel course, and tend to converge with aging, being more accentuated in women. The bottom panel shows that age-specific incidence and mortality rates in those younger than 50 years are higher in women, because cervical and thyroid cancers develop at younger ages. In older adults, incidence and mortality rates are higher in men due to the influence of aerodigestive and prostate cancers. In childhood, incidence rates are higher in men.
Figure 3 shows the curves of the specific incidence rates by age (C-TEE), and sex on a logarithmic scale for the main locations; the rates are expressed per 100,000 person-years. Supplementary Table 1S shows the age-specific incidence and mortality rates during the five-year period 2013-2017 and 2016-2020, respectively. Most cancers present a characteristic pattern, C-TTE in those under 50 years of age are similar in men and women; then, they are higher in men, with the exception of thyroid cancer. As age increases, it was observed an increase in the magnitude of age-specific incidence rates in all locations, except in thyroid cancer, which tends to decrease in women older than 60 years. Ovarian, thyroid, and hematolymphoid cancers manifest from an early age; on the other hand, cancers of the prostate, esophagus, and larynx are rare under the age of 50.
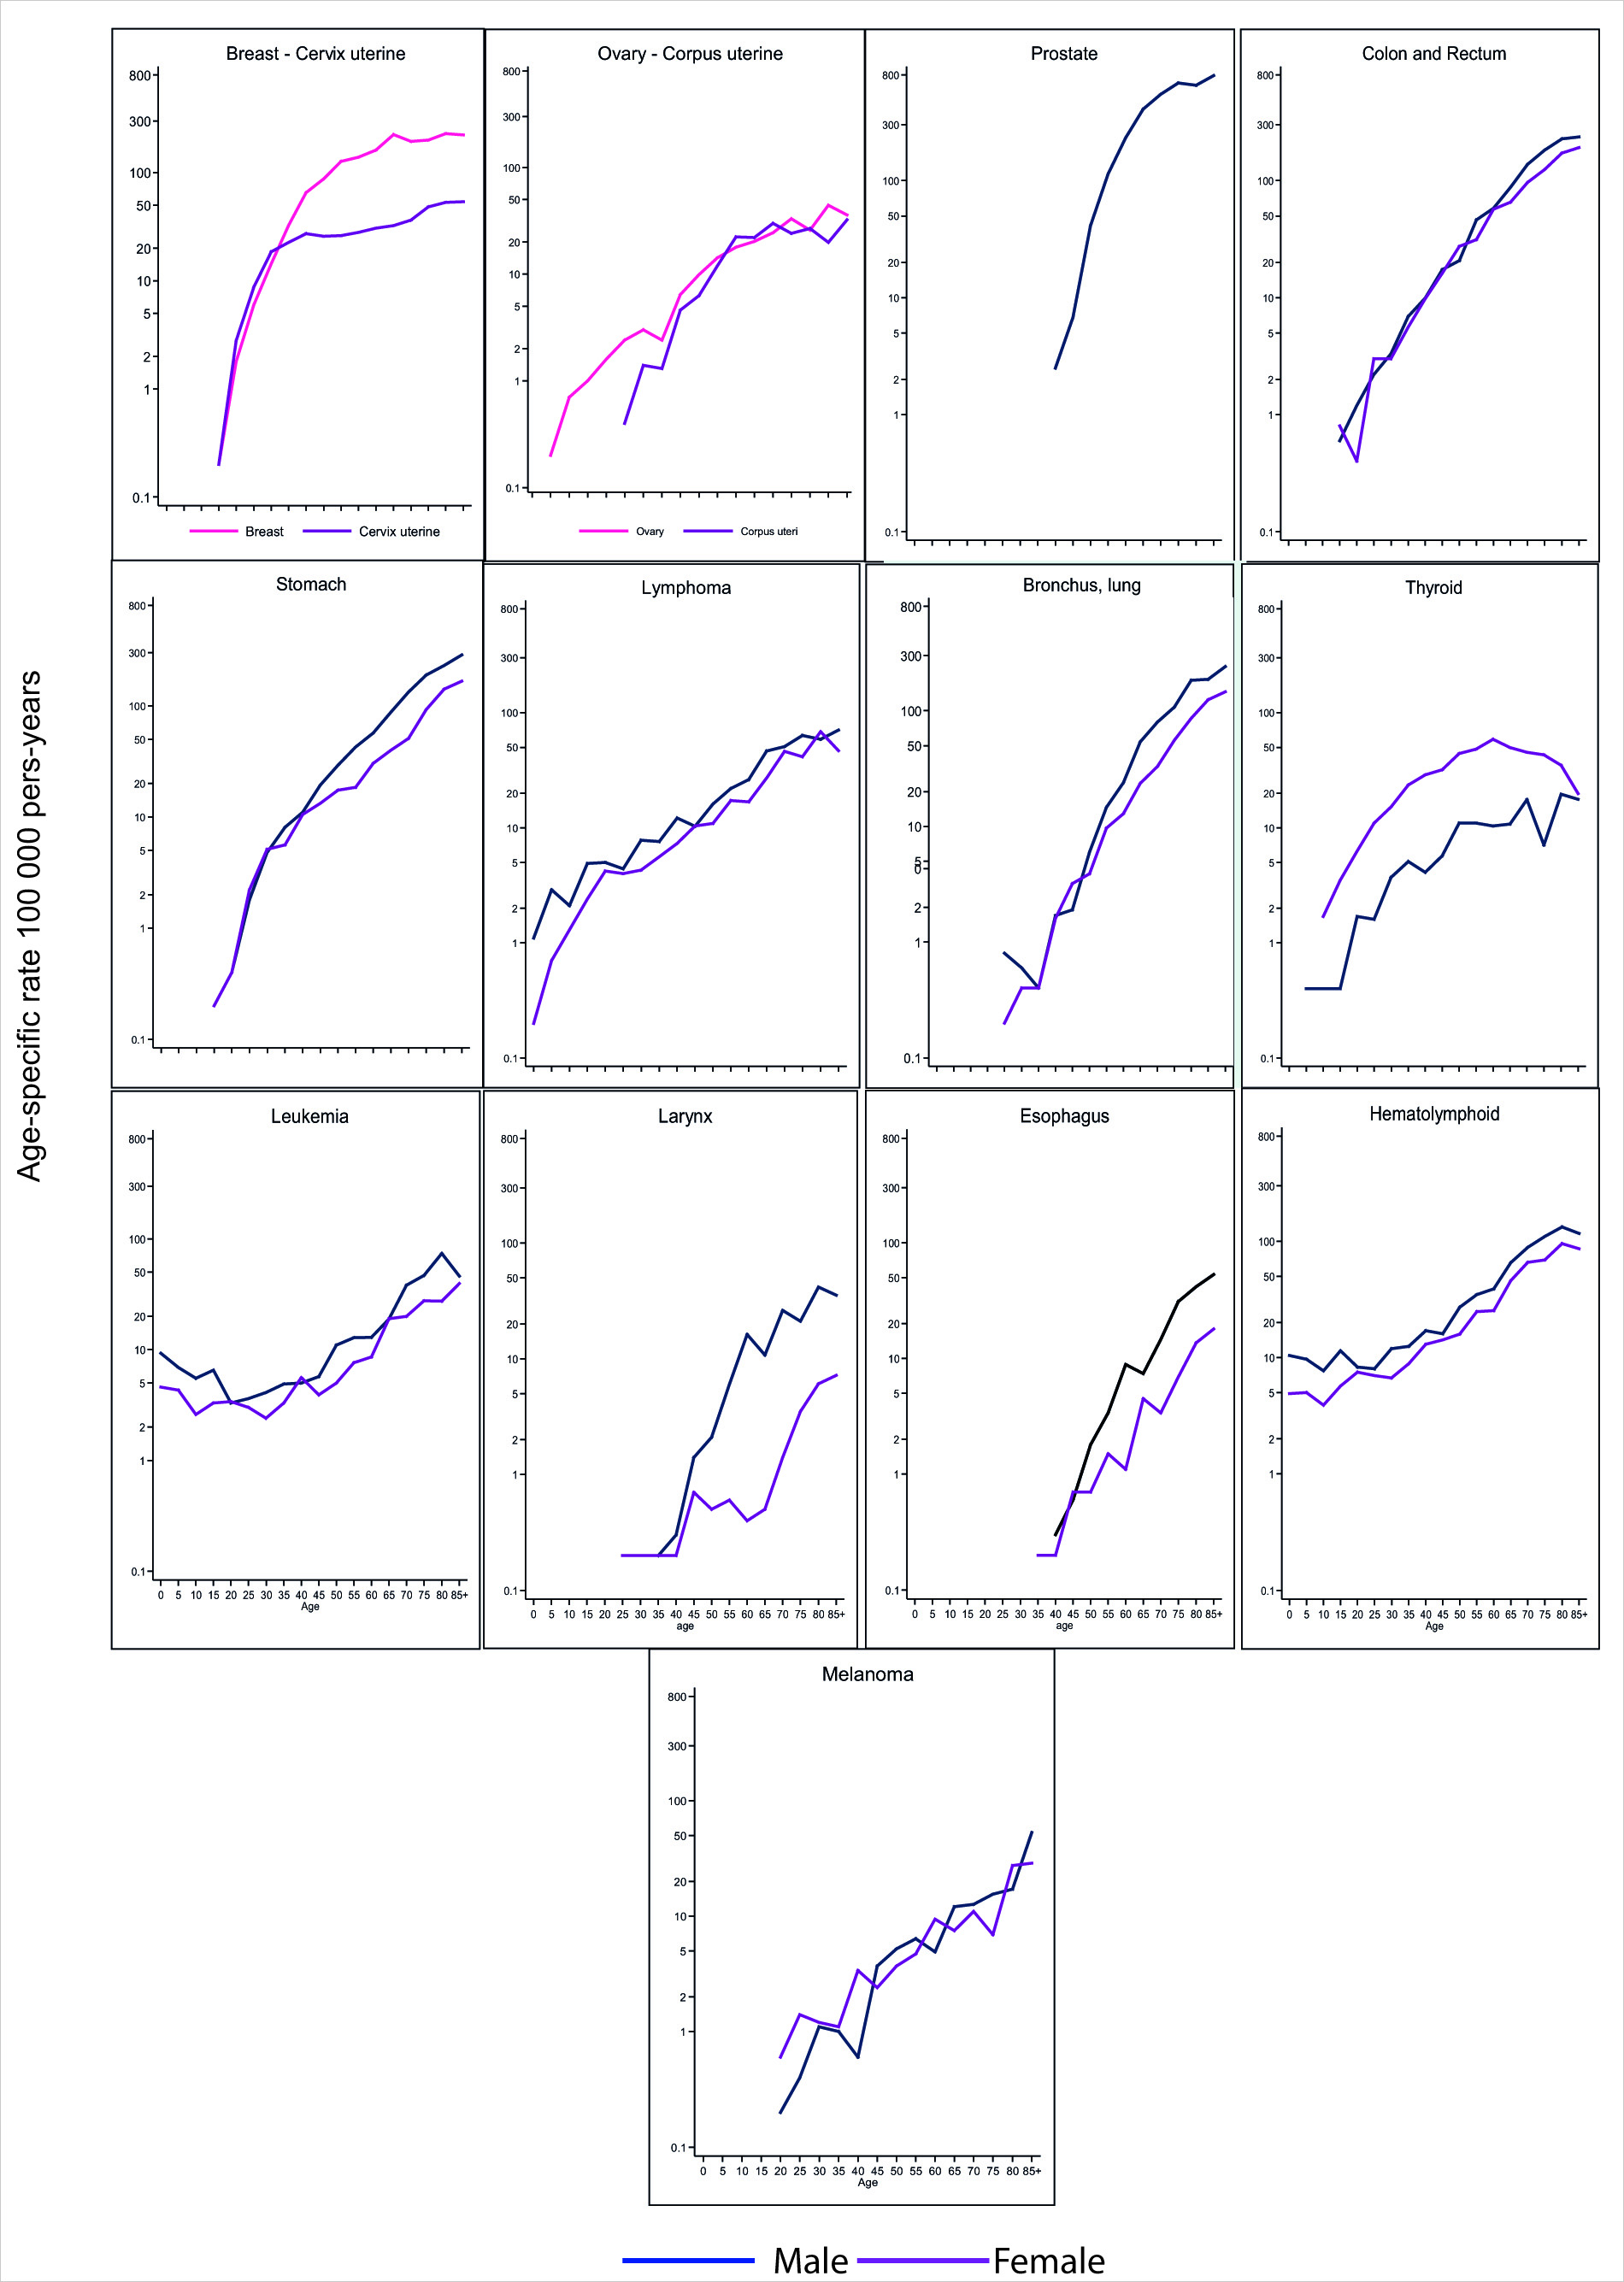
Figure 3 Cali, Colombia. Age-specific incidence rates according to type of cancer and sex. 2013-2017
The age-specific rate curve for hematolymphoid cancers (leukemias and lymphomas) is U-shaped, decreasing from early childhood through adolescence, and then increasing from adulthood to old age. However, this pattern is valid only for leukemias, because in lymphomas the rates increase steadily from infancy to old age.
In melanoma and aerodigestive cancers (stomach, colorectal, esophagus, larynx, and lung) the age-specific incidence rate curve tends to be straight. They differ from each other by the slope of the curve, and by the age at which the cases begin to appear. These cancers are rare before the fourth decade.
The curves for specific cancers of women start from the first decade (ovary and thyroid), third decade (breast and cervix), and later for uterine corpus cancer. Before the age of 50, cervical cancer is more common than breast cancer; then, the frequency is inverted. In all these cancers, the exponential rise associated with age slows down from the fifth and sixth decades onwards, to the point that women with thyroid cancer over 60 years of age have less risk than those under this age; this decrease in ASR suggests a cohort effect, women born 60 years ago had a lower risk of thyroid cancer morbidity. To comprehensively analyze this component, it is necessary to use age-period-cohort models.
Prostate cancer is infrequent before the age of 50, the ASR show exponential growth until the age of 70; then stabilize around the value reached at this age.
General mortality
During the 2011-2020 decade, 127,797 deaths occurred in Cali (Table 2). 72% (91,813) were caused by non-communicable chronic diseases (Group II), 12% (15,567) by communicable diseases (Group I) and 15% (19,422) for injuries (intentional and non-intentional, Group III).
Table 2 Cali. Colombia. Mortality rates standardized by age (World Population) per 100,000 person-year and the annual percentage change (APC) by sex during the period 2011-2020
| Site | 2011-2015 | 2016-2020 | APC | Code ICD 10 | |||||||||
|---|---|---|---|---|---|---|---|---|---|---|---|---|---|
| Male | Female | Male | Female | Male | Female | ||||||||
| n | ASR | n | ASR | n | ASR | n | ASR | APC | 95% CI | APC | 95% CI | ||
| Oral cavity and pharynx | 115 | 2.0 | 104 | 1.3 | 148 | 2.3 | 127 | 1.4 | -1.7* | (-2.4 ; -1.0) | 0.2 | (-0.7 ; 1.0) | C00-14 |
| Esophagus | 95 | 1.7 | 52 | 0.7 | 130 | 2.0 | 59 | 0.6 | -2.7* | (-3.4 ; -2.0) | -4.0* | (-4.9 ; -3.1) | C15 |
| Stomach | 807 | 14.4 | 659 | 8.2 | 928 | 14.4 | 703 | 7.5 | -2.1* | (-2.4 ; -1.9) | -2.4* | (-2.8 ; -2.1) | C16 |
| Colon and rectum | 570 | 10.2 | 606 | 7.5 | 644 | 10 | 770 | 8.1 | 1.7* | (1.2 ; 2.2) | 0.6* | (0.1 ; 1.1) | C18-21 |
| Liver | 316 | 5.7 | 372 | 4.5 | 366 | 5.7 | 360 | 3.6 | -0.2 | (-0.7 ; 0.2) | -1.8* | (-2.3 ; -1.2) | C22 |
| Pancreas | 252 | 4.5 | 300 | 3.7 | 345 | 5.4 | 430 | 4.5 | 0.2 | (-0.4 ; 0.9) | -0.3 | (-0.9 ; 0.3) | C25 |
| Bronchi and lung | 799 | 14.4 | 602 | 7.3 | 839 | 13.1 | 654 | 6.7 | -1.8* | (-2.1 ; -1.5) | -1.0* | (-1.3 ; -0.6) | C34 |
| Skin melanoma | 152 | 2.7 | 126 | 1.6 | 168 | 2.6 | 152 | 1.6 | 1.8* | (1.1 ; 2.6) | 1.0* | (0.1 ; 1.9) | C43-44 |
| Breast | 7 | 0.1 | 1,054 | 13.8 | 7 | 0.1 | 1,310 | 14.9 | ~ | 0.2 | (-0.2 ; 0.5) | C50 | |
| Cervix uteri | 486 | 6.5 | 516 | 6.0 | -3.5* | (-3.9 ; -3.2) | C53 | ||||||
| Corpus uteri | 138 | 1.9 | 223 | 2.5 | -1.2* | (-2.1 ; -0.3) | C54-C55 | ||||||
| Ovary | 302 | 4.0 | 403 | 4.6 | -0.5 | (-1.2 ; 0.2) | C56 | ||||||
| Prostate | 1,012 | 17.4 | 1,114 | 17.1 | -0.1 | (-0.5 ; 0.3) | C61 | ||||||
| Bladder | 113 | 2.0 | 75 | 0.9 | 141 | 2.2 | 67 | 0.6 | -0.9* | (-1.8 ; -0.1) | -2.6* | (-3.7 ; -1.6) | C67 |
| Lymphoma | 330 | 6.0 | 290 | 3.7 | 423 | 6.6 | 355 | 3.9 | -0.3 | (-0.8 ; 0.3) | -0.9* | (-1.5 ; -0.4) | C81-C90.C96 |
| Leukemia | 270 | 4.6 | 246 | 3.5 | 285 | 4.5 | 271 | 3.2 | -0.7* | (-1.2 ; -0.2) | -1.1* | (-1.8 ; -0.3) | C91-95 |
| Other sites | 1,193 | 21.0 | 1,333 | 17.2 | 1,452 | 22.7 | 1,520 | 16.7 | -0.4* | (-0.7 ; -0.1) | -1.1* | (-1.4 ; -0.9) | ** |
| All sites | 6,034 | 106.7 | 6,746 | 86.1 | 6,992 | 108.7 | 7,921 | 86.1 | -0.7* | (-0.9 ; -0.5) | -1.1* | (-1.3 ; -0.9) | C00-C97 |
Number of cases (n).
ASR: Mortality rate standardized by age (ASR).
APC: Annual Percent Change. APC is calculated for the period 1984-2020.
* The APC is significantly different from zero (p <0.05). ~ APC could not be calculated
** C17. C23. C24. C26-C32. C37-C41. C45-C49. C51. C52. C57-C60. C62-C66. C68-C80. C97
The causes of death vary with age; in children, group I diseases predominate; in adolescents and young adults under 40 years of age, injuries (internal and external); and from the fifth decade on, chronic non-communicable diseases. Between the ages of 30 and 60, cancer is more common; and from the eighth decade on, cardiovascular diseases predominate (Figure 4).
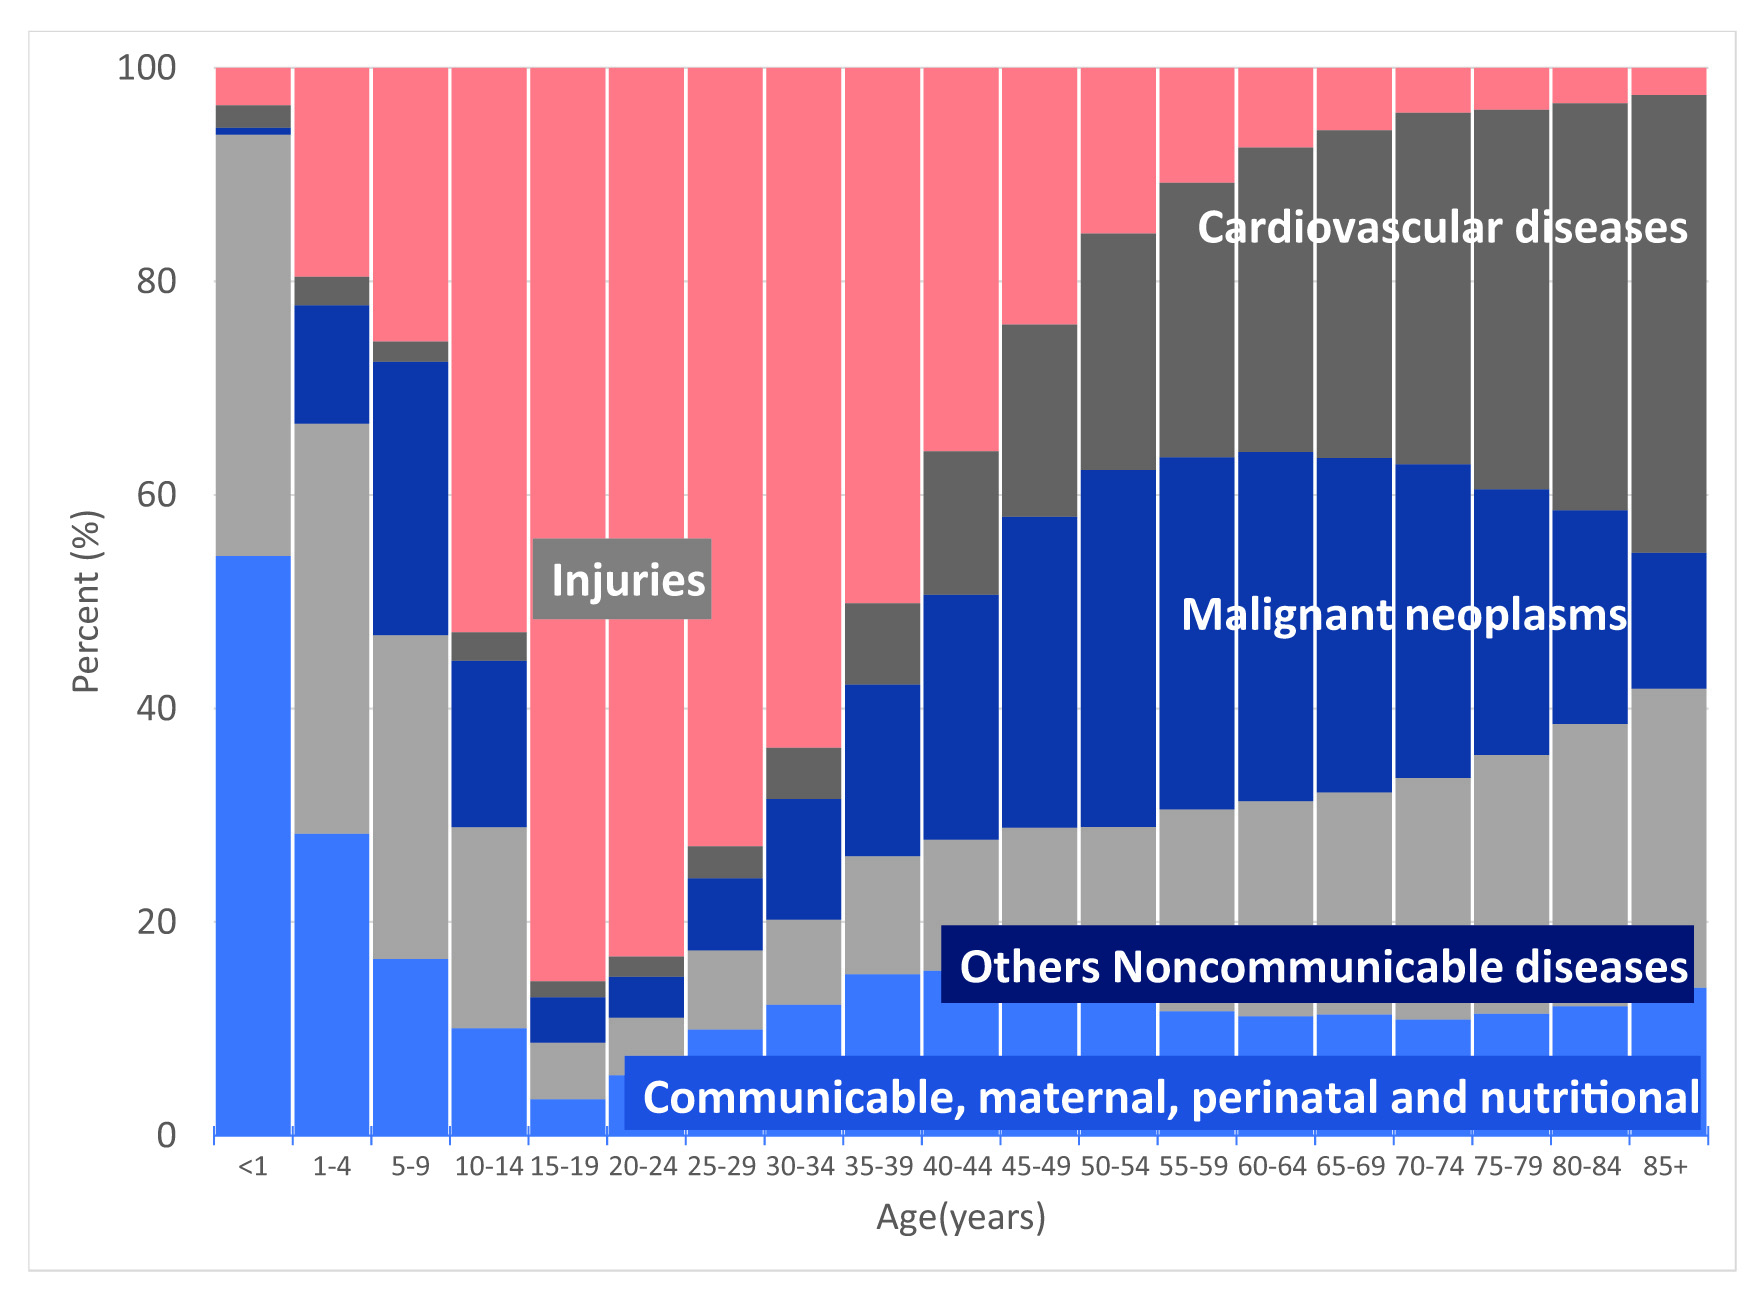
Figure 4 Cali, Colombia. Frequency distribution by age of causes of mortality grouped by categories defined by WHO, 2011-2020. WHO: World Health Organization. Group I: Communicable, maternal, perinatal and nutritional. Group II: Non-communicable chronic diseases (Cancer, cardiovascular and others). Group III: Injuries (intentional and non-intentional)
Cancer mortality (2011-2020)
The 27,693 deaths from cancer that occurred during the decade represented 19.7% of global mortality, and 30.2% of mortality from chronic non-communicable diseases. 53% of cancer deaths occurred in women; 37% in adults (15-64 years); 62% in those aged over 64 years; and 0.8% in children (0-14 years). The incidence mortality ratio was 0.56.
Table 2 shows the number of deaths and mortality rates from cancer according to age, sex and period during the decade 2011-2020. Although the number of deaths was higher in women, the standardized cancer mortality rates per 100,000 person-years for all locations were higher in men, 108.7; that in women 86.1 (period 2016-2020).
During the 2016-2020 period, in men, the five main sites of death from cancer were prostate (ASR: 17.1), stomach (ASR: 14.4), lung (ASR: 13.1), colon and rectum (ASR: 10.0), and lymphomas (ASR: 6.6). In women, the main causes of death were breast cancer (ASR: 14.9), followed by colon and rectal cancer (ASR: 8.1), stomach (ASR: 7.5), lung (ASR: 6.7) and cervix (ASR: 6.0).
Changes in morbidity and mortality
Table 3 shows the trend analysis of incidence (ASR-W-I) and mortality (ASR-W-M) rates for the period 1962-2017, and 1984-2020, respectively. The APC represents the average annual percentage change in rates. Increase or decrease was defined when the APC was significantly different from zero (two-tailed values p <0.05); otherwise, it was considered a stable or flat rate. The information on the age-standardized incidence rates for the period 1962-2017 and the mortality rates for the period 1984-2020 are described in supplementary tables 2S and 3S.
Table 3 Cali, Colombia. Annual percentage change (APC) in incidence (1962-2017) and mortality (1984-2020) by sex.
| Site | Mortality | Code ICD 10 | |||||||
|---|---|---|---|---|---|---|---|---|---|
| Male | Female | Male | Female | ||||||
| APC | 95% CI | APC | 95% CI | APC | 95% CI | APC | 95% CI | ||
| Oral cavity and pharynx | -1.0* | (-1.3 ; -0.6) | -1.0* | (-1.5 ; -0.6) | -1.7* | (-2.4 ; -1.0) | 0.2 | (-0.7 ; 1.0) | C00-14 |
| Esophagus | -1.5* | (-2.1 ; -0.8) | ~ | -2.7* | (-3.4 ; -2.0) | -4.0* | (-4.9 ; -3.1) | C15 | |
| Stomach | -1.9* | (-2.1 ; -1.8) | -1.9* | (-2.2 ; -1.7) | -2.1* | (-2.4 ; -1.9) | -2.4* | (-2.8 ; -2.1) | C16 |
| Colon and rectum | 2.2* | (1.9 ; 2.5) | 1.6* | (1.3 ; 1.9) | 1.7* | (1.2 ; 2.2) | 0.6* | (0.1 ; 1.1) | C18-21 |
| Liver | 1.8* | (1.2 ; 2.4) | 0.6 | (-0.1 ; 1.3) | -0.2 | (-0.7 ; 0.2) | -1.8* | (-2.3 ; -1.2) | C22 |
| Pancreas | ~ | 0.0 | (-0.4 ; 0.3) | 0.2 | (-0.4 ; 0.9) | -0.3 | (-0.9 ; 0.3) | C25 | |
| Bronchi and lung | -1.0* | (-1.5 ; -0.6) | 0.0 | (-0.5 ; 0.5) | -1.8* | (-2.1 ; -1.5) | -1.0* | (-1.3 ; -0.6) | C33-34 |
| Skin melanoma | ~ | 0.4 | (-0.2 ; 1.0) | 1.8* | (1.1 ; 2.6) | 1.0* | (0.1 ; 1.9) | C43 | |
| Breast | 1.1* | (0.9 ; 1.4) | 0.2 | (-0.2 ; 0.5) | C50 | ||||
| Cervix uteri | -3.1* | (-3.3 ; -2.9) | -3.5* | (-3.9 ; -3.2) | C53 | ||||
| Corpus uteri | 0.2 | (-0.2 ; 0.5) | -1.2* | (-2.1 ; -0.3) | C54-C55 | ||||
| Ovary | -0.5* | (-0.8 ; -0.1) | -0.5 | (-1.2 ; 0.2) | C56 | ||||
| Prostate | 2.1* | (1.5 ; 2.7) | ~ | -0.1 | (-0.5 ; 0.3) | C61 | |||
| Bladder | -0.9* | (-1.3 ; -0.5) | -1.4* | (-1.9 ; -0.8) | -0.9* | (-1.8 ; -0.1) | -2.6* | (-3.7 ; -1.6) | C67 |
| Thyroid | 1.9* | (1.1 ; 2.7) | 2.9* | ( 2.6 ; 3.3) | -0.8 | (-1.9 ; 0.4) | -1.2* | (-2.2 ; -0.1) | C73 |
| Lymphoma | 1.0* | (0.6 ; 1.3) | 1.1* | (0.6 ; 1.6) | -0.7* | (-1.3 ; 0.0) | -1.5* | (-2.2 ; -0.9) | C81-C88, C96 |
| Leukemia | 0.8* | (0.4 ; 1.1) | -0.7* | (-1.2 ; -0.2) | -0.7* | (-1.2 ; -0.2) | -1.1* | (-1.8 ; -0.3) | C91-95 |
| Other sites | 0.4* | (0.2 ; 0.7) | -0.2 | (-0.4 ; 0.0) | -0.4* | (-0.7 ; -0.1) | -1.1* | (-1.4 ; -0.9) | ** |
| All sites¶ | 0.4* | (0.2 ; 0.6) | -0.2* | (-0.3 ; 0.0) | -0.7* | (-0.9 ; -0.5) | -1.1* | (-1.3 ; -0.9) | C00-C97 |
APC: Annual Percent Change. APC is calculated for the period: 1962-2017 (Incidence) and 1984-2020 (Mortality).
* The APC is significantly different from zero (p <0.05).
**C17, C23, C24, C26-C32, C37-C41, C45-C49, C51, C52, C57-C60, C62-C66, C68-C80, C97
¶ Mortality included C43-44: Melanoma and other skin
Trends in incidence rates 1962-2017
During the period 1962-2017, the sex-specific cancer incidence rate for all locations showed a divergent trend. In men, it increased with an annual average of 0.4% (95% CI: 0.2, 0.6); in women, it decreased with an annual average of 0.2% (95% CI: -0.3; -0.1).
In men and women there was a reduction in the incidence rates of cancers of the oral cavity and pharynx, stomach, gallbladder, bladder, and Hodgkin's disease. Cancer of the esophagus, lung and larynx decreased in men; and ovarian and cervical cancer in women.
Incidence rates remained stable in women with cancers of the liver, pancreas, lung, bone, soft tissue tumors, melanoma of the skin, and uterine corpus. In men, there were no changes in myelomonocytic leukemia.
In men and women, increased incidence rates were found for cancers of the kidney, renal pelvis and urethra; colorectal, central nervous system and thyroid. Breast cancer and myelomonocytic leukemia increased in women. In men, cancer of the prostate, testicle, liver, bone, and lymphocytic leukemia.
Trends in mortality rates
Age-standardized cancer mortality rates (TM) for all locations for the 1984-2020 period decreased steadily, with an annual average of 0.7% in men (95% CI: -0.9, -0.5), and 1.1% in women (95% CI: -1.3, -0.9).
For both sexes, there was an increase in mortality rates from colorectal cancer and melanomas; and decreased TMs for malignant tumors of the esophagus, stomach, lung, bladder, lymphomas, and leukemias. In men, the TM due to oral cavity cancer decreased; in women the TM due to cervical and uterine corpus cancer also decreased.
Pancreatic cancer mortality rates remained stable in both sexes. They also remained the same (remained unchanged) for malignant tumors of liver, prostate and thyroid in men; and in the oral cavity, breast and ovary in women.
Changes in trend
Tumors associated with infectious agents
The incidence and mortality rates for cervical and stomach cancer decreased during the evaluated period (Figure 5). In cervical cancer, there was a change in the trend of incidence and mortality rates around 2002 and 2005, respectively. Before 2002, the incidence rate decreased with a mean annual change of 2.8% (95 CI: -3.1, -2.5); and then accelerated to 4.6% (CI95: -5.6, 3.5). In contrast, the trend in mortality rates showed a slowdown; before 2005, the mean annual decrease was 4.4% (95% CI: -5.2, -3.7); then, it decreased to 2% (95% CI: -3.2, -0.8).
Stomach cancer mortality rates in both sexes, and incidence rates in men decreased monotonously (Figure 5). The mean annual decrease in mortality rates was 2.4% (95% CI: -2.8; -2.1) in women; and 2.1% in men (95% CI: -2.2, -1.8).
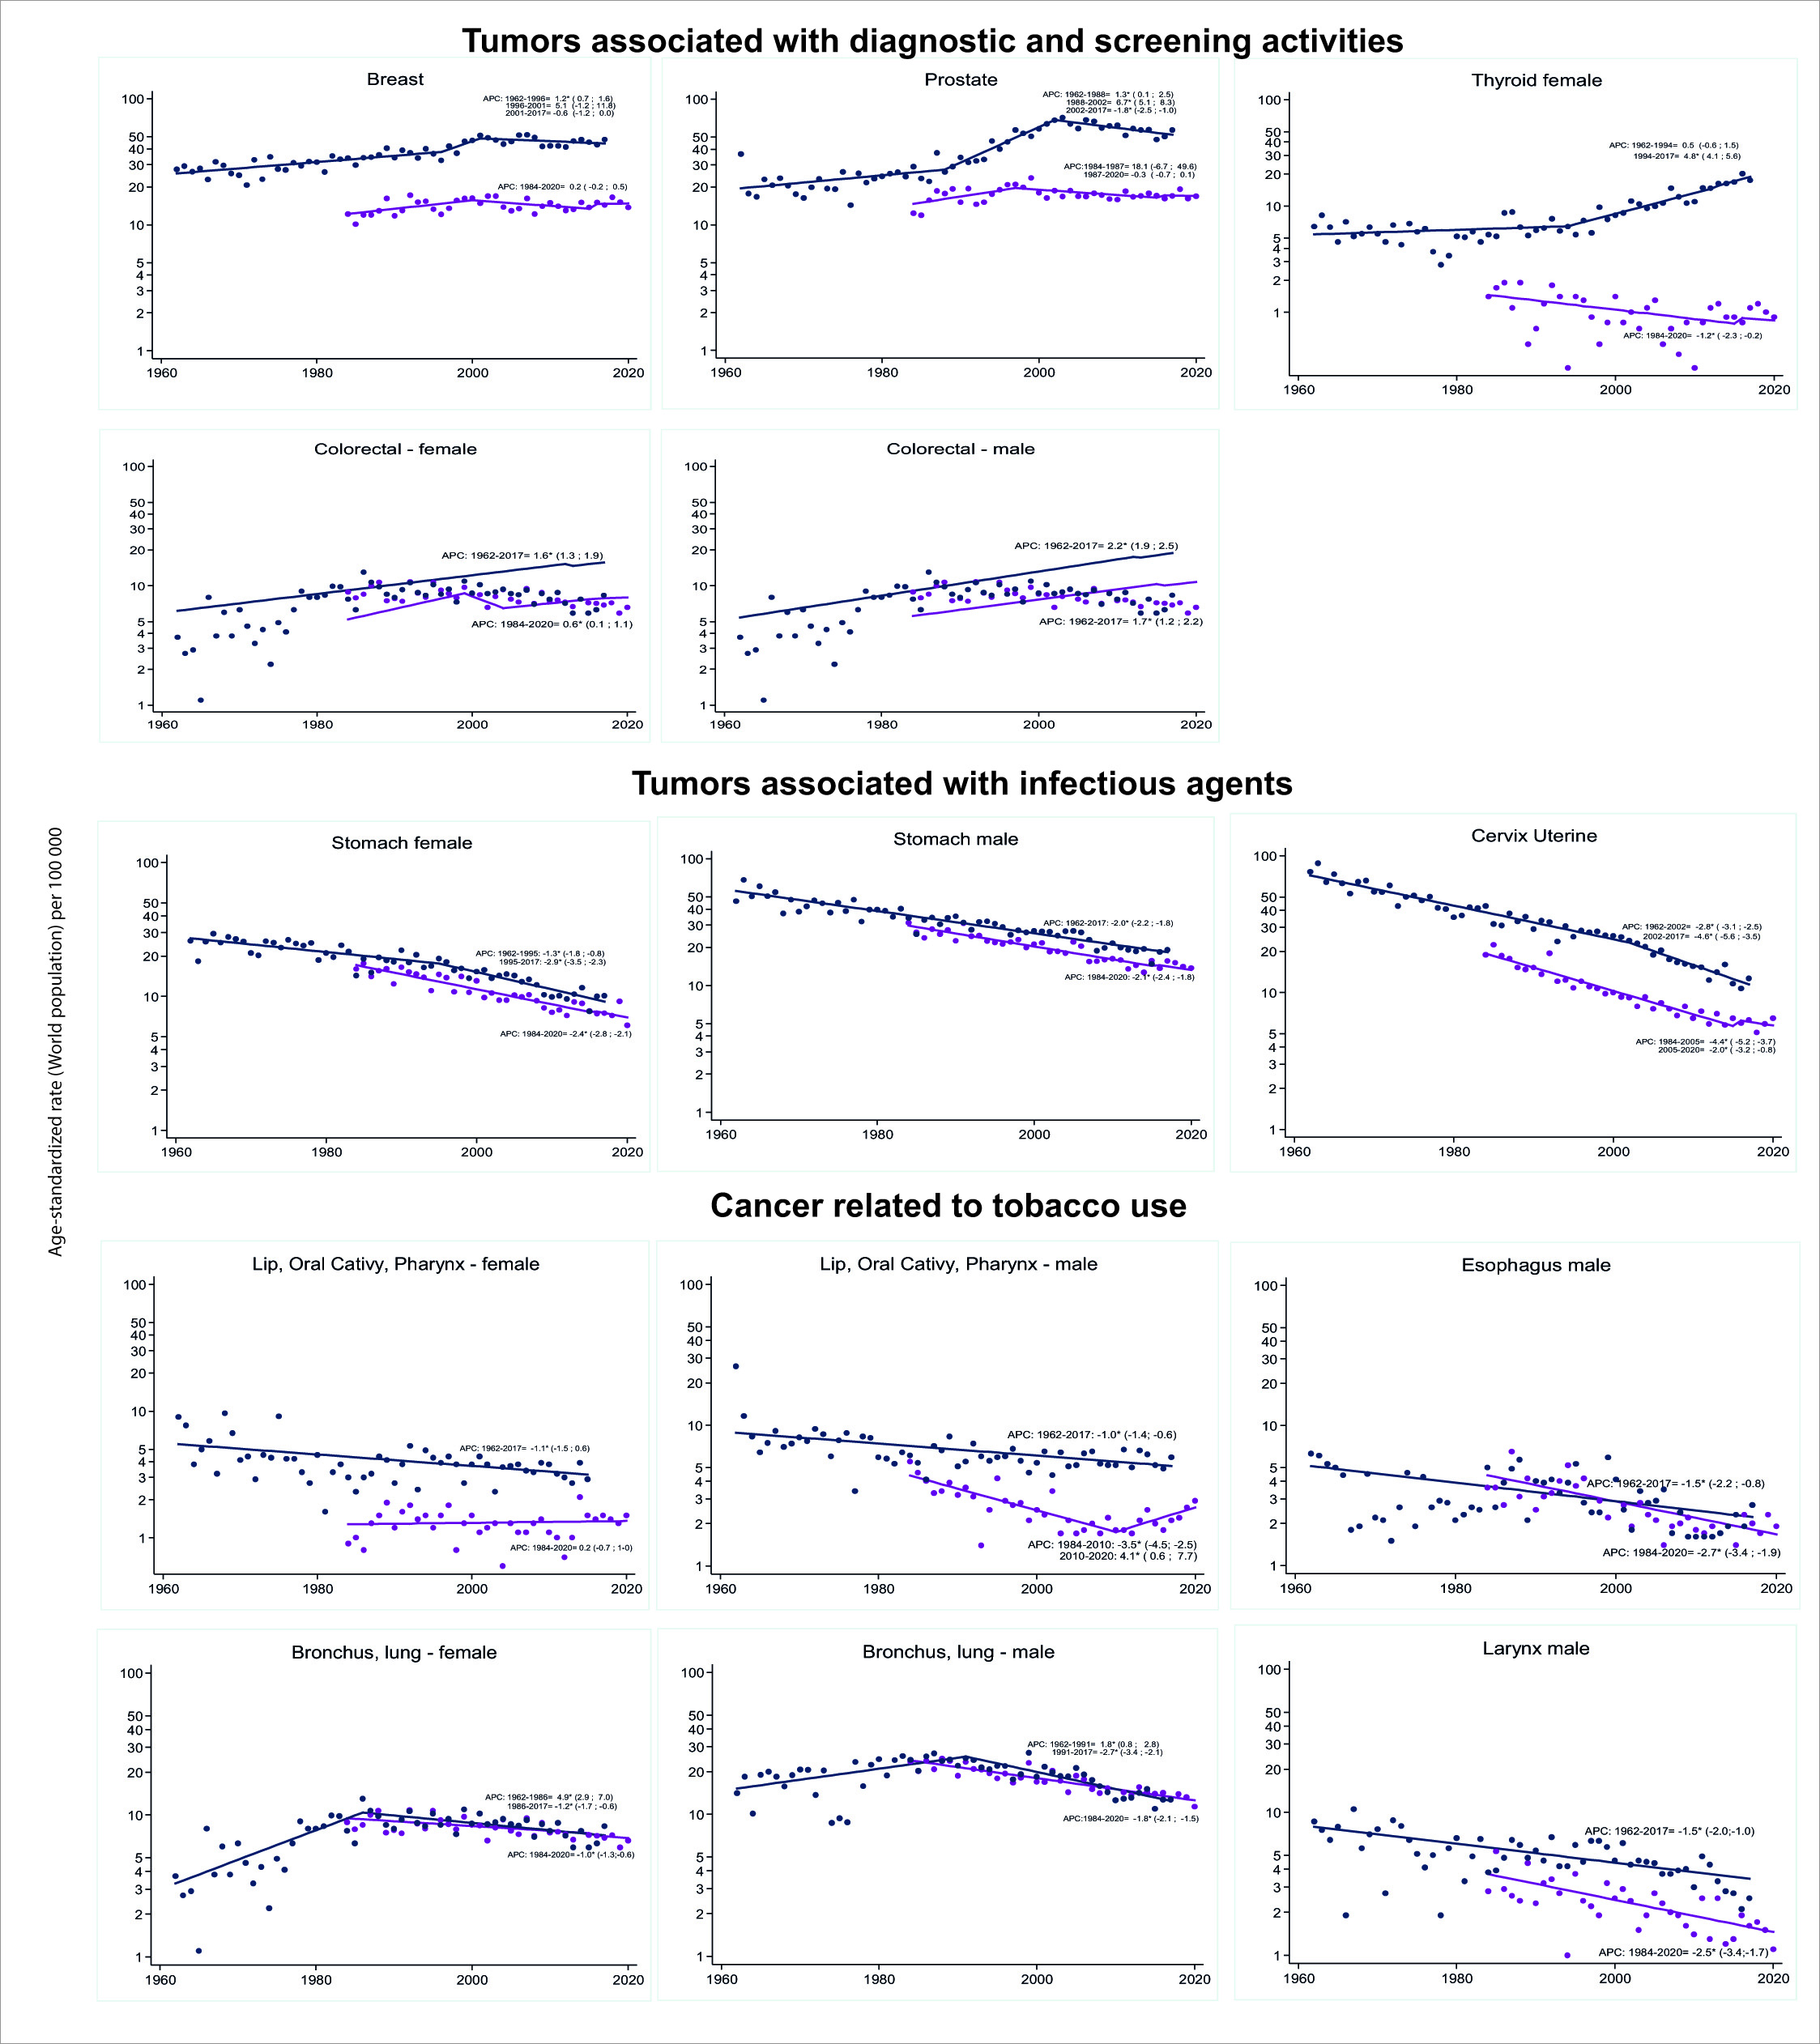
Figure 5 Cali, Colombia. Trends in cancer incidence rates (1962-2017) and cancer mortality rates (1986-2020).
The mean annual decrease in stomach cancer incidence rates in men was 2% (95% CI: -2.2, -2.8). In women, there was a point of change in the trend around 1995. Before this year, the mean annual decrease was 1.3% (95% CI: -1.8, -0.8); afterwards, it increased to 2.9% (95% CI: -3.5, -2.3).
Tumors associated with diagnostic and screening activities
Breast cancer:
Two points of change in the trend of incidence rates occurred around the years 1996 and 2001, which determined three periods. Until 1996, incidence rates increased on average 1.3% annually (95% CI: 0.1, 2.5). Then, there was an acceleration of the change and the increase was 5.1% (CI95%: -2; 11.8) until 2001. Since then, there has been a mean annual decrease of 0.6% (CI95%: -2; 0) (Figure 5). The death rate showed a change around 2005.
Prostate cancer:
The behavior was similar, with two points of change in the trend of incidence rates around the years 1988 and 2002, which determined three periods. Until 1988, the incidence rates increased on average 1.3% annually (95% CI: 0.1, 2.5); then, growth accelerated to 6.7% per year (95% CI: 5.1, 8.3). Since 2002, there has been a mean annual decrease of 1.8% (95% CI: -2.6, -1) (Figure 5).
Mortality rates showed a change in trend around 1987; before, the mean annual increase was 18% (95% CI: -6.5, 49.6). Then, the trend reversed, and there was a mean annual decrease of 0.3% (95% CI: -0.7, 0.1).
Colorectal Cancer:
Colorectal cancer incidence and mortality rates increased monotonously in both sexes; the magnitude of the increase was greater in males. In women, the incidence and mortality rates had a mean annual increase of 1.6% (95% CI: 1.3, 1.9) and 0.6% (95% CI: 0.1, 1.1); and in men, the mean annual increase was 2.2% (95% CI: 1.9, 2.5) and 1.7% (95% CI: 1.2, 2.2), respectively (Figure 5).
Thyroid cancer: Incidence rates showed a change in trend around 1994, which determined two growth periods with a mean annual increase of 0.5% (95% CI: -0.6, 1.5) and 4.6 % (95% CI: 4.1, 5.6). In contrast, mortality rates showed a mean annual decrease of 1.2% (95% CI: -2.3, -0.2) (Figure 6).

Figure 6 A. Cali, Colombia. Trends in thyroid cancer incidence rates by sex and type of tumor morphology (1962-2017). The trend in thyroid cancer incidence rates differs according to the histological type. Papillary carcinomas have increased, especially in women. Follicular and anaplastic carcinomas have decreased over time. B. Cali, Colombia. Changing patterns of gastroesophageal junction cancer, 1962-2017. Incidence rates for proximal esophagus and distal stomach cancers have decreased since the 1960s. The incidence rates for gastroesophageal junction cancer have increased since 1970.
Cancer related to tobacco use
Table 3 shows decreased incidence and mortality rates for esophageal, bronchial and lung cancer, and bladder cancer in both sexes. The TM of laryngeal and oral cavity cancer decreased only in men (Figure 5).
In cancer of the trachea, bronchi and lung, there were changes in the trend of incidence rates around 1986 in women, and 1991 in men, which determined two periods of divergent trend. Before 1986 and 1991, incidence rates increased by an annual average of 1.8% (95% CI: 0.8, 2.8) and 4.9% (95% CI: 2.9, 7) in men and women, respectively. After these dates, there was a mean annual decrease of 2.7% (95% CI: -3.4, -2.1) in men, and 1.2% (95% CI: -1.7, -0.6) in women (Figure 5).
The decrease in lung cancer mortality rates was monotonous in both sexes, with a mean annual change of 2.7% (95% CI: -3.4, -2.1) in men, and 1.2% (95% CI %: -1.7; -0.6) in women (Figure 5).
Quality indicators
Supplementary Table 4S presents the quality indicators for new cases in selected locations for the period 2013-2017; the age is known for almost 100% of the cases. For all cancer sites, the percentage of cases with morphological verification (MV) was 86.1% in men and 88.8% in women, with a range of 80-99%, except in the liver (75.4% in men. and 73.1% in women), lung (67.3% in men and 69.7% in women), and pancreas (58.7% in men and 59.4% in women).
Consistent values are observed in the mortality incidence ratio, except for liver (1.26 in men and 1.47 in women), lung (1.09 men and 1.05 women), and pancreas (1.06 men and 1.08 women). In these locations, the number of deaths was greater than the number of cases detected in life.
The percentage of cases with a death certificate as the only evidence of cancer diagnosis (DCO) varied between 0-3%, except in pancreas (8.1% in men), liver (6.4% in women), bladder (5.1% in women) and lung (5.1%). The most frequent locations present a low percentage of cases with a death certificate as the only evidence of a cancer diagnosis.
For the period 2011-2020, 99.9% of deaths were certified by a doctor; the proportion of cancers with a poorly defined site (C76-C80, C97) was 4.8%, and 0.8% for unspecified uterine cancer (C55). Only 2 (0.007%) of the death certificates did not have age information. The proportion of deaths classified as ill-defined signs, symptoms, and causes (R00-R99) was 0.9%.
Discussion
Population-based cancer registries are an indispensable tool for cancer control 12. In Cali, the cancer registry operates since 1962, providing valid and continuous information on new cases of all types of cancer, in permanent residents of Cali, through active search and notification. This article complements the changes observed in the temporal trends of cancer incidence and mortality rates in Cali over 60 years 14,36. This information can be used by regional and national health authorities to build some indicators in order to monitor the City Cancer Challenge initiative 37,38 and the current 10-year plan for cancer control in Colombia (PDCC) 22.
In other regions of Latin America there is difficulty in evaluating interventions for cancer control due to the lack of quality information 39; and because there is inequity in the coverage of the cancer registry. In Africa, Asia, and Latin America, the coverage of high-quality cancer registries is less than 9% of the population. In contrast, the equivalent coverage in North America and Europe is 83% and 32%, respectively. To narrow this gap and improve the quality of cancer registries in low- and middle-income countries, the Global Initiative for Cancer Registry Development (GICR) seeks to build local and sustainable infrastructure by establishing regional centers of expertise 40.
Keys to the success of the Cali cancer registry
Colombia, with its Cali cancer registry, is part of a select group of 17 cancer registries from twelve countries that have disseminated quality information on cancer incidence for half a century in the eleven volumes of Cancer Incidence in Five Continents. The other countries are Japan, Israel, Denmark, Finland, Slovenia, Norway, Sweden, New Zealand, the United Kingdom, the United States, and Canada 41.
Several factors have been determining factors in guaranteeing the continuity of the RPCC's operations. The permanent support of Universidad del Valle as a sponsor; a clear definition of cancer case, registry area and population at risk; and the implementation of standard methods to guarantee quality 27. In the Colombian model, it has been successful for cancer registries to be linked to university academic centers with the support and partial funding of the Municipal Health Secretariats and the National Cancer Institute of Colombia 42.
In addition, universities favor the sustainability of the work team and facilitate the formulation of research projects to solve specific problems in the environment. The RPCC has been directed by research professors from the Pathology Specialization Program of the Universidad del Valle. The University and the graduate program have high quality accreditation before the Colombian Ministry of Education 43. In the Faculty of Health, dozens of graduate students have done their graduate work; and undergraduate students have participated in the periodic (five-year) survey carried out by the cancer registry of the city's oncology services, which aims to improve comprehensiveness. The 75 pathologists who graduated from the program during the last half century constitute a formidable support network for the cancer registry because they currently direct the high and medium complexity pathology laboratories in Cali; and as university professors, they contribute to the training of human talent in health in the six universities of the city.
Cali: Interpretation of changes in cancer trends
The data presented here may reflect many events and trends that are taking place today in many Latin American countries. In Cali, during the 2013-17 five-year period, global cancer incidence rates increased for all locations in men, APC = 0.4 (95% CI: 0.2, 0.6); and they decreased in women, APC = -0.2 (95% CI: -0.3, -0.1). Cancers of the prostate, stomach, lung, colorectal and hematolymphoid were the most common in men (55.4% of cases); in women, they were breast, colorectal, thyroid, cervix, stomach and hematolymphoid (64.4% of cases). Cancer represents 23% of the 6,4851 deaths that occurred in Cali during the 2016-2020 period. Changes in demographics, lifestyles, and in known risk factors determine variations in cancer trends that are reflected in the information presented here.
Interpretation of changes in cancer incidence and mortality trends focuses on breast, cervical, stomach, prostate, and colorectal; prioritized by the current PDCC 2011-2021; and in cancers related to tobacco use. The role of the RPCC in the identification and resolution of public health problems of cancers related to infectious agents (stomach and cervix) is described through specific transdisciplinary research projects that have allowed the social appropriation of knowledge.
Changes in population and risk factors
Cali is an immigration center in southwestern Colombia. The population has quadrupled in the last 60 years; and today, there are 48 persons older than 65 years for every 100 persons aged under 15; 95% of the people live in urban areas. Fertility rates fell to figures slightly below what is known as the replacement level (2.05 children per woman); and life expectancy increased to 76 years; this average is equivalent to that of high-income countries, 25 years ago 16,44.
In Colombia, the burden of morbidity and mortality has changed from a predominance of infectious diseases to an increasing contribution of chronic, non-communicable diseases. This epidemiological and demographic dynamic transforms the age structure due to population growth and aging. As in other Latin American countries, there are changes in lifestyle associated with urbanization, increased income, altered social and family structures, and more sedentary daily activities and occupations; these changes modify exposure to risk factors. Alcohol consumption and excess body weight, through changes in diet and physical activity, are established carcinogens 45. Other known factors are unprotected sex, air pollution, indoor smoke and contaminated injections; they account for 35% of cancer deaths worldwide 46,47. The main etiology for some types of cancer is still unknown. Genetics, obesity and some dietary regimens have been related with breast, prostate and colon cancer. Only few proportions of prostate cancer has been described having a relationship with black race.
Hormone-dependent cancers associated with screening
The tumor cells of breast cancer and prostate cancer are hormone-dependent and require estrogens and testosterone for growth. Mammography and digital rectal examination plus serum PSA detection are used in population screening programs for these tumors. Increasingly improved imaging tests plus population screening of asymptomatic people may detect indolent cancers with limited or no growth for long periods of time that will not result in patient death. As a result, there will be overdiagnosis and overtreatment as a consequence of tumor non-progression or competitive mortality due to other causes. It is imperative to develop, for each type of cancer, specific biomarkers for diagnosis, prognosis, therapeutic targets, and to predict the biological behavior of tumors.
Prostate cancer
In Cali, 30% of the population self-recognize as Afro-Colombian ethnicity. Prostate cancer incidence rates increased over the past 60 years, rapidly between 1986 and 2002 11,48, reached a plateau around 2005, and then declined over the past decade. Once the use of screening tests has stabilized, the rates will tend to stabilize in the coming years, as has happened in countries with a high human development index (HDI). To interpret the trends in the incidence and mortality rates for prostate cancer, it is necessary to take into account early detection activities, and that there are known risk factors in the etiology of prostate cancer (age, racial group and family history); while there are others that seem to be associated, but without robust evidence, such as diet and obesity 5,6.
The increase was greater in the age group screened with PSA. Similar changes have occurred in Europe, North America, and Australia; and are associated with serum PSA determination as a screening test and with new diagnostic methods (like obtaining sextant biopsies using fine needles guided by transrectal ultrasound) and treatment. Transurethral resection and minimally invasive procedures have modified urological practice, and the tissues obtained are taken for histopathological review and cancer may present as an incidental finding.
Detection of all prevalent cases is inefficient for prostate cancer control, because the frequency of prostate cancer increases with age; and in step-section autopsy specimens, it ranges from 68% to 77% for men aged 60 to 79 years 49. Current screening methods do not differentiate between indolent and aggressive cancers. To optimize the population screening of prostate cancer, it is urgently needed the development of biomarkers that detect aggressive forms of the disease, in order to avoid overdiagnosis and overtreatment of patients.
Breast cancer
In Cali, as in most countries in the world, breast cancer incidence rates increased 5.1% annually from the nineties to the beginning of the 21st century, (95% CI: -1.2, 11.8). This increase coincided with decreased fertility, younger menarche, older age of first term pregnancy, use of postmenopausal hormone replacement therapy, and increased opportunity screening activities with mammography. Since 2005, the curve stabilized for a short period; and in the last decade, there was a reversal of the trend with a decrease of 0.6% per year in incidence rates (95% CI: -1.2, 0.0). This pattern of change was more evident in the population subjected to screening, 50-69 years, and part of the increase may be concentrated in cases with early stages of the disease. Once the use of screening tests has stabilized, breast cancer incidence rates tend to stabilize, as long as other factors causing the disease have not changed 15,50,51.
It is the first time that this trend pattern has been documented in a Latin American cancer registry. The decrease in the risk of breast cancer was observed 20 years ago in high-income countries, coinciding with the decrease in the use of hormones for menopausal therapy and the saturation of screening activities 50,52.
Although the incidence rates of breast cancer have increased in the course of the last decades, the values are low in relation to the notorious demographic changes in Cali (with a considerable increase in life expectancy). 30% of the population of Cali recognize themselves as Afro-Colombian. The incidence of breast cancer is six times lower in Afro-descendant women, compared with other ethnic groups. Breast cancer incidence rates in Uganda and Algeria have doubled in recent years, but it is much lower than in Afro-descendant women in the US and other Western countries. Other sociodemographic and biological determinants of the difference in breast cancer risk between high- and low-income countries remain to be clarified 53.
In Europe, Central Asia and North America, breast cancer mortality has decreased by around 20% (95% CI: 11; 27) due to advances in treatments and early detection by mammographic screening. In the other regions of the world, including Africa and Latin America, mortality rates have increased 0.23% per year (95% CI: 0.20, 0.25) during the last 27 years, due to increases in incidence rates and because the diagnosis is made at a late stage, due to the lack of population screening programs, as well as the barriers to cancer treatment and care 54,55.
Cali shows progress in the control of breast cancer; mortality has remained stable during the last 30 years, despite the increase in incidence rates, because opportunistic screening activities have contributed to detecting cases in less advanced stages 14,15. As in all low- and middle-income countries. Survival from breast cancer in Cali is still low; for the 2013-2017 five-year period, it was 81.1% (95% CI: 78.7; 83.3), nine percentage points lower than that observed in the United States and Europe 51.
Low-to-middle income countries have difficulties in establishing organized population screening programs, because they lack the financial resources to train the required human talent and implement the efficient infrastructure to detect and treat detected cancer cases in a timely and adequate manner 56. To reduce the burden of disease, we must increase healthy behaviors, because 20% of breast cancers worldwide are due to modifiable risk factors, including alcohol consumption, excess body weight and physical inactivity. Although the evidence is limited, breast examination in women in low- and middle-income countries has shown that can reduce the stage of breast cancer at the moment of doing the diagnosis 54.
Colorectal cancer
Colorectal cancer is considered a marker of human development. The ASRs are at least six times higher in countries with very high HDI compared to countries with low HDI, probably related to changes in the prevalence of risk factors linked to Western lifestyles: increased consumption of red meat and processed foods, refined carbohydrates, alcohol and tobacco consumption, obesity, and physical inactivity 57.
In Colombia, the Human Development Index (HDI) in 2019 was 0.767 points, which represents an improvement of 0.164 points compared to 1990 58. Coinciding with this increase, in Cali, the incidence rates of colorectal cancer (ASR/100,000) almost tripled, they went from 6.6 in 1964 to 17.3 in 2017; the same happened with mortality rates. However, incidence rates continue to be lower than those observed in countries with a very high HDI (United States (36) and United Kingdom (38.3)) 59. During the last 60 years, the incidence and mortality rates for CCR in Cali increased an annual average of 2.2% (95% CI: 1.9; 2.5) and 1.7% (95% CI: 1.2; 2.2), respectively. In contrast, countries with high HDI have evidence of CCR control, because premature mortality from CCR is avoidable; and since 1985 and 1976, there has been a significant decrease in incidence and mortality rates, respectively.
In Cali, the 5-year net survival of the CCR was lower than that reported by the SEER program, 54% vs 64.7%. This 10-point gap highlights the deficiencies of health services for risk control, early detection and comprehensive treatment of patients with CCR. Taking into account the upward trend in the incidence and mortality of the disease, it is a priority to strengthen opportunity screening activities in small Colombian cities; and to establish a population screening program in large capital cities in order to guarantee timely and quality access to the diagnosis and treatment of patients with this disease.
Cancers related to tobacco use
In Cali there was a turning point in the trend of lung cancer incidence rates around 1986 in women, and 1991 in men. Before these years, incidence rates increased an annual average of 1.8% (95% CI: 0.8, 2.8) in men, and 4.9% (95% CI: 2.9, 7) in women. After these dates, there was a mean annual decrease of 2.7% (95% CI: -3.4, -2.1) in men and 1.2% (95% CI: -1.7, -0.6) in women, Figure 5. The trend in lung cancer incidence rates for both sexes in Cali can be interpreted as a reflection of a failed tobacco-related epidemic, which began in the 1960s and stopped in the 1980s. This phenomenon is related to a very strong campaign against smoking that has been carried out in Colombia since the 1970s 14. Incidence and mortality rates for other cancers related to tobacco use (esophagus, lung, and bladder) have also decreased in both sexes. Mortality rates for cancer of the larynx and oral cavity decreased only in men.
The causal association between lung cancer and smoking is well documented. Lung cancer is more common in men, but the gender gap has narrowed. Lung cancer incidence and mortality rates have been declining in men and increasing in women, globally. This can be explained by the decline in the prevalence of smoking in men, which was followed by an acceptance of smoking by women in many countries. Indoor exposure to cooking and heating fumes using charcoal or combustible materials in unventilated stoves could also increase the risk of lung cancer in populations of women who had a low level of smoking 60.
Social appropriation of knowledge. Public health problems are solved with research
In the 1960s, the RPCC identified that gastric and cervical cancer, now related to infectious agents, were the main cause of cancer morbidity and mortality in the Cali population. To resolve these concerns, it was created a research group that has persisted over time, providing valid information on the measures of cancer occurrence and solving the problems through specific research projects.
Gastric Cancer: Transdisciplinary Research
In the first publication corresponding to the period 1962-1966, the RPCC disclosed that 75% of the population of Cali were immigrants from other Colombian regions. The specific gastric cancer incidence rates by place of origin showed that the migrants from the Nariño Province, located in the mountainous regions of the southwestern Colombian Andes, had the highest rate of gastric cancer: more than three times higher than the of the natives of Cali, and five times higher than that of those born on coasts regions 61. Coinciding with the Inter-American study of mortality, more than 30% of the adults who died in Cali underwent autopsy and the presence of intestinal metaplasia in the gastric mucosa of 1,500 autopsies in adults was documented. The highest prevalence was found in immigrants from Nariño (58%), again three times higher than that of natives of Cali (19%) or those born on the coasts (21%) 61.
The investigations focused on Nariño during the last 50 years; the RPCC coordinated the fieldwork activities of the projects, and the successive directors of the RPCC were the principal investigators of the different investigations. In the 1970s, the detailed study of gastric biopsies led to the characterization of the stages of the precancerous process, called "the Correa cascade" 62. Histopathologic lesions represent the following sequential changes: chronic active gastritis, multifocal atrophy (glandular loss), intestinal metaplasia (complete and incomplete), and dysplasia; and dietary surveys show that populations at high risk of cancer have two things in common: excessive salt intake 63 and poor intake of fresh, unprocessed fruits and vegetables 64,65. In the eighties, the dynamics of the changes of the precancerous process were described, characterized by a slow progression, with multiple partial episodes of progression towards more advanced lesions and regression to less advanced lesions 66.
Since the 1990s, the hypothesis of n-nitroso compounds as determinants of gastric cancer has been reconsidered 67, and all efforts reoriented towards the investigation of the relationship between H. pylori and gastric cancer in Nariño, it has been documented that the infection begins in the first months of age 68 and reaches a prevalence of 50% at two years, and close to 90% at 9 years. In adults, serological methods show that the infection persists in more than 90% throughout life. Studies on the method of transmission concluded that the initial infection was related to the presence of infected older siblings in the home 69.
Applying the knowledge obtained during 30 years of research, a controlled clinical trial was conducted in Nariño, which documented a decrease in the frequency of precancerous lesions with antioxidant dietary supplements and antibiotics to eradicate H. pylori infection 70. This research demonstrated that the protective effect of being free of infection is only evident after 6 years of follow-up, and persists years after the intervention has ended 71. This primary prevention strategy through chemoprevention is an alternative to the discordant results and low cost-effectiveness of the early detection of gastric cancer in Latin America, and the unsuccessful efforts to obtain a vaccine against H. pylori70.
In the last 15 years, progress has been made in understanding the mechanisms of gastric carcinogenesis by dynamically integrating the epidemiological guideline with multidisciplinary teams of basic sciences 72-74. Some of the mechanisms of oxidative damage and genotoxicity caused by H. pylori infection were elucidated, and the ancestral origin of the bacterial strains was traced 75,76. The abrupt break in co-evolution between a bacterium and humans is shown to cause more damage than the known virulence factors of H. pylori77.
Cervical cancer
In the 1960s, the RPCC in the report for the period 1962-1966 published that cervical cancer was the leading cause of morbidity and mortality from cancer in Cali women 14. The Municipal Public Health Secretary implemented a program for the early detection of cervical cancer through the use of repeated cytology as a primary screening test, in order to make the definitive diagnosis and treatment 78. The quality control in the central reference laboratory of the Municipal Public Health Secretary was carried out by pathologists from the Universidad del Valle, who documented in in the mid-1980s that the risk of developing invasive carcinoma is at least 10 times higher in women not subjected to screening than in those subjected to screening 77. Invasive cancer incidence rates have consistently decreased over the last 60 years; and since 2000, they are lower than those of cervix cancer precursor lesions (Figure 7).

Figure 7 Cali, Colombia. Impact of Pap smear on cervical cancer risk. A. Cali, Colombia. Prevalence rates of vaginal citology screening (1964-1978). B-C. Compared with incidence rates of in situ and invasive carcinoma of the cervix uterine, trough 1964-2012. The risk of developing invasive carcinoma is at least 10 times greater in women non-screened than is screened women. A marked and steady and significant decline in incidence and mortality rates is observed trough 1964-2012. D. Breast cancer. The incidence rates increase steadily, more markedly after 1996, then decrease.
Around the 1990s, two events occurred in Cali that impacted the cervical cancer detection program. The Ministry of Health decentralized the cytology laboratory, which impaired quality control. With the health law reform, in 1993, the organized population screening program deteriorated and early cancer detection lost its vertical and centralized nature, becoming a set of opportunity screening activities carried out by insurers and their service networks, which have fragmented cancer care 79. These phenomena could explain why there is a slowdown in the decline in mortality rates in the second decade of the 21st century. Before 2005, the mean annual decrease was 4.4% (95% CI: -5.2, -3.7) and then it decreased to 2% (95% CI: -3.2, -0.8).
In the 1990s, Dr. Nubia Muñoz demonstrated the causal association between HPV and cervical cancer. The first population case-control studies on HPV and cervical cancer were conducted in Spain and Colombia, two countries with contrasting rates of cervical cancer, per 100,000 women per year; Spain with one of the lowest incidence values (5.7), and Cali with a high incidence (48.2) 80. The Cali Population Cancer Registry was essential in the identification of incident cases of cervical cancer diagnosed during the study period in this city. The results of these studies have been considered the first unequivocal molecular epidemiological evidence of the causal association between HPV and cervical cancer 81. The demonstration that infection with certain types of HPV is the main and necessary cause of CaCu, modified the primary prevention through the use of prophylactic vaccines against HPV in adolescents, and secondary prevention through the introduction of the HPV test as primary screening test 82,83.
In 2012, Colombia introduced the HPV vaccination program in schools, which reached a coverage of 90% of the target population during the first year. In 2014, some teenagers from a school in Carmen de Bolívar had a massive psychogenic reaction to vaccination. The government response to the crisis was late and inappropriate; by 2016, acceptance of the HPV vaccine among eligible girls decreased to 14% for the first dose, and 5% for the full cycle 84.
The Municipal Public Health Secretary of Cali, with an intra and intersectoral work strategy and with political commitment at the municipal and national level plus budgetary measures necessary to strengthen coverage, achieved by 2019 that the coverage reached 75% in the 9-year-old population with the first dose 85. Unfortunately, the Covid-19 pandemic interfered with the continuity of the HPV vaccination reactivation program.
In 2017, the RPCC evaluated the effect of vaccination on oral HPV-16 infection in high school students in Cali, by detecting HPV-16 DNA in samples from the oral cavity and throat of 1,784 high school students from both sexes, aged from 14 to 17 years, in 21 schools in the city. The students immunized with two doses had a reduction of 72% (CI95%: 0.07, 0.88) in the detection of HPV-16, in comparison with those not vaccinated 86.
Interaction of the Cali Cancer Registry with its environment
Due to Colombia's advances in cancer control and the strength of the RPCC, Cali was prioritized among hundreds of cities and was the first city in the world to implement the City Cancer Challenge (C/Can) initiative. The objective of C/Can is to expand coverage and improve the quality of cancer care in cities in low- and middle-income countries 37,38. Diagnostic pathology services are essential for cancer health systems, and the morphological verification of tumors is one of the main quality criteria in cancer registries; unfortunately, in low- and middle-income countries, there are limitations to implementing minimum quality standards in pathology laboratories.
To overcome the limitations above described, the Cali Cancer Registry worked closely with local health authorities and city pathologists to identify and implement sustainable solutions adapted to the local context. The RPCC actively participated in the implementation of the C/Can initiative and contributed to improve the resources and infrastructure of the pathology laboratory of the main state university hospital in the city (HUV). Based on the epidemiological profile of cancer in Cali, immunohistochemistry was implemented; and with the guidance of the American Society for Clinical Pathology (ASCP), a workshop was organized to improve the quality of pathology diagnosis, with the participation of pathologists and technologists in cytology and histology 87. After the workshop, a quality control manual was drawn up, which includes the minimum quality standards for all the medium and low complexity pathology laboratories in Cali. At the HUV, the protocols of the College of American Pathologists (CAP) were implemented to generate synoptic pathology reports of all tumor excisions 88, also an internal quality control program, and an external program with the Royal College of Pathologists of Australasia Quality Assurance Programs (RCPAQAP) 89. In parallel, and as a first step towards the objective of improving and integrating information systems in Cali, the RPCC has promoted the use of cancer notification systems, and has supported the creation of hospital cancer registries in four tertiary-level hospitals with integrated oncology services 87.
Role of cancer registries in cancer control
The PDCC aims to reduce the morbidity and mortality of this group of diseases. Cancer registries provide incidence, mortality, and survival estimates that serve as baseline indicators to monitor the impact of interventions 42. Through collaborative work with national reporting systems, it may contribute to the construction and monitoring of cancer survivor cohorts. The survival estimate is a summary measure that shows us the efficacy of cancer care and interventions for risk control and early detection of the disease. It is a priority that cancer registries collect information on the tumor stage for cancers prioritized by the PDCC, and that they carry out timely analysis of the cancer situation in the area of influence, in order to contribute to knowledge management. With the information from cancer registries, health authorities have objective inputs to plan the infrastructure and human talent needs of the oncology services network.
Strengths and limitations
The interaction of the RPCC with the academy and collaborative work with the network of state and private oncology services; regional and national health authorities have been decisive in the continuity of cancer registry operations during the last 60 years in Cali. The information disclosed in this article represents the average risk of becoming ill and dying from cancer in Cali, a city of 2.2 million inhabitants, with 30% Afro-Colombian population.
The notification systems of the Colombian Ministry of Health facilitate the collection of cancer incidence information, and contribute to ensuring that information be timely. Unfortunately, cancer information in medium complexity pathology laboratories continues in unstructured formats, so great efforts are required to consolidate the information. It is important to strengthen hospital cancer registries in institutions that have integrated cancer services. However, it is necessary to standardize the methods to achieve comparability and implement interoperability schemes and standards for the transfer of information.
One of the major limitations of this study is the lack of information on staging at the time of diagnosis, and active follow-up of prevalent cancer cases.
The mortality: incidence ratio was greater than one in liver, lung and pancreas tumors. This phenomenon can have several causes, such as the lack of exhaustiveness in the extraction of information in the cancer registry, difficulties for patients to accessing, as well as for having a timely oncological care, patients who do not consult for personal reasons, and lack of diagnosis, the fact that that patients with fast-growing tumors can die between the consultation interval, without being detected in time.
Specific investigations are required to detect and correct the determinants of this underreporting. Collaborative interinstitutional work with hospital cancer registries and the entities in charge of cancer notification (SIVIGILA and CAC) will make it possible to correct this limitation of cancer information in Cali

