


 text in
  English (pdf)
 Article in xml format
 Article references
 Send this article by e-mail
 Cited by SciELO
  Cited by Google
  Similars in
SciELO
Similars in
SciELO  Similars in Google
 Permalink
Remark
| 1) Why was this study conducted? |
| To provide the most recent the age-standardized net survival for the main 9 cancers in the Population Cancer Registry of Cali (RPCC) diagnosed between 1998-2017 estimated using standard methodologies. To compare the updated survival estimates with those previously published by the RPCC and the CONCDORD study for cancers prioritized by the current Ten-Year Plan for Cancer Control in Colombia, 2011-2020. |
| 2) What were the most relevant results of the study? |
| A significant advance in survival among patients with colorectal cancer and hematolymphoid neoplasms. On the other hand, survival has remained stable for cancers with screening activities (breast, prostate, and cervix). As for lung and stomach cancer survival was less than 25%. Survival estimates for the period 2010-2014 updated by the RPCC-IARC in 2021 were significantly higher than those obtained by CONCORD-3, whereas survival estimates through 1995-2009 had no difference. |
| 3) What do these results contribute? |
| Survival indicators that can be used to monitor and evaluate national cancer control program including the current Ten-Year Plan for the Control of Colombian Cancer and other initiative such as the City Cancer Challenge initiative. Evidence of underestimation of survival in population-based cancer registries that have timely notification of mortality with insufficient passive follow-up. |
Introduction
The cancer burden in Colombia is rising. The most recent estimates show that 110,000 new cancer cases and 55,000 deaths from cancer are reported in 2020 1. Over time we have seen that incidence for major cancer such as breast, prostate, colorectal, thyroid are increasing while for other such as lung, oral cavity, stomach and cervical are decreasing 2-4. While incidence has been increasing, mortality from cancer has been stable or decreasing suggesting overall improvement in breast, prostate, colorectal and lung cancer. Yet in order to truly estimate the effectives of early diagnosis through cancer awareness, early detection through screening or cancer management through quality treatment, population based- cancer survival estimates are key.
Previous study showing international comparison of survival showed that Colombia has overall good survival in south America. For example, for breast cancer 5-year net survival in Cali was 71.1% as compared to 86.7% in Costa Rica and 39% in Cuenca, Ecuador which are the highest and the lowest survival estimates in the region. Another common cancer is Prostate, and Colombia ranked second with a survival estimate of 83.6% 5.
Colombia has a Ten-year plan for cancer control and there has improvement in terms of access to early detection and treatment 6. The cancer control program has prioritized the control of cervical, breast, colorectal, prostate, stomach, and childhood cancer and may therefore improve the survival for theses cancers. Yet a systematic assessment of cancer survival in the country is missing. The Cali Population-based Cancer registry has been operating since 1962 and collected data for patients follow-up since 1962, and can therefore provide a valuable information on the country’s effectiveness to care for cancer patients over time.
This collaborative work between the International Agency for Research on Cancer (IARC) and the RPCC has two objectives. The first one is to implement a standard method in the Cali Population Registry of Cancer to update the survival estimates for the period 1998-2017. The second objective is to compare the updated estimates with those previously disclosed by the RPCC and the CONCORD study for cancers prioritized by the current Ten-Year Plan for Cancer Control in Colombia, 2012-2021.
Methods
Population and registry area
Cali is the third city in Colombia, capital of the Valle del Cauca Province, with a population of 2.2 million inhabitants in 2018, 53.6% are women 7. The coverage area of the cancer registry is the municipality of Cali, with a density of 40.42 inhabitants/hectare 8. There are 48 older adults (65 years and over) for every 100 children and youth (under 15 years) 7. The cancer care network has 165 authorized cancer services, located in the urban area, where 95% of the population lives. Cancer care is fragmented; and only five hospitals offer integrated cancer services, one of them is a public (state) institution 9.
Cancer cases extraction
Information on new cancer cases was obtained from the population-based database of the Cali Cancer Registry. New cases of cancer in permanent residents of the city are obtained continuously through active search and notification. Collection is continuous in diagnostic laboratories (pathology, cytology, flow cytometry), hospitals and clinics, both public and private; and in the Public Health Secretariat of Cali (death certificates and cancer notification systems). Procedures for updating information and including new cases in the database have been previously described 8.
Case definition
Men and women of any age who reside in the urban area of Cali, with a diagnosis of invasive malignant tumor for the first time (incident), of any anatomical location, independently that it has been confirmed or treated partially or totally. The basis for diagnosis can be either microscopic (fluid cytology, peripheral blood and bone marrow, histology of primary tumors, and autopsy), and non-microscopic (clinical, surgical and imaging diagnosis). It includes single or multiple primary malignant tumors, all tumors of the Central Nervous System (CNS) and in situ cancer of the breast and cervix. There are excluded benign tumors of uncertain behavior, malignant tumors of metastatic sites, and basal cell and squamous cell carcinoma of the skin (although they were included until 1986). Cases that have arrived in the city for treatment or diagnosis are not considered residents of Cali 8.
Inclusion criteria
Individual data from adult men and women (15 to 99 years old) residing in Cali, Colombia, diagnosed with a first invasive malignancy were included.
Exclusion criteria
Tumors identified as in situ, benign or of uncertain behavior, cases with death certificate as the only evidence of cancer diagnosis (DCO) were excluded; and as well as cases with unknown age, unknown sex, date of diagnosis equal to date of last contact when it is DCO, and those with date of death prior to the date of incidence.
Update of survival estimates
The method for estimating survival was updated and unified for the period 1998-2017, with follow-up until 2018. The following 9 locations were included: stomach (C16), colorectal (C18-C20), lung (C34), breast in women (C50), cervix (C53), prostate (C61), thyroid (C73), and myeloid and lymphoid neoplasms. Following the guidelines of the CONCORD program 5,11, the groups of solid tumors were defined by the anatomical site, and leukemias and lymphomas by their morphology. Topography and morphology were coded using the International Classification of Disease for Oncology, third edition (ICD-O-3) 12. All hematopoietic malignancies were included according to the ICD-O-3 morphological code range, from 9590 to 9989.
Comparison of survival estimation methods
There were included the following cancers, which were prioritized in the PDCC, diagnosed between 1995 and 2014, and with follow-up until 2015: stomach (C16), breast (C50), cervix (C53), prostate (C61), and lung (C33-34). It was selected the same data set submitted by the RPCC to the CONCORD-3 study. The standardization, cleaning and construction of the quality indicators was done with the method used by IARC, which will be described in the following paragraphs. In previous publications, the RPCC estimated relative survival using the Ederer II method; and net survival using the Pohar-Perme method, with and without age standardization 3.
In the year 2021, the date of last contact for the same data set was updated and constitutes the reference pattern for comparisons of survival estimates made by the CONCORD study and by the RPCC in previous publications.
Definition of event, start date, and end date
Death from any cause was considered a failure. The survival time of each case was determined by the time difference between the date of diagnosis and the date of death, the date of last contact, or the date of closure of follow-up (December 31, 2018 for the first objective and December 31, 2014 for the second objective) 10.
Passive tracking
The RPCC does not establish any contact with patients, their relatives or their doctors in order to find out their vital status and date of last contact. The information is entirely and permanently extracted from local, regional and national databases.
Local and regional databases
Each case of cancer that enters the RPCC (incident or prevalent) is checked against the following databases: a) General mortality, which is periodically obtained from the individual death certificates notified to the Public Health Secretariat of Cali (560,000 records); b) Hospital discharges from medium and high complexity institutions (one million records); c) Pathology reports (700,000 records), d) national cancer notification systems (one million records); and e) public and private health insurers (six million records). From the set of dates obtained, the most recent is extracted; then, the vital status is verified through a set of rules to determine whether the case is still alive (or not).
National databases
When a publication is made or the data set is sent to CONCORD, the cancer cases that remain alive with incomplete follow-up (<5 years) are identified, and an individual search is made using the I.D. card in the unique database of members of the general system of social security in health (BDUA) that provides information for the recognition of periodic payments made to public and semi-private health insurers 13. The last date on which the person has compensated in the social security system is obtained and assigned as the date of last contact and living vital status. In the event that the vital status is deceased, this value is assigned and as the date of last contact, the date of termination of affiliation in the system. If the person is not found, the National Registry of Civil Status of Colombia 14 is consulted; if the person is valid in the electoral roll, he/she is considered alive; and as the date of last contact, it is assigned the date of consultation to the database. In case the novelty is canceled due to death, the vital status is assigned as ‘dead’; and as date of last contact, the date of the novelty.
Full tracking
It was defined as people who died before, or on the same date as the deadline of follow-up; or people who die after the deadline of follow-up; or people who are alive and the date of last contact occurs later than the deadline of follow-up.
Incomplete tracking
It was defined as those people who are alive, and the date of last contact is less than the closing date of follow-up.
Standardization, cleaning, and quality indicators
Standardization was performed to facilitate unequivocal exclusion of cases from the study, and to provide a uniform coding format for mandatory variables.
The consistency of the variables required for survival analysis was evaluated using the tool DEPedits 15. Errors and warnings in the data set were identified and corrected, and variables were generated for: 1) Quality control ENT#091;morphological verification (MV) and DCOENT#093;, 2) Identifying those under 15 years of age; 3) Determining follow-up times in years (<1, 1 to 3, 3 to <5, and 5+); 4) Identifying the cases included in the analysis (0 and 1); and 5) Identifying the cases with complete follow-up (0 and 1).
With the obtained information, the following indicators were constructed: a) Number of cases; b) Number of children under 15 years of age; c) Percentage of cases with MV and DCO; d) Number and percentage of cases excluded from survival analysis (lack of follow-up (DCO) and other errors (cases with unknown age, unknown sex, or behavior other than malignant); e) Number and percentage of cases included in the analysis; f) Number of deaths; g) Percentage of complete follow-up; h) Observed survival at 1, 3 and 5 years; and i) Median follow-up in months.
Survival analysis
The outcome variable was the time elapsed between the diagnosis of cancer and death. The maximum observation time for each subject for failure to occur was five years. As censorship mechanisms, there were considered patients lost to follow-up, as well as those who remained alive at the end of the study (December 31, 2018 and December 31, 2014 according to the objectives) 10.
The estimation of the 20-year survival analysis was made by combining the cohort analysis for the following five-year periods: 1998-2002, 2003-2007, 2008-2012; and 1995-1999, 2000-2004, 2005-2009; and the period analysis for the five-year periods 2013-2017 and 2010-2014, according to the first and second objectives, respectively.
Five-year net survival estimates were calculated using the Pohar-Perme estimator 16. In order to build life tables for the survival study, reliable denominators based on censuses and population projections are required. The demographic structure of the population and general mortality by simple age, sex and calendar year were obtained from the National Department of Statistics of Colombia-DANE 7. The life tables of the general population of Cali in simple ages, by sex and for each calendar year were made by the CONCORD-2 and 3 study 5,11. To perform the standardization by age, the weights of the International Cancer Survival Standard (ICSS) were used 17.
Results
Survival analysis (1998-2017)
Figure 1 and Supplementary Table 1S present the updated estimates of age-standardized 5-year net survival (5-year NS), for men and women during the period 1998-2017 for the selected tumors; and in Figure 2 and Supplementary Table 2S, the same estimates for both sexes.
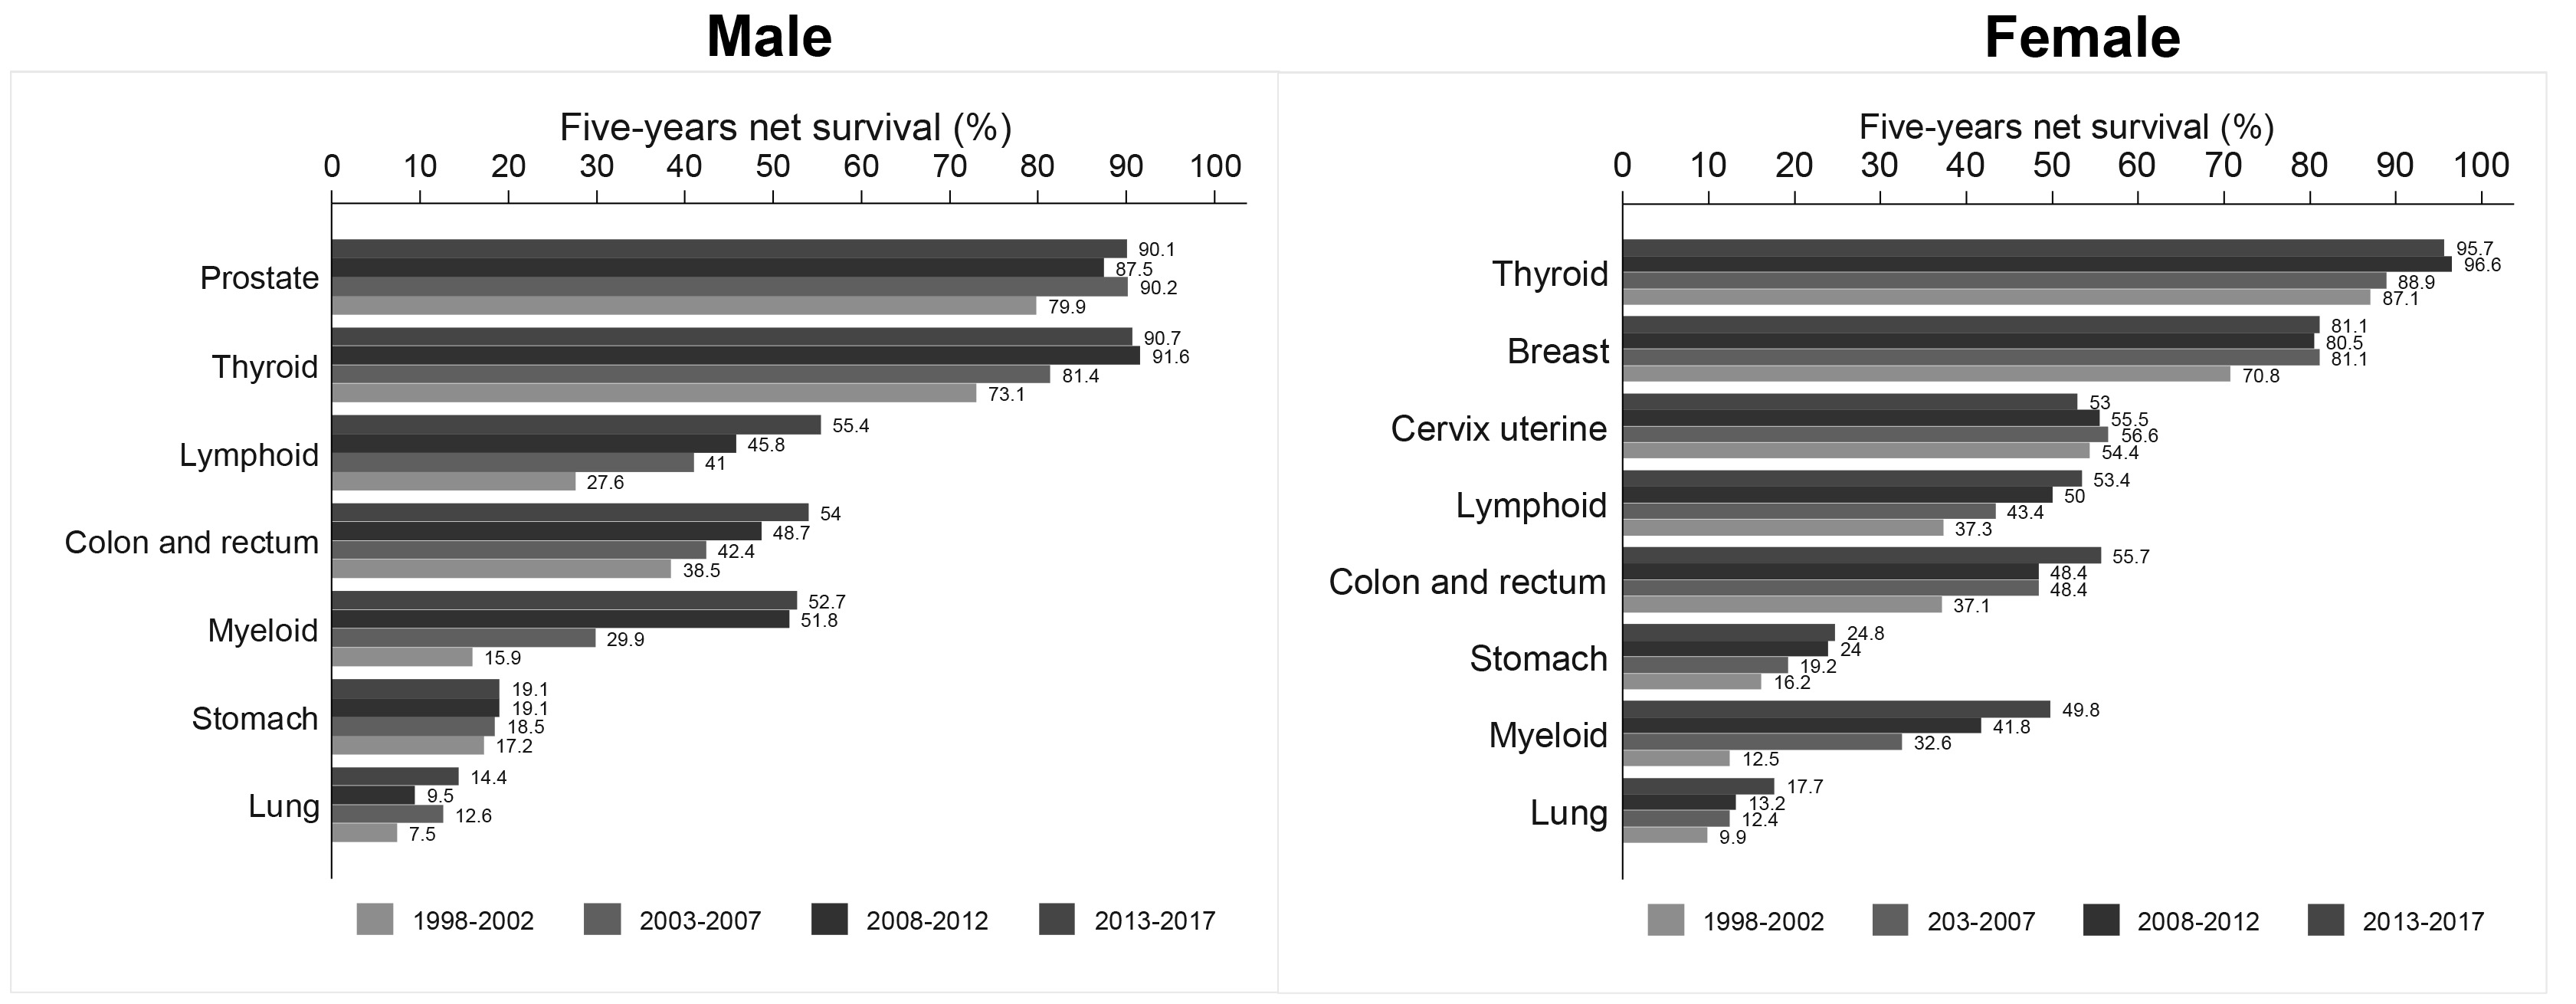
Figure 1 Cali, Colombia. 5-year net survival standardized by age (NS%) in adults (15-99 years), according to sex and period.
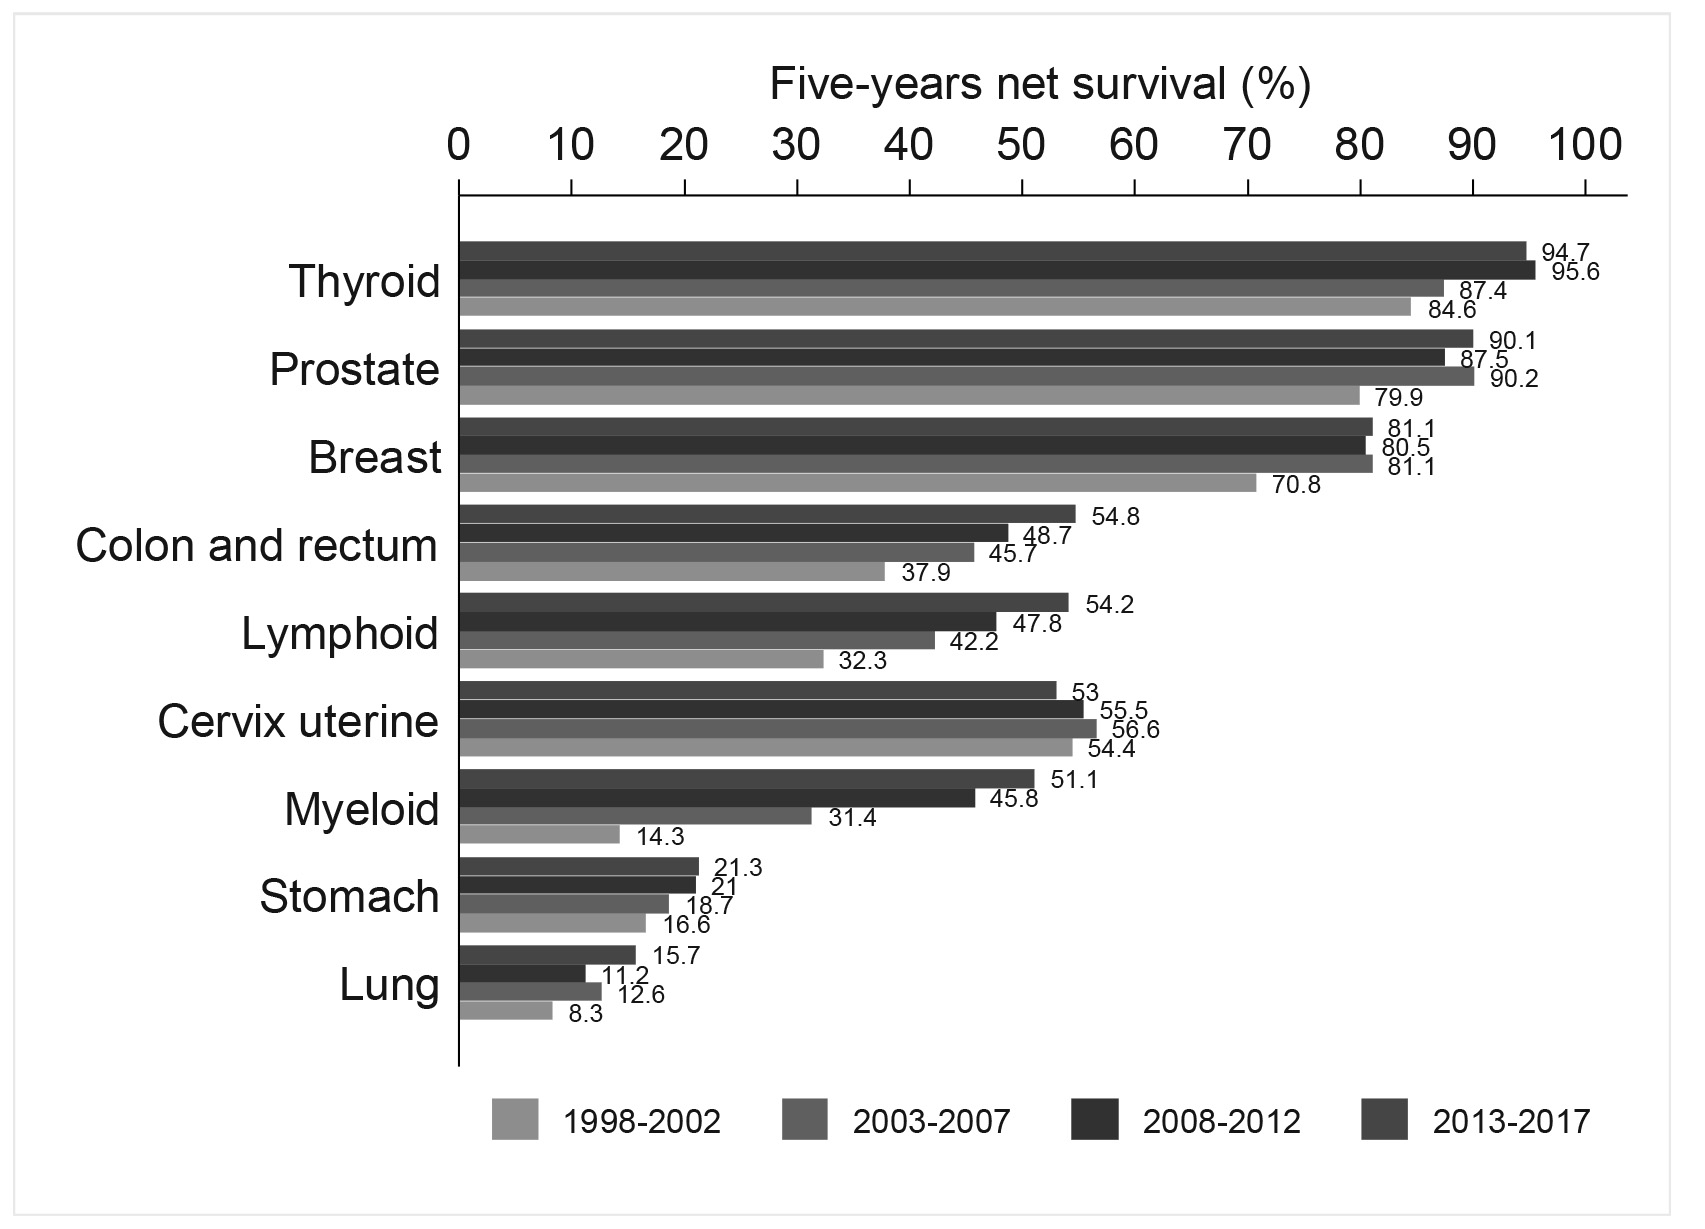
Figure 2 Cali, Colombia. 5-year net survival standardized by age (NS%) in adults (15-99 years), according to period. Both sexes.
Stomach cancer
The 5-year NS remained stable in men; and in 2013-2017, it was 19.1%. Until 2007 there was no difference by sex; since then, it is higher in women. In the last decade, it increased seven percentage points, from 16.2% in 1998-2007 to 24.8% in 2013-2017.
Lung cancer
The NS at five years was the same for men and women, except in the period 2008-2012, when it was higher in women (Table 1S). The 5-year NS estimates for the 2013-2017 five-year period should be interpreted with caution, because the mortality:incidence ratio was greater than 1, which suggests underreporting of lung cancer during this period.
Breast cancer
The 5-year NS for women with breast cancer was 70.8% for the period 1998-2002; it increased 10.3 percentage points in the following five-year period and remained stable during the last 15 years. For the 2013-2017 period, it was 81.1% (95% CI: 78.7;83.3).
Cervical cancer
The 5-year NS remained stable during the two decades; for the five-year period 2013-2017, it was 53% (95% CI: 49.8; 56.2).
Prostate cancer
The 5-year NS remained stable during the last fifteen years. For 2013-2017, it was 90.1% (95% CI: 87.8;92.0). The 5-year NS was 10.2 percentage points higher than that estimated in the period (1998-2002).
Colorectal cancer
The 5-year NS was independent of sex; except in 2003-2007, when it was higher in women. The 5-year NS increased progressively in men and women; for the period 2013-2017, it was 54.8% (95% CI: 52.1; 57.4), an increase of 16.9 percentage points compared to the first five-year period (Table 1S).
Thyroid cancer
The 5-year NS increased 10 percentage points in both sexes, going from 84.6% (period 1998-2002) to 94.7% (period 2013-2017) (Table 2S). In women, SN-5 years was higher than in men, but the gap decreased from 14 percentage points in the first five years, to 5 percentage points in 2013-2017 (Table 1S).
Myeloid neoplasms
The 5-year NS was the same for men and women except in the first five years, when it was higher in women. The 5-year NS increased progressively in men and women during the two decades; for the period 2013-2017, it was 51.1% (95% CI: 45.4;56.5), an increase of 21.9 percentage points compared to that observed in 1998-2002 (Table 2S).
Lymphoid neoplasms
The survival estimate was similar to that in myeloid neoplasms; in 1998-2002, the SN-5 years was higher in women; then, it was independent of sex; for the period 2013-2017, it was 54.2% (95% CI: 50.9;57.4), an increase of 12 percentage points with respect to the first five-year period, Table 2S.
Comparison of survival estimates for the period 1995-2014
In previous publications, the RPCC estimated relative survival using the Ederer II method 18-20; and net survival with that of Pohar-Perme 3. There was no standardization by age in the RPCC-2012 and RPCC-2014 publications 18-20. The CONCORD-2-3 study determined net survival with the Pohar-Perme 5,11; and age standardization with the weights of the ICSS standard 17. Table 1 shows the results of the comparisons of survival estimates for the period 1995-2014, with follow-up until 2015 and with the respective update dates of the date of last contact for each publication. The tumors included in the analysis correspond to the cancers prioritized by the current PDCC of Colombia, for the period 2012-2021.
Table 1 Cali, Colombia. Comparison of methods for estimating relative and net five-year survival.
| Estimation method | Net five-year survival (%) 95% CI | Net five-year survival (%) 95% CI | |||||||||||||
|---|---|---|---|---|---|---|---|---|---|---|---|---|---|---|---|
| Publication | RPCC-201420 | RPCC-201218,19 | RPCC-20183 | CONCORD-211 | CONCORD-35 | RPCC-IARC | REFERENCE | ||||||||
| End follow-up | 2005 | 2005 | 2010 | 2011 | 2014 | 2015 | 2018 | ||||||||
| Last contact update date | Mar-2014 | Sep-2013 | Aug-2015 | Mar-2013 | Oct-2016 | Mar-2018 | Aug-2021 | ||||||||
| Period | |||||||||||||||
| Prostate | |||||||||||||||
| 1995-1999 | 68 | 64-72 | 63 | 60-67 | 68.1 | 64.1-72.1 | 66.7 | 62.6-70.8 | 67.8 | 63.6-71.5 | 68.7 | 64.4-72.7 | |||
| 2000-2004 | 79 | 76-82 | 74 | 70-76 | 81.1 | 78.3-84.0 | 80.3 | 77.4-83.3 | 84.3 | 81.3-87.3 | 83.9 | 80.5-86.7 | 84.1 | 80.9-86.8 | |
| 2005-2009 | 83.2 | 80.7-85.8 | 78.7 | 75.,4-82.0 | 87.8 | 85.4-90.3 | 86.5 | 83.3-89.1 | 88.9 | 86.1-91.1 | |||||
| 2010-2014 | 80.3 | 77.6-83.1 | 87.2 | 84.6-89.4 | |||||||||||
| Breast | |||||||||||||||
| 1995-1999 | 62 | 59-65 | 62 | 59-65 | 65.7 | 61.3-70.1 | 65.7 | 61.0-70.3 | 63.6 | 60.6-66.5 | 67.0 | 62.2-71.4 | |||
| 2000-2004 | 68 | 66-71 | 69 | 66-71 | 69.7 | ENT#091;6.4-73.1 | 69.2 | 65.7-72.7 | 71.6 | 68.2-75.1 | 70.9 | 68.6-73.2 | 72.4 | 68.8-75.6 | |
| 2005-2009 | 74.4 | 71.1-77.6 | 73.1 | 69.2-77.1 | 79.8 | 76.7-83.0 | 76.8 | 73.1-80.0 | 81.8 | 78.6-84.6 | |||||
| 2010-2014 | 71.1 | 67.9-74.3 | 78.5 | 75.4-81.1 | |||||||||||
| Cervix uteri | |||||||||||||||
| 1995-1999 | 50 | 47-54ENT#093; | 50.5 | 46.5-54.5 | 50.5 | 46.3-54.6 | 52.8 | 49.1-56.4 | 51.5 | 47.3-55.6 | |||||
| 2000-2004 | 60 | 56-63ENT#093; | 56.9 | 53.2-60.7 | 57.1 | 53.3-61.0 | 56.1 | 52.3-59.9 | 60.1 | 56.6-63.5 | 55.1 | 51.4-58.7 | |||
| 2005-2009 | 57.7 | 54.0-61.5 | 59.2 | 54.8-63.5 | 56.4 | 52.8-60.0 | 59.1 | 55.1-62.9 | 58.2 | 54.6-61.6 | |||||
| 2010-2014 | 46.0 | 42.1-49.8 | 53.0 | 49.5-56.4 | |||||||||||
| Lung | |||||||||||||||
| 1995-1999 | 5 | 4-7ENT#093; | 6.6 | 4.7-8.6 | 6.1 | 4.2-8.0 | 6.6 | 4.9-8.7 | 6.8 | 5.1-8.9 | |||||
| 2000-2004 | 7 | 5-9ENT#093; | 9.0 | 6.8-11.1 | 8.9 | 6.7-11.1 | 9.4 | 7.2-11.5 | 9.3 | 7.4-11.6 | 11.5 | 9.3-13.9 | |||
| 2005-2009 | 9.6 | 7.6-11.7 | 9.0 | 6.6-11.4 | 10.5 | 8.5-12.5 | 10.2 | 8.4-12.2 | 12.0 | 10.1-14.2 | |||||
| 2010-2014 | 8.7 | 6.7-10.6 | 14.4 | 11.9-17.1 | |||||||||||
| Stomach | |||||||||||||||
| 1995-1999 | 15 | 13-18ENT#093; | 15.7 | 13.3-18.1 | 15.4 | 13.1-17.8 | 16.3 | 14.1-18.6 | 16.0 | 13.8-18.4 | |||||
| 2000-2004 | 17 | 14-19ENT#093; | 17.9 | 15.5-20.3 | 17.7 | 15.2-20.2 | 18.4 | 16.0-20.9 | 19.1 | 16.8-21.5 | 19.8 | 17.5-22.2 | |||
| 2005-2009 | 17.4 | 15.2-19.6 | 16.6 | 13.9-19.2 | 18.1 | 15.9-20.2 | 19.0 | 16.9-21.1 | 19.3 | 17.3-21.5 | |||||
| 2010-2014 | 17.1 | 14.7-19.4 | 24.0 | 21.5-26.5 | |||||||||||
Survival estimates with the IARC-RPCC standardized method are presented in the penultimate column of Table 1 with the date of last contact updated in May 2018. The reference pattern for making comparisons is shown in the last shaded column, and corresponds to the estimates of net survival at five years, obtained by the RPCC with the Pohar-Perme method, standardized by age with the international ICSS weights 17. The shaded cells in Table 1 show survival estimates that are different from those obtained with the reference standard. The follow-up was maintained until 2015, and subsequent failures continued to be censored. The update of the date of last contact to August 2021 had the objective of reducing the number of people with incomplete follow-up during the period 1995-2014.
Survival estimates for cancers of the stomach, cervix, breast, prostate, colorectal, and stomach from the CONCORD-3 study are higher than those from CONCORD-2. The updated estimates of net survival made by the RPCC with the method implemented in the IARC are significantly higher than those published by CONCORD-3 for the period 2010-2014.
The survival estimates for the period 1995-2004 made by the RPCC in 2018 (without IARC methods) 3 and those of CONCORD-3 were similar to those obtained with the reference standard for all cancers, except for lung cancer.
Table 1 shows the comparison of the methods for estimating relative and net five-year survival for the main tumors: 1) Five-year relative survival performed by the RPCC for the main tumors; 2) Five-year net survival performed by the programs CONCORD 2 and CONCORD 3 for the main tumors; and 3) Five-year net survival estimated with the procedures standardized by RPCC-IARC, explained in the methodology.
The monitoring practices carried out by the RPCC for submitting data to the programs CONCORD 2 and CONCORD 3 are different, different monitoring methods are observed, showing better monitoring for the last group of data updated to 2014.
Those cases with survival time equal to zero were not included in the survival analysis, they are not DCO because they were already excluded in the standardization of the analysis base; probably, they are cases that were not followed up and are the cause of lack of follow-up.
In the quality indicators, it is observed that for the year 2014, in all the tumors there is a very high percentage of DCO compared to previous years, probably due to lack of screening.
Discussion
Updated estimates of net survival are presented here for 59,911 cancer patients from 9 locations that collectively represent 65.7% of all cases diagnosed in Cali between 1998 and 2017. The date of last contact was updated to August 2021; and net survival was estimated with the Pohar-Perme method with age standardization using the weights of the ICSS international standard 17. For the period 1998-2012, cohort analysis was carried out; and for 2013-2017, period analysis. Updated net survival estimates for the Cali population were compared with those previously reported by the CONCORD study.
For several common cancers such as breast, cervical and colorectal cancer, organized population-based screening may improve early detection and therefore survival. However, Colombia does not have organized population screening programs; and early detection of cancer in adults has lost its vertical and centralized nature, and it is based on a set of opportunity screening activities carried out by health insurers and their service networks, which have fragmented care oncology 21. As such we have seen diverse survival pattern over time for these cancer types amenable to screening. For example, cervical cancer survival has remained stable, whereas for breast and colorectal cancer slight improvement was observed, which may also be linked to better access to quality treatment. The current PDCC prioritizes the control of cervical, breast, prostate, colorectal and stomach cancers.
The benefits of screening may be overestimated by self-selection, waiting time, and disease duration bias 21. In organized screening programs, participation is larger among people with a tendency to seek medical care, with healthy lifestyles, with greater self-care and adherence to treatment than non-participants; as such that the former has been reported of having longer life expectancy than non-participants linked to these factors, and not due to participation to screening. The waiting time (lead-time) is the artificial addition of an amount of survival time in advance in the diagnosis of the cases detected by screening.
Disease duration bias is related to biological behavior; and it is important. Slower-growing, indolent breast and prostate tumors tend to be less lethal, and they are more likely to be detected by programs. People with fast-growing lethal tumors of the esophagus, stomach, and pancreas may die during the interval period, and not being detected by screening. The extreme form of this bias is the overdiagnosis of tumors that would not have been treated had they not been detected. Some precancerous lesions (carcinoma in situ of the breast and cervix) would never have become invasive or given rise to symptoms in the absence of screening 22.
The 5-years SN to cervical cancer in women from Cali was 53% (95% CI: 49.8;56.2); and it remained stable during the last 20 years despite the increase in the incidence rates of precancerous lesions and the mean annual decrease of 3.1% in incidence rates, and 3.5% in cancer mortality rates 4. These findings suggest that current early detection methods (cervical-vaginal cytology) are insufficient for cancer control, and that there are few therapeutic advances for women with cervical cancer who are diagnosed with advanced disease. It is urgent to strengthen primary prevention through vaccination against high-risk genotypes of the HPV virus, and to implement the detection of high-risk HPV genotypes as a method of secondary prevention 23.
During the last fifteen years, the 5-years SN remained stable in Cali in women with breast cancer (81.1% (95% CI: 78.7; 83.3) and in men with prostate cancer (90.1% (95% CI: 87.8; 92.0)). In contrast, incidence rates increased in the 1990s, coinciding with the implementation of opportunity screening tests (mammography, PSA, and digital rectal examination); and since 2005, there has been stabilization with a downward trend 3. These findings suggest that patients with these cancers are being detected earlier and that there are therapeutic advances. There could be some degree of overestimation of survival due to earlier diagnosis related to early detection activities. Breast cancer biological sub staging allows for rationalization in the administration of neoadjuvant and adjuvant chemotherapy with endocrine (hormonal) therapies, chemotherapy, biologically targeted (antibody) therapy, and chemoprevention (tamoxifen). The efficacy of therapies against breast cancer depends on compliance with the full course of treatment 24.
Unlike breast cancer, interpreting trends in prostate cancer is more challenging due to limitations in understanding risk factors, the natural history of the disease, and uncertainty about the efficacy of screening and treatment interventions. The implementation of population screening with PSA in the 1980s produced a period effect on prostate cancer incidence rates, characterized by initial exponential growth, followed by a slowdown, stabilization, and decline since the beginning of the 21st century. Coinciding with the increasing detection of cancer cases, radical prostatectomy increased for localized disease, and androgen deprivation therapy was implemented 25.
The SN-5 years to colorectal cancer was similar for both men and women, and it increased progressively during the two decades evaluated. For the 2013-2017 period, it was 54.8% (95% CI: 52.1;57.4), an increase of 16.9 percentage points compared to the first five-year period. In contrast, there was a constant annual increase in incidence rates that was higher in men (2.2%) than in women (1.6%). The same trend was observed in mortality rates (1.7% vs. 0.6%) (Table 1S). In Cali, screening activities with occult blood and colonoscopy are minimal; and the increase in survival may be associated with advances in surgical and treatment approaches. Currently, patients with advanced disease have an increased use of adjuvant therapy, polychemotherapy for metastatic disease, and targeted biological agents. Separating the effects of prevention and treatment is challenging for interpreting survival in population-based studies. Overdiagnosis is well established in breast and prostate cancer screening, but its prevalence and effect in colorectal cancer remains unknown. The waiting time for CR has been estimated to be at least two years 26.
A challenge in interpreting time trends for hematolymphoid neoplasms is distinguishing actual changes in disease occurrence from artifacts caused by changes in diagnosis and classification of these neoplasms over time.
The incidence rates of lymphomas in Cali showed a constant annual increase of approximately 1%. In contrast, mortality rates decreased by approximately 1.5% in women and 0.7% in men. Regarding leukemias, there was also a decrease in mortality rates, 1.1% in women and 0.7% in men. In contrast, the incidence rates of leukemias had constant annual changes with a divergent trend; in men they increased by approximately 0.8%, while in women they decreased by 0.7% 4(4).
In hematolymphoid cancers, 5-years was similar by sex. For the five-year period 2013-2017, the SN-5 years in myeloid neoplasms was 51.1% (95% CI: 45.4;56.5); this represents an increase of 21.9 percentage points compared to that observed in 1998-2002. In lymphoid neoplasms, the behavior was similar, the 5-year SN in the 2013-2017 period was 54.2% (95% CI: 50.9; 57.4), an increase of 12 percentage points compared to the first five-year period.
Advances in cancer control in Cali are not enough because differences in clinical outcomes of cancer patients persist compared to high-income countries. Figure 3 shows survival in Cali and the United States for the nine main cancer sites during the 2008-2017 period. Cancer survival in Cali shows a gap when compared to the United States, and it reaches several percentage points in the cancers prioritized by the Ten-Year Plan for Cancer Control in Colombia: Prostate (7.0), breast (9.2), cervix (12.8) and colorectal (9.7). Increasing coverage and improving quality is a priority in four main areas: 1) basic oncology services; 2) management of cancer services; 3) quality of cancer care and 4) community access and integrated care 27,28.
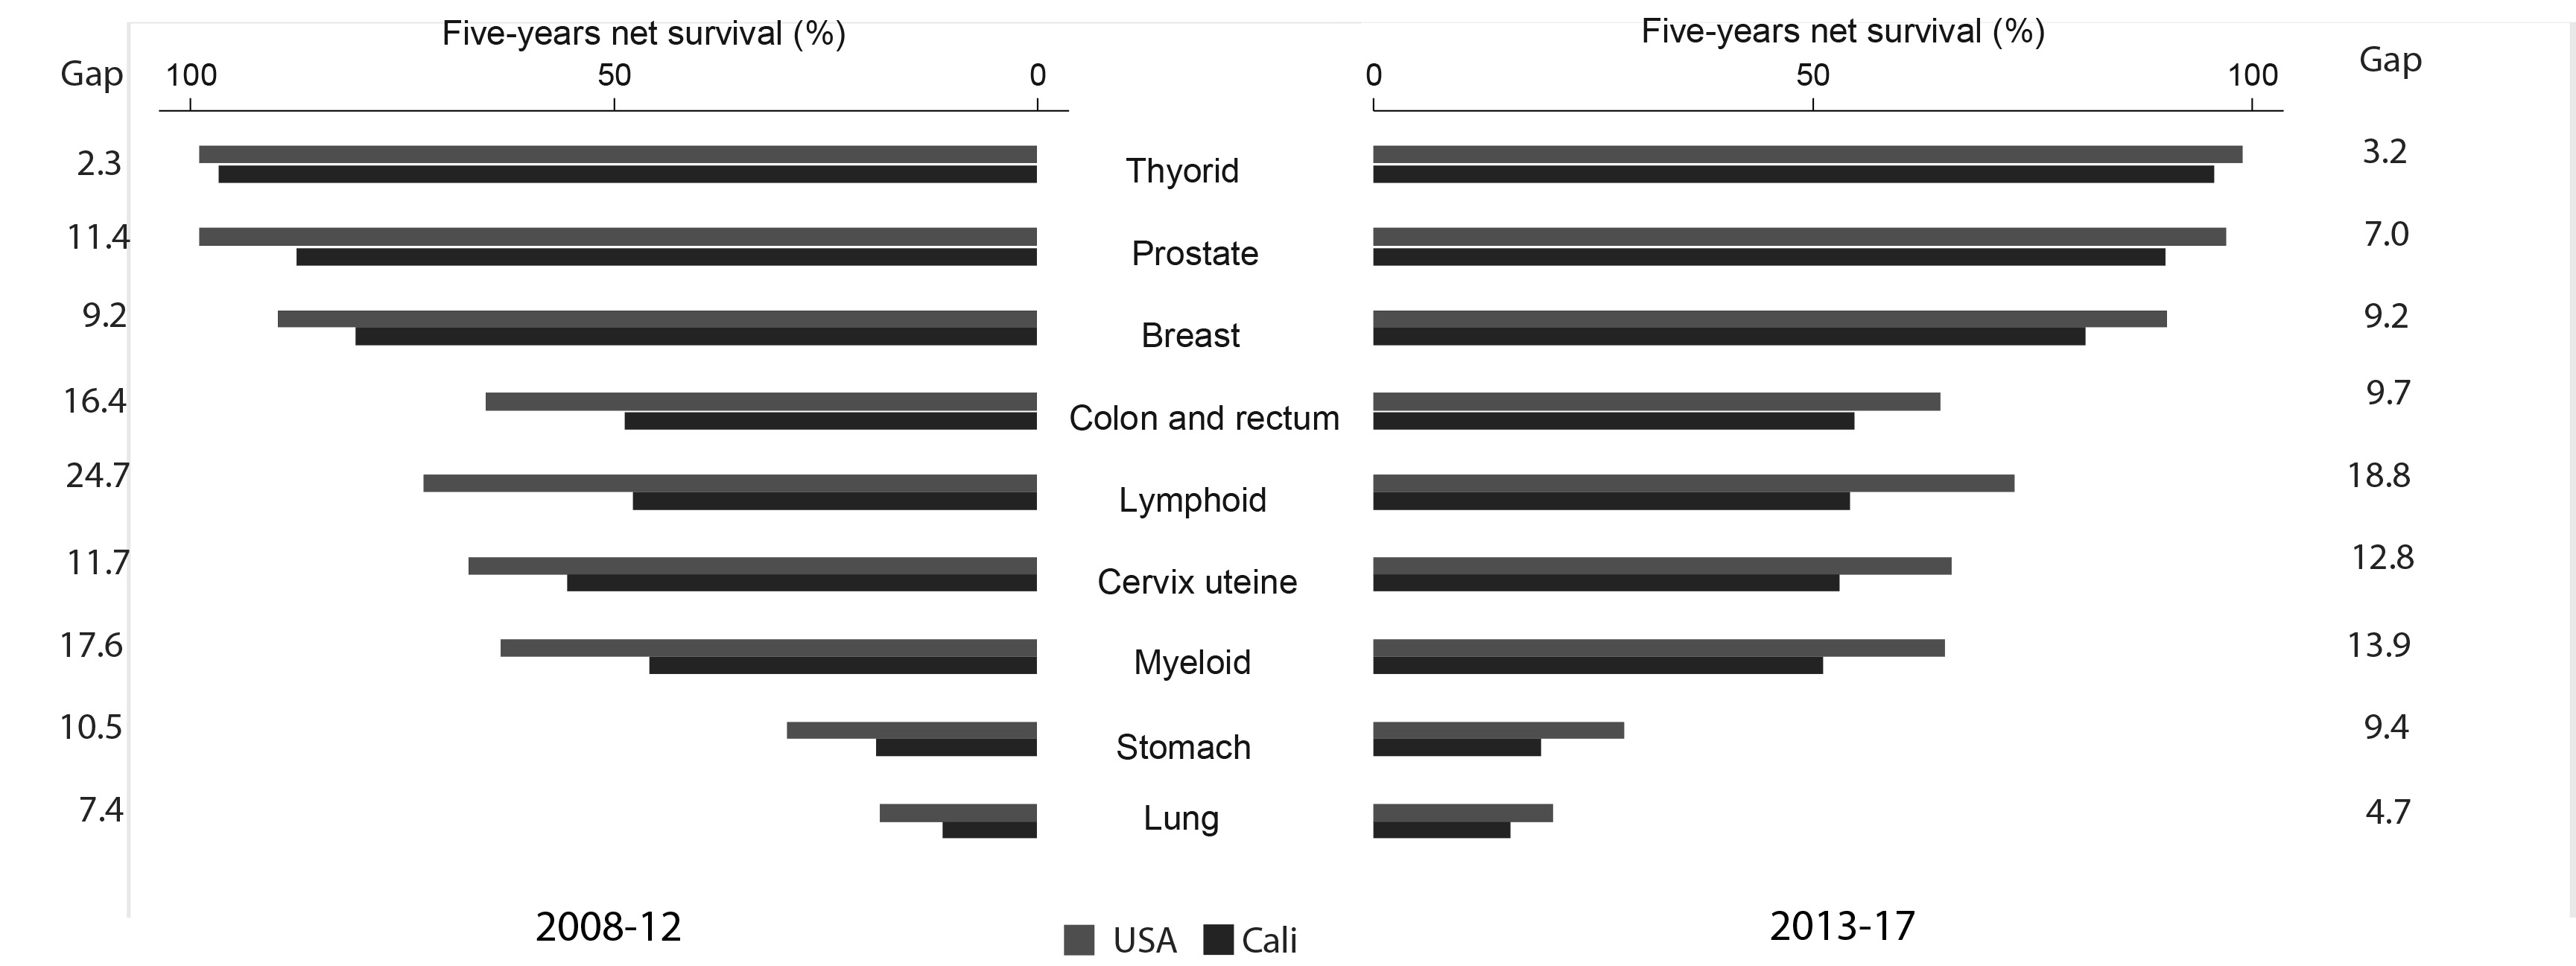
Figure 3 Comparison of 5-year cancer survival between Cali and the United States of America, periods 2008-2012 vs. 2013-2017.
Impact of passive follow-up on survival
Differences in survival estimates may be due to differences in health services, as well as cancer registry practice and data quality. Periodic updating of vital status and date of last contact reduces bias in survival estimates in population-based cancer registries that perform passive follow-up.
Net survival estimates for the period 2000-2009 updated by the RPCC in 2021 were similar to those reported by the CONCORD-3 study 5, the closing date to observe the failure was December 2009. These findings suggest that the periodic updating of the date of last contact has limits. In the case of Cali, the update was carried out in 2021, a decade after the end of the observation window to detect the failure (death) of the period 2000-2009; this update did not change previous estimates of survival for that period.
In contrast, net survival estimates from a more recent period, 2010-2014, updated by the RPCC in 2021, were significantly higher than those published by CONCORD-3 5. Both estimates of net survival, those updated by the RPCC and those obtained by CONCORD-3 5; were significantly higher than those published by CONCORD-2 11 for the same group of cancer patients from Cali during the same period (Table 1). The closing date to observe the failure was December 2014. These findings suggest that the data submitted by the RPCC to the CONCORD study in 2011 and 2014 had insufficient passive follow-up from the date of last contact. Unlike other cancer registries, in Cali there is a timelier and more efficient update of vital status.
The three studies used the same life tables of the population of Cali, the Pohar-Perme estimator 16, and the weights of the ICSS standard to standardize by age 17. Therefore, the underestimation of net survival for the period 2010-2014 in CONCORD-3 5 is not attributable to the estimation method. What differs between the studies is updateable data, such as vital status, date of incidence, and date of last contact, which can be improved with the periodic passive follow-up carried out by the Cali cancer registry. Updating the information with an earlier date of incidence and/or a more recent date of last contact increases survival time.
To understand the origin of this bias, it is necessary to review the flow of mortality information and the passive follow-up method used by the RPCC to periodically update the vital status and date of last contact of cancer patients.
Periodic updating of vital status
The Municipal Public Health Secretariat of Cali and the RPCC have had a strategic alliance for 40 years to guarantee the integrity and evaluate the validity of the information on incidence and survival; and to timely update vital status. Figure 4 shows the information flow of the individual certificates of general mortality, with the description of the causes of death in text, and the basic cause coded with ICD-10 29. In the RPCC, all causes of death are reviewed, cases with mention of cancer are extracted, the vital status of prevalent cases is updated, and there are identified new cases notified through the death certificate (DCN, for Death Certificate Notified).

Figure 4 Continuous notification of the information of the individual certificates of general mortality from the Ministry of Health to the RPCC. Retrospective follow-up of DCN cases is done in hospitals and pathology laboratories; its purpose is to update the date of incidence and the most valid basis for the diagnosis of cancer; and to exclude some cases that are not cancer. This process identifies new cancer cases by Death Certificate Initiate (DCI). The remainder are labeled as a case with only evidence of cancer on the death certificate: Death Certificate Only (DCO). Prospective follow-up: of new cancer cases aims to improve information about the person (date of birth), and the tumor (location and morphology); as well as updating vital status and date of last contact.
Periodic update of the date of last contact
The RPCC performs passive follow-up, and the information is obtained through links without contact with the patients, their families, or doctors. In order to estimate survival, it uses the “reported or documented alive” method, which takes into account the reported date of death and the date of last living contact if no date of death is available. This method censors patients on the date of last live contact.
Periodic screening in hospitals and pathology laboratories improves the date of incidence for new cases of cancer notified by the death certificate. It also improves the date of last contact for all cases (prevalent and incident); and as a result, the survival time. This method underestimates survival when there is timely knowledge of vital status and insufficient tracking of the date of last contact.
One of the limitations in survival studies is the dependence on contact with the person to obtain up-to-date information; therefore, there may be “immortal” people, who are those who have not been contacted and are considered alive; survival is overestimated with this “presumed alive” passive follow-up method 30.
Many Latin American cancer registries have barriers to access information from death certificates of cancer patients in their registry area; nor do they have access to regional and/or national office of vital statistics. In Colombia, these barriers are lower because current regulations allow access to sensitive data of cancer patients (identity and health status), in order to be used in public health surveillance 31-34.
Table 2 shows the survival estimates published by CONCORD-3 5 for cancers prioritized by cancer control programs in Latin America. Cancer survival is higher in North America; and the gap with Latin American countries is highly variable. It is noteworthy that in some countries, the censorship figures are around zero, with high estimates of survival for various types of cancer. This overestimation of survival suggests that these countries follow passively with the “presumed alive” method. Patients whose cancer registry could not be linked to a death registry were considered alive.
Table 2 Quality indicators for selected cancer sites in some countries of the Americas.
| Region / Country | CR | Five-year Net Survival (%) | Censored | ALL | Lost | Censored | ||||||||
|---|---|---|---|---|---|---|---|---|---|---|---|---|---|---|
| C50 | C53 | C16 | C18 | C61 | C50 | C53 | C16 | C18 | C61 | |||||
| America (Central and South) | ||||||||||||||
| Argentina | 5 | 84.4 | 52.7 | 21.5 | 51.8 | 87.6 | 0.0 | 0.0 | 0.0 | 0.0 | 0.1 | 5.7 | 0.0 | 2.3 |
| Brazil | 6 | 75.2 | 60.3 | 20.6 | 48.3 | 91.6 | 0.9 | 0.1 | 0.0 | 0.0 | 0.2 | 10.6 | 22.9 | 0.3 |
| Chile | 4 | 75.5 | 56.7 | 16.7 | 43.9 | 82.0 | 26.2 | 19.3 | 4.9 | 15.9 | 21.6 | 12.0 | 0.0 | 13.6 |
| Colombia | 4 | 72.1 | 49.4 | 16.7 | 45.0 | 80.3 | 28.0 | 19.5 | 11.1 | 23.1 | 29.5 | 11.3 | 0.0 | 21.0 |
| Costa Rica | 1 | 86.7 | 78.0 | 17.1 | 60.1 | 93.2 | 0.0 | 0.0 | 0.0 | 0.0 | 0.0 | 13.0 | 0.0 | 0.0 |
| Cuba | 1 | 75.1 | 72.9 | 36.7 | 63.9 | 71.4 | 0.0 | 0.2 | 0.0 | 0.0 | 0.0 | 5.1 | 2.6 | 0.0 |
| Ecuador | 5 | 75.5 | 52.0 | 19.1 | 48.7 | 82.2 | 3.4 | 2.5 | 1.4 | 2.2 | 3.5 | 9.9 | 0.3 | 2.7 |
| Puerto Rico | 1 | 84.1 | 63.5 | 34.6 | 63.4 | 98.4 | 0.0 | 0.0 | 0.0 | 0.0 | 0.0 | 3.4 | 0.0 | 0.0 |
| Uruguay | 1 | 56.5 | 53.5 | 86.5 | 0.0 | 0.0 | 0.0 | 0.0 | 15.0 | 0.0 | 0.0 | |||
| America (North) | ||||||||||||||
| Canada | 9 | 88.2 | 66.6 | 29.6 | 67.0 | 93.6 | 0.0 | 0.0 | 0.0 | 0.0 | 0.0 | 5.5 | 0.0 | 0.0 |
| United States | 48 | 90.2 | 62.6 | 33.1 | 64.9 | 97.4 | 0.0 | 0.0 | 0.0 | 0.0 | 0.0 | 2.8 | 1.5 | 0.0 |
Source: CONCORD-3 5
Methods to estimate survival
In survival studies, it is necessary to clearly define the start and end of follow-up, the event of interest, and the time unit to be used. The dependent variable is the time elapsed between the date of diagnosis and the development of the event (fault). These data may be modified upon receipt of new information. Survival time may be biased if passive follow-up is ineffective in updating vital status, date of last contact, or both.
When performing the survival analysis, censored data are presented where only the time to failure is known for a proportion of individuals, and only partial values are known for the others. The main causes for data censorship are related to loss to follow-up; the study ends before the failure occurs; or another event occurs that prevents the occurrence of the event, usually death in population-based cancer registries 35.
Cause-specific cancer survival is very difficult to obtain at population level; and it can only be estimated in controlled clinical trials and in hospital cancer registries. In these scenarios, other events such as relapse, appearance of metastases, abandonment of treatment, return to study or work, and resumption of sexual activity can also be analyzed. Cause-specific survival may be biased by misclassification of the cause of death, deaths related to cancer treatment, and information censorship 35.
Strengths
The Cali Population Cancer Registry has been operating continuously since 1962, providing information on incidence, mortality, and survival for Cali, Colombia. Survival information has been published in the CONCORD-2 11)- and CONCORD-3 5 studies. Cancer incidence information for Cali has been published in all eleven volumes of Cancer Incidence in Five Continents 36-46.
The RPCC can identify the cases notified by the death certificate (DCN); and performs prospective and retrospective tracking to update the information of all cancer cases. Periodic screening in hospitals and pathology laboratories improves the date of incidence for new cases of cancer notified by the death certificate. It also improves the date of last contact for all cases (prevalent and incident); and as a result, the survival time. This method underestimates survival when there is timely knowledge of vital status and insufficient tracking of the date of last contact.
Limitations
Cali lacks a census of the migratory movements of its population. The RPCC updates vital status in a timely manner, but periodic passive follow-up requires more effort and may lead to underestimation of survival.
The mortality to incidence ratio is greater than one in cancers of the esophagus, pancreas, and lung, which suggests that there may be some degree of underreporting of information.
The follow-up practices carried out by the RPCC for submission of data to the programs CONCORD 2 and CONCORD were different, different follow-up methods are observed, showing a better follow-up of the date of last contact for the last group of data updated to 2014. Passive follow-up, there is no staging information, insufficient crossing with national databases, there are no studies to evaluate the specific impact of screening studies.
Conclusions
There are significant differences in cancer survival between high-income countries and low- and middle-income countries. This may be due to differences in access to care and delays in diagnosis and treatment, but may also be due to population-level factors.
Differences in estimation methods may be due to DCO, exclusions, and completeness of follow-up. Censorships are related to loss to follow-up; a limitation of these studies is obtaining the last contact; there may be not-contacted people who are considered alive. Appropriate life tables guarantee reliable estimates of SN.

